NZDUSD to see a temporary move higher?NZDUSD - 24h expiry
There is no indication that the selloff is coming to an end.
A higher correction is expected.
Risk/Reward would be poor to call a sell from current levels.
A move through 0.5600 will confirm the bearish momentum.
The measured move target is 0.5525.
We look to Sell at 0.5650 (stop at 0.5700)
Our profit targets will be 0.5550 and 0.5525
Resistance: 0.5625 / 0.5650 / 0.5675
Support: 0.5600 / 0.5550 / 0.5525
Risk Disclaimer
The trade ideas beyond this page are for informational purposes only and do not constitute investment advice or a solicitation to trade. This information is provided by Signal Centre, a third-party unaffiliated with OANDA, and is intended for general circulation only. OANDA does not guarantee the accuracy of this information and assumes no responsibilities for the information provided by the third party. The information does not take into account the specific investment objectives, financial situation, or particular needs of any particular person. You should take into account your specific investment objectives, financial situation, and particular needs before making a commitment to trade, including seeking advice from an independent financial adviser regarding the suitability of the investment, under a separate engagement, as you deem fit.
You accept that you assume all risks in independently viewing the contents and selecting a chosen strategy.
Where the research is distributed in Singapore to a person who is not an Accredited Investor, Expert Investor or an Institutional Investor, Oanda Asia Pacific Pte Ltd (“OAP“) accepts legal responsibility for the contents of the report to such persons only to the extent required by law. Singapore customers should contact OAP at 6579 8289 for matters arising from, or in connection with, the information/research distributed.
Setup

ACT: Classic Range Accumulation with Breakout Potential#ACT is showing clean sideways movement with classic deviations—textbook accumulation. Horizontal volume is stacked right in the middle, confirming the range is solid.
This one’s coiling up for a move. Follow me so you’re in before it breaks out. 🚀
Entry: 0.052-0.0536
TP: 0.068
SL: 0.0463

Has SPX formed a bottom?SPX500USD - 24h expiry
Price action looks to be forming a bottom.
A Doji style candle has been posted from the base.
Setbacks should be limited to yesterday's low.
We look to buy dips.
Risk/Reward would be poor to call a buy from current levels.
We look to Buy at 4900.5 (stop at 4767.5)
Our profit targets will be 5295.5 and 5365.5
Resistance: 5219.6 / 5350.0 / 5500.0
Support: 5100.0 / 5000.0 / 4812.2
Risk Disclaimer
The trade ideas beyond this page are for informational purposes only and do not constitute investment advice or a solicitation to trade. This information is provided by Signal Centre, a third-party unaffiliated with OANDA, and is intended for general circulation only. OANDA does not guarantee the accuracy of this information and assumes no responsibilities for the information provided by the third party. The information does not take into account the specific investment objectives, financial situation, or particular needs of any particular person. You should take into account your specific investment objectives, financial situation, and particular needs before making a commitment to trade, including seeking advice from an independent financial adviser regarding the suitability of the investment, under a separate engagement, as you deem fit.
You accept that you assume all risks in independently viewing the contents and selecting a chosen strategy.
Where the research is distributed in Singapore to a person who is not an Accredited Investor, Expert Investor or an Institutional Investor, Oanda Asia Pacific Pte Ltd (“OAP“) accepts legal responsibility for the contents of the report to such persons only to the extent required by law. Singapore customers should contact OAP at 6579 8289 for matters arising from, or in connection with, the information/research distributed.

USDJPY to continue in the downward move?USDJPY - 24h expiry
The rally was sold and the dip bought resulting in mild net gains yesterday.
Selling posted in Asia.
We have a Gap open at 147.02 from 04.04 to 06.04.
The medium term bias remains bearish.
A Fibonacci confluence area is located at 143.68.
Preferred trade is to sell into rallies.
We look to Sell at 147.02 (stop at 148.02)
Our profit targets will be 143.68 and 143.10
Resistance: 147.02 / 148.09 / 150.49
Support: 144.58 / 143.68 / 143.07
Risk Disclaimer
The trade ideas beyond this page are for informational purposes only and do not constitute investment advice or a solicitation to trade. This information is provided by Signal Centre, a third-party unaffiliated with OANDA, and is intended for general circulation only. OANDA does not guarantee the accuracy of this information and assumes no responsibilities for the information provided by the third party. The information does not take into account the specific investment objectives, financial situation, or particular needs of any particular person. You should take into account your specific investment objectives, financial situation, and particular needs before making a commitment to trade, including seeking advice from an independent financial adviser regarding the suitability of the investment, under a separate engagement, as you deem fit.
You accept that you assume all risks in independently viewing the contents and selecting a chosen strategy.
Where the research is distributed in Singapore to a person who is not an Accredited Investor, Expert Investor or an Institutional Investor, Oanda Asia Pacific Pte Ltd (“OAP“) accepts legal responsibility for the contents of the report to such persons only to the extent required by law. Singapore customers should contact OAP at 6579 8289 for matters arising from, or in connection with, the information/research distributed.

EURUSD forming a top?EURUSD - Intraday
Continued upward momentum from 1.0778 resulted in the pair posting net daily gains yesterday.
Trades at the highest level in 6 months.
A Fibonacci confluence area is located at 1.1105.
Our medium term bias is bearish below 1.1014 towards 1.0700.
There is scope for mild buying at the open but gains should be limited.
We look to Sell at 1.1160 (stop at 1.1245)
Our profit targets will be 1.0837 and 1.0700
Resistance: 1.1146 / 1.1160 / 1.1214
Support: 1.0837 / 1.0700 / 1.0675
Risk Disclaimer
The trade ideas beyond this page are for informational purposes only and do not constitute investment advice or a solicitation to trade. This information is provided by Signal Centre, a third-party unaffiliated with OANDA, and is intended for general circulation only. OANDA does not guarantee the accuracy of this information and assumes no responsibilities for the information provided by the third party. The information does not take into account the specific investment objectives, financial situation, or particular needs of any particular person. You should take into account your specific investment objectives, financial situation, and particular needs before making a commitment to trade, including seeking advice from an independent financial adviser regarding the suitability of the investment, under a separate engagement, as you deem fit.
You accept that you assume all risks in independently viewing the contents and selecting a chosen strategy.
Where the research is distributed in Singapore to a person who is not an Accredited Investor, Expert Investor or an Institutional Investor, Oanda Asia Pacific Pte Ltd (“OAP“) accepts legal responsibility for the contents of the report to such persons only to the extent required by law. Singapore customers should contact OAP at 6579 8289 for matters arising from, or in connection with, the information/research distributed.

NQ - Nasdaq's potential to reboundThe Median or Centerline:
The Median (Centerline) Line is the central element of the Pitchfork and acts as the equilibrium point. Price tends to oscillate around this line, and it often serves as a strong reference for potential reversals or price targets. A price move back toward the Median Line is common after significant moves away from it.
Pitchfork (Red):
The red Pitchfork, drawn through significant price points, provides the overall trend direction and shows the potential path to the downside. The red line indicates a bearish bias in the current setup, as it has been guiding the price lower.
Green Circles and Arrows:
These represent key areas of support.
The lower green circle and green arrows indicate price has found solid support in this region. The price has been bouncing from this support level, showing that it is reacting to the [ower boundary of the Pitchfork. This behavior aligns with the rule that the price tends to respect these boundaries, creating a foundation for a potential move back toward the Median Line.
Price Action Analysis:
The price recently tested the lower green circle and green arrows, bouncing off this support level, which is a typical reaction in a Pitchfork setup.
According to the Median Line theory , when the price moves too far away from the Median Line, it often returns toward it. Therefore, the bounce off the lower boundary suggests that price may now be setting up for a bullish reversal toward the RED Median Line .
Bottom Line:
The price action is following the general Pitchfork playbook . The bounce from the lower green circle suggests that the price is setting up for a potential bullish reversal toward the RED Median Line .
The next major test will be the upper resistance in the red Pitchfork , after the break of the Centerline. If the price can break through this resistance, a strong move higher is likely.
Keep an eye on this critical point!

AUDJPY to find sellers at market price?AUDJPY - 24h expiry
There is no indication that the selloff is coming to an end.
Further downside is expected.
Risk/Reward would be poor to call a sell from current levels.
A move through 92.50 will confirm the bearish momentum.
The measured move target is 91.75.
We look to Sell at 93.00 (stop at 93.50)
Our profit targets will be 92.00 and 91.75
Resistance: 92.75 / 93.00 / 93.25
Support: 92.25 / 92.00 / 91.75
Risk Disclaimer
The trade ideas beyond this page are for informational purposes only and do not constitute investment advice or a solicitation to trade. This information is provided by Signal Centre, a third-party unaffiliated with OANDA, and is intended for general circulation only. OANDA does not guarantee the accuracy of this information and assumes no responsibilities for the information provided by the third party. The information does not take into account the specific investment objectives, financial situation, or particular needs of any particular person. You should take into account your specific investment objectives, financial situation, and particular needs before making a commitment to trade, including seeking advice from an independent financial adviser regarding the suitability of the investment, under a separate engagement, as you deem fit.
You accept that you assume all risks in independently viewing the contents and selecting a chosen strategy.
Where the research is distributed in Singapore to a person who is not an Accredited Investor, Expert Investor or an Institutional Investor, Oanda Asia Pacific Pte Ltd (“OAP“) accepts legal responsibility for the contents of the report to such persons only to the extent required by law. Singapore customers should contact OAP at 6579 8289 for matters arising from, or in connection with, the information/research distributed.

EURAUD rallies continue to attract sellers.EURAUD - 24h expiry
Trading has been mixed and volatile.
We look for a temporary move higher.
Preferred trade is to sell into rallies.
Risk/Reward would be poor to call a sell from current levels.
Bespoke resistance is located at 1.7265.
We look to Sell at 1.7265 (stop at 1.7325)
Our profit targets will be 1.7025 and 1.7000
Resistance: 1.7250 / 1.7310 / 1.7365
Support: 1.7100 / 1.7050 / 1.6950
Risk Disclaimer
The trade ideas beyond this page are for informational purposes only and do not constitute investment advice or a solicitation to trade. This information is provided by Signal Centre, a third-party unaffiliated with OANDA, and is intended for general circulation only. OANDA does not guarantee the accuracy of this information and assumes no responsibilities for the information provided by the third party. The information does not take into account the specific investment objectives, financial situation, or particular needs of any particular person. You should take into account your specific investment objectives, financial situation, and particular needs before making a commitment to trade, including seeking advice from an independent financial adviser regarding the suitability of the investment, under a separate engagement, as you deem fit.
You accept that you assume all risks in independently viewing the contents and selecting a chosen strategy.
Where the research is distributed in Singapore to a person who is not an Accredited Investor, Expert Investor or an Institutional Investor, Oanda Asia Pacific Pte Ltd (“OAP“) accepts legal responsibility for the contents of the report to such persons only to the extent required by law. Singapore customers should contact OAP at 6579 8289 for matters arising from, or in connection with, the information/research distributed.

SPX to find sellers at previous resistance?SPX500USD - 24h expiry
Daily signals are bearish.
Short term bias has turned negative.
Previous resistance located at 5700.
20 1day EMA is at 5699.8.
5705.4 has been pivotal.
We look to Sell at 5699.5 (stop at 5743.5)
Our profit targets will be 5585.5 and 5565.5
Resistance: 5630.0 / 5658.9 / 5700.0
Support: 5602.4 / 5564.3 / 5495.3
Risk Disclaimer
The trade ideas beyond this page are for informational purposes only and do not constitute investment advice or a solicitation to trade. This information is provided by Signal Centre, a third-party unaffiliated with OANDA, and is intended for general circulation only. OANDA does not guarantee the accuracy of this information and assumes no responsibilities for the information provided by the third party. The information does not take into account the specific investment objectives, financial situation, or particular needs of any particular person. You should take into account your specific investment objectives, financial situation, and particular needs before making a commitment to trade, including seeking advice from an independent financial adviser regarding the suitability of the investment, under a separate engagement, as you deem fit.
You accept that you assume all risks in independently viewing the contents and selecting a chosen strategy.
Where the research is distributed in Singapore to a person who is not an Accredited Investor, Expert Investor or an Institutional Investor, Oanda Asia Pacific Pte Ltd (“OAP“) accepts legal responsibility for the contents of the report to such persons only to the extent required by law. Singapore customers should contact OAP at 6579 8289 for matters arising from, or in connection with, the information/research distributed.

IAG Airlines Group what next? $261 Reached & Breached! $172?🤔 IAG Airlines Group what next?
ℹ️ $261 Reached & Breached!
Will the $261 be regained and start to offer some support or is $172 NEXT?❓️❔️❓️
🌍 To be completely transparent I have no horse in this race at the moment BUT I really would like a serious flush to try and accumulate a long-term POSITION.
🟢SeekingPips🟢 is not interested at current price at all unless we start to see some SERIOUS VOLUME START TO COME IN TO PLAY

ASX200 to find buyers at market price?AU200AUD - 24h expiry
Risk/reward is ample to call a sell trade.
Offers ample risk/reward to sell at the market.
Daily signals are bearish.
We are trading at oversold extremes.
20 1day EMA is at 7976.
We look to Sell at 7975 (stop at 8031)
Our profit targets will be 7815 and 7765
Resistance: 7981 / 8003 / 8028
Support: 7894 / 7860 / 7807
Risk Disclaimer
The trade ideas beyond this page are for informational purposes only and do not constitute investment advice or a solicitation to trade. This information is provided by Signal Centre, a third-party unaffiliated with OANDA, and is intended for general circulation only. OANDA does not guarantee the accuracy of this information and assumes no responsibilities for the information provided by the third party. The information does not take into account the specific investment objectives, financial situation, or particular needs of any particular person. You should take into account your specific investment objectives, financial situation, and particular needs before making a commitment to trade, including seeking advice from an independent financial adviser regarding the suitability of the investment, under a separate engagement, as you deem fit.
You accept that you assume all risks in independently viewing the contents and selecting a chosen strategy.
Where the research is distributed in Singapore to a person who is not an Accredited Investor, Expert Investor or an Institutional Investor, Oanda Asia Pacific Pte Ltd (“OAP“) accepts legal responsibility for the contents of the report to such persons only to the extent required by law. Singapore customers should contact OAP at 6579 8289 for matters arising from, or in connection with, the information/research distributed.

EURAUD forming a top?EURAUD - 24h expiry
Trading has been mixed and volatile.
We look for a temporary move higher.
Preferred trade is to sell into rallies.
Bearish divergence is expected to cap gains.
Bespoke resistance is located at 1.7360.
We look to Sell at 1.7360 (stop at 1.7420)
Our profit targets will be 1.7120 and 1.7080
Resistance: 1.7360 / 1.7420 / 1.7470
Support: 1.7275 / 1.7185 / 1.7090
Risk Disclaimer
The trade ideas beyond this page are for informational purposes only and do not constitute investment advice or a solicitation to trade. This information is provided by Signal Centre, a third-party unaffiliated with OANDA, and is intended for general circulation only. OANDA does not guarantee the accuracy of this information and assumes no responsibilities for the information provided by the third party. The information does not take into account the specific investment objectives, financial situation, or particular needs of any particular person. You should take into account your specific investment objectives, financial situation, and particular needs before making a commitment to trade, including seeking advice from an independent financial adviser regarding the suitability of the investment, under a separate engagement, as you deem fit.
You accept that you assume all risks in independently viewing the contents and selecting a chosen strategy.
Where the research is distributed in Singapore to a person who is not an Accredited Investor, Expert Investor or an Institutional Investor, Oanda Asia Pacific Pte Ltd (“OAP“) accepts legal responsibility for the contents of the report to such persons only to the extent required by law. Singapore customers should contact OAP at 6579 8289 for matters arising from, or in connection with, the information/research distributed.

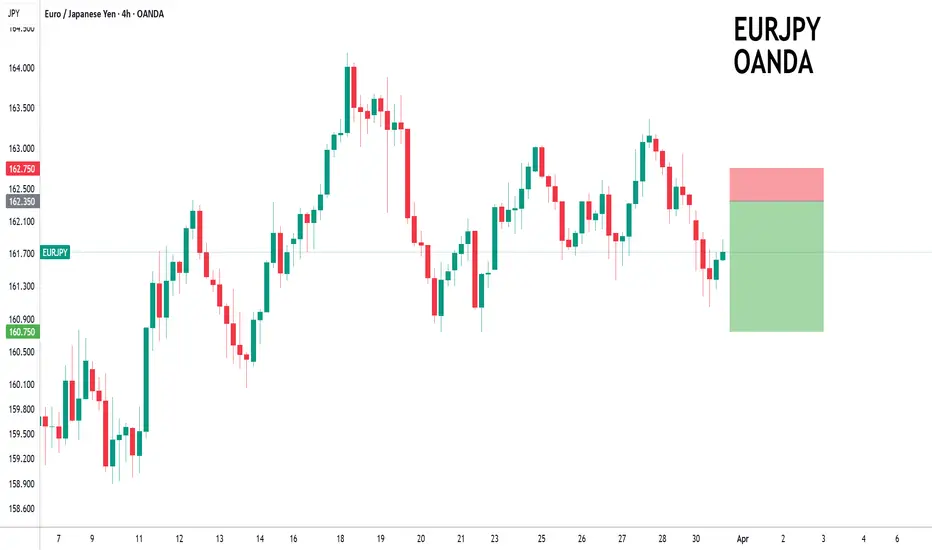
EURJPY remains mixed and volatile.EURJPY - 24h expiry
Although the bulls are in control, the stalling positive momentum indicates a turnaround is possible.
Price action looks to be forming a top.
Preferred trade is to sell into rallies.
A lower correction is expected.
Bespoke resistance is located at 162.35.
We look to Sell at 162.35 (stop at 162.75)
Our profit targets will be 160.75 and 160.50
Resistance: 162.00 / 162.70 / 163.20
Support: 160.75 / 160.20 / 159.00
Risk Disclaimer
The trade ideas beyond this page are for informational purposes only and do not constitute investment advice or a solicitation to trade. This information is provided by Signal Centre, a third-party unaffiliated with OANDA, and is intended for general circulation only. OANDA does not guarantee the accuracy of this information and assumes no responsibilities for the information provided by the third party. The information does not take into account the specific investment objectives, financial situation, or particular needs of any particular person. You should take into account your specific investment objectives, financial situation, and particular needs before making a commitment to trade, including seeking advice from an independent financial adviser regarding the suitability of the investment, under a separate engagement, as you deem fit.
You accept that you assume all risks in independently viewing the contents and selecting a chosen strategy.
Where the research is distributed in Singapore to a person who is not an Accredited Investor, Expert Investor or an Institutional Investor, Oanda Asia Pacific Pte Ltd (“OAP“) accepts legal responsibility for the contents of the report to such persons only to the extent required by law. Singapore customers should contact OAP at 6579 8289 for matters arising from, or in connection with, the information/research distributed.
S&P to find buyers at current market price?US500 - Intraday
Closed the day little net changed.
An overnight negative theme in Equities has led to a lower open this morning.
Immediate signals are hard to interpret.
Bespoke resistance is located at 5853.
Bespoke support is located at 5536.
Dips continue to attract buyers.
We look to Buy at 5609 (stop at 5572)
Our profit targets will be 5719 and 5853
Resistance: 5719 / 5737 / 5853
Support: 5616 / 5607 / 5536
Risk Disclaimer
The trade ideas beyond this page are for informational purposes only and do not constitute investment advice or a solicitation to trade. This information is provided by Signal Centre, a third-party unaffiliated with OANDA, and is intended for general circulation only. OANDA does not guarantee the accuracy of this information and assumes no responsibilities for the information provided by the third party. The information does not take into account the specific investment objectives, financial situation, or particular needs of any particular person. You should take into account your specific investment objectives, financial situation, and particular needs before making a commitment to trade, including seeking advice from an independent financial adviser regarding the suitability of the investment, under a separate engagement, as you deem fit.
You accept that you assume all risks in independently viewing the contents and selecting a chosen strategy.
Where the research is distributed in Singapore to a person who is not an Accredited Investor, Expert Investor or an Institutional Investor, Oanda Asia Pacific Pte Ltd (“OAP“) accepts legal responsibility for the contents of the report to such persons only to the extent required by law. Singapore customers should contact OAP at 6579 8289 for matters arising from, or in connection with, the information/research distributed.

CHILLGUY: The Perfect Range Play Before Lift-Off!CHILLGUY has been in solid sideways accumulation, with a few deviations along the way. Now, it’s sitting near the bottom of the range, setting up for a strong move up. A sharp breakout is on the table, targeting a gap fill.
Entry: Now
TP: 0.03-0.04
SL: 0.022
Stay tuned and follow me so you don’t miss the next big setups! 🚀

NZDUSD to find buyers at market price?NZDUSD - 24h expiry
Price action has stalled at good support levels and currently trades just above here (0.5725).
We expect a reversal in this move.
Risk/Reward would be poor to call a buy from current levels.
A move through 0.5775 will confirm the bullish momentum.
The measured move target is 0.5800.
We look to Buy at 0.5725 (stop at 0.5690)
Our profit targets will be 0.5795 and 0.5800
Resistance: 0.5775 / 0.5795 / 0.5800
Support: 0.5725 / 0.5700 / 0.5690
Risk Disclaimer
The trade ideas beyond this page are for informational purposes only and do not constitute investment advice or a solicitation to trade. This information is provided by Signal Centre, a third-party unaffiliated with OANDA, and is intended for general circulation only. OANDA does not guarantee the accuracy of this information and assumes no responsibilities for the information provided by the third party. The information does not take into account the specific investment objectives, financial situation, or particular needs of any particular person. You should take into account your specific investment objectives, financial situation, and particular needs before making a commitment to trade, including seeking advice from an independent financial adviser regarding the suitability of the investment, under a separate engagement, as you deem fit.
You accept that you assume all risks in independently viewing the contents and selecting a chosen strategy.
Where the research is distributed in Singapore to a person who is not an Accredited Investor, Expert Investor or an Institutional Investor, Oanda Asia Pacific Pte Ltd (“OAP“) accepts legal responsibility for the contents of the report to such persons only to the extent required by law. Singapore customers should contact OAP at 6579 8289 for matters arising from, or in connection with, the information/research distributed.

GOLD to turnaround?XAUUSD - 24h expiry
Previous support at 3030 now becomes resistance.
Although the bulls are in control, the stalling positive momentum indicates a turnaround is possible.
Posted a Bearish Inverted Hammer Bottom on the Daily chart.
A higher correction is expected.
The RSI is trending lower.
We look to Sell at 3029.5 (stop at 3050.2)
Our profit targets will be 2970.2 and 2960.2
Resistance: 3020.8 / 3033.3 / 3047.4
Support: 3014.5 / 2999.3 / 2978.4
Risk Disclaimer
The trade ideas beyond this page are for informational purposes only and do not constitute investment advice or a solicitation to trade. This information is provided by Signal Centre, a third-party unaffiliated with OANDA, and is intended for general circulation only. OANDA does not guarantee the accuracy of this information and assumes no responsibilities for the information provided by the third party. The information does not take into account the specific investment objectives, financial situation, or particular needs of any particular person. You should take into account your specific investment objectives, financial situation, and particular needs before making a commitment to trade, including seeking advice from an independent financial adviser regarding the suitability of the investment, under a separate engagement, as you deem fit.
You accept that you assume all risks in independently viewing the contents and selecting a chosen strategy.
Where the research is distributed in Singapore to a person who is not an Accredited Investor, Expert Investor or an Institutional Investor, Oanda Asia Pacific Pte Ltd (“OAP“) accepts legal responsibility for the contents of the report to such persons only to the extent required by law. Singapore customers should contact OAP at 6579 8289 for matters arising from, or in connection with, the information/research distributed.

ASX to turnaround?AU200AUD - 24H EXPIRY
Price action has continued to trend strongly lower and has stalled at the previous support near 7750.
Price action looks to be forming a bottom.
Further upside is expected.
Risk/Reward would be poor to call a buy from current levels.
A move through 7900 will confirm the bullish momentum.
The measured move target is 8100.
We look to Buy at 7850 (stop at 7750)
Our profit targets will be 8050 and 8100
Resistance: 7900 / 8000 / 8100
Support: 7850 / 7800 / 7750
Risk Disclaimer
The trade ideas beyond this page are for informational purposes only and do not constitute investment advice or a solicitation to trade. This information is provided by Signal Centre, a third-party unaffiliated with OANDA, and is intended for general circulation only. OANDA does not guarantee the accuracy of this information and assumes no responsibilities for the information provided by the third party. The information does not take into account the specific investment objectives, financial situation, or particular needs of any particular person. You should take into account your specific investment objectives, financial situation, and particular needs before making a commitment to trade, including seeking advice from an independent financial adviser regarding the suitability of the investment, under a separate engagement, as you deem fit.
You accept that you assume all risks in independently viewing the contents and selecting a chosen strategy.
Where the research is distributed in Singapore to a person who is not an Accredited Investor, Expert Investor or an Institutional Investor, Oanda Asia Pacific Pte Ltd (“OAP“) accepts legal responsibility for the contents of the report to such persons only to the extent required by law. Singapore customers should contact OAP at 6579 8289 for matters arising from, or in connection with, the information/research distributed.

USDCHF to continue in the downward move?USDCHF - 24h expiry
Broken out of the channel formation to the downside.
Our short term bias remains negative.
Offers ample risk/reward to sell at the market.
The weaker US dollar has boosted performance.
20 4hour EMA is at 0.8801.
We look to Sell at 0.8799 (stop at 0.8839)
Our profit targets will be 0.8701 and 0.8681
Resistance: 0.8777 / 0.8800 / 0.8818
Support: 0.8759 / 0.8740 / 0.8720
Risk Disclaimer
The trade ideas beyond this page are for informational purposes only and do not constitute investment advice or a solicitation to trade. This information is provided by Signal Centre, a third-party unaffiliated with OANDA, and is intended for general circulation only. OANDA does not guarantee the accuracy of this information and assumes no responsibilities for the information provided by the third party. The information does not take into account the specific investment objectives, financial situation, or particular needs of any particular person. You should take into account your specific investment objectives, financial situation, and particular needs before making a commitment to trade, including seeking advice from an independent financial adviser regarding the suitability of the investment, under a separate engagement, as you deem fit.
You accept that you assume all risks in independently viewing the contents and selecting a chosen strategy.
Where the research is distributed in Singapore to a person who is not an Accredited Investor, Expert Investor or an Institutional Investor, Oanda Asia Pacific Pte Ltd (“OAP“) accepts legal responsibility for the contents of the report to such persons only to the extent required by law. Singapore customers should contact OAP at 6579 8289 for matters arising from, or in connection with, the information/research distributed.

FIL: The Life-Changing Setup You Can’t Ignore!FIL has been in a massive 3-year accumulation, just like LINK before its explosive run. The setup is textbook perfect—and the window to get in won’t stay open forever.
Right now, FIL is at historical lows, setting up for a potential 600%+ move. If you're sleeping on this, you might be making a huge mistake. Don’t be that kind of stupid.
Entry: NOW
TP: 19
SL: 1.8

NZDJPY forming a top?NZDJPY - 24h expiry
The primary trend remains bearish.
Bearish divergence is expected to cap gains.
Preferred trade is to sell into rallies.
Rallies should be capped by yesterday's high.
Bespoke resistance is located at 87.00.
We look to Sell at 87.00 (stop at 87.40)
Our profit targets will be 85.40 and 85.10
Resistance: 87.30 / 87.70 / 88.00
Support: 86.30 / 85.50 / 85.00
Risk Disclaimer
The trade ideas beyond this page are for informational purposes only and do not constitute investment advice or a solicitation to trade. This information is provided by Signal Centre, a third-party unaffiliated with OANDA, and is intended for general circulation only. OANDA does not guarantee the accuracy of this information and assumes no responsibilities for the information provided by the third party. The information does not take into account the specific investment objectives, financial situation, or particular needs of any particular person. You should take into account your specific investment objectives, financial situation, and particular needs before making a commitment to trade, including seeking advice from an independent financial adviser regarding the suitability of the investment, under a separate engagement, as you deem fit.
You accept that you assume all risks in independently viewing the contents and selecting a chosen strategy.
Where the research is distributed in Singapore to a person who is not an Accredited Investor, Expert Investor or an Institutional Investor, Oanda Asia Pacific Pte Ltd (“OAP“) accepts legal responsibility for the contents of the report to such persons only to the extent required by law. Singapore customers should contact OAP at 6579 8289 for matters arising from, or in connection with, the information/research distributed.

LTC Long SetupWould like to see a liquidity grab at $89.60 before moving to fill the gap.
Entry: 89.60
TP: 94.31 | 95.34 | 96,49

AUD/USD Forex Analysis – Trading Update for March 2025The AUD/USD pair has been exhibiting interesting price action over the past week. Following a strong bullish movement that took place on March 4th, 2025, the pair has entered a wedge formation. This bullish push was triggered by the announcement of tariffs, effective starting on March 3rd, 2025.
Key Price Action:
The high of the bullish move was marked at 0.63640, after which the price retraced to test a previous key support level at 0.62730. This level proved to be significant, as it was tested five separate times.
During the retest, the market formed lower lows and lower highs, indicating a shift in market structure. To visualize this, a bearish trendline was drawn, capturing the declining momentum.
Break and Retest:
The move we were anticipating was a break of the bearish trendline, followed by a retest of this trendline. This occurred on March 13-14, 2025, confirming the bearish structure.
After this retest, the weekly close showed a bullish push back to the 1-hour previous high at 0.63286, indicating some bullish interest around this price level.
Current Market Structure:
The pair is now trading within a defined range:
Low: 0.62582
High: 0.63288
We are monitoring the 0.63000 level closely, as it is a critical point of interest. A breakout above or below one of the boundaries of this range will provide further confirmation on the pair's next move.
Next Steps:
If the market respects the 0.63000 level and remains within the range, we will continue to observe price action for any further setups. A break above 0.63288 or below 0.62582 will offer more clarity on the pair’s next directional move.
