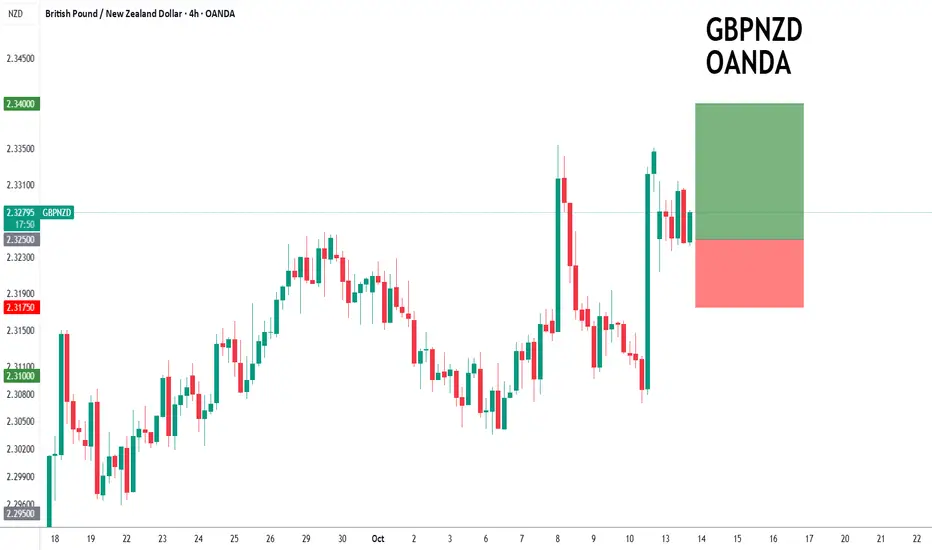
GBPNZD to continue in the upward move?GBPNZD - 24h expiry
There is no clear indication that the upward move is coming to an end.
Although we remain bullish overall, a correction is possible with plenty of room to move lower without impacting the trend higher.
Risk/Reward would be poor to call a buy from current levels.
A move through 2.3350 will confirm the bullish momentum.
The measured move target is 2.3425.
We look to Buy at 2.3250 (stop at 2.3175)
Our profit targets will be 2.3400 and 2.3425
Resistance: 2.3350 / 2.3400 / 2.3425
Support: 2.3250 / 2.3200 / 2.3175
Risk Disclaimer
The trade ideas beyond this page are for informational purposes only and do not constitute investment advice or a solicitation to trade. This information is provided by Signal Centre, a third-party unaffiliated with OANDA, and is intended for general circulation only. OANDA does not guarantee the accuracy of this information and assumes no responsibilities for the information provided by the third party. The information does not take into account the specific investment objectives, financial situation, or particular needs of any particular person. You should take into account your specific investment objectives, financial situation, and particular needs before making a commitment to trade, including seeking, under a separate engagement, as you deem fit.
You accept that you assume all risks in independently viewing the contents and selecting a chosen strategy.
Where the research is distributed in Singapore to a person who is not an Accredited Investor, Expert Investor or an Institutional Investor, Oanda Asia Pacific Pte Ltd (“OAP“) accepts legal responsibility for the contents of the report to such persons only to the extent required by law. Singapore customers should contact OAP at 6579 8289 for matters arising from, or in connection with, the information/research distributed.
Setup
EURAUD to find buyers at previous swing low?EURAUD - 24h expiry
Pivot support is at 1.7600. We expect a reversal in this move.
Risk/Reward would be poor to call a buy from current levels.
A move through 1.7675 will confirm the bullish momentum.
The measured move target is 1.7775.
We look to Buy at 1.7600 (stop at 1.7525)
Our profit targets will be 1.7750 and 1.7775
Resistance: 1.7675 / 1.7700 / 1.7750
Support: 1.7600 / 1.7550 / 1.7525
Risk Disclaimer
The trade ideas beyond this page are for informational purposes only and do not constitute investment advice or a solicitation to trade. This information is provided by Signal Centre, a third-party unaffiliated with OANDA, and is intended for general circulation only. OANDA does not guarantee the accuracy of this information and assumes no responsibilities for the information provided by the third party. The information does not take into account the specific investment objectives, financial situation, or particular needs of any particular person. You should take into account your specific investment objectives, financial situation, and particular needs before making a commitment to trade, including seeking, under a separate engagement, as you deem fit.
You accept that you assume all risks in independently viewing the contents and selecting a chosen strategy.
Where the research is distributed in Singapore to a person who is not an Accredited Investor, Expert Investor or an Institutional Investor, Oanda Asia Pacific Pte Ltd (“OAP“) accepts legal responsibility for the contents of the report to such persons only to the extent required by law. Singapore customers should contact OAP at 6579 8289 for matters arising from, or in connection with, the information/research distributed.

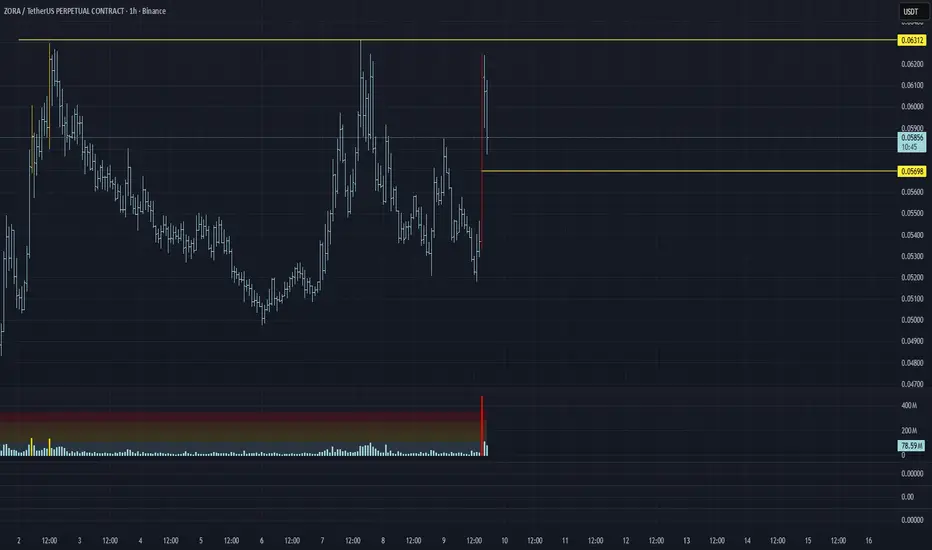
ZORA/USDT Analysis. Long setup
The asset is consolidating near a key level. A strong volume spike and local selling absorption were detected. A breakout is expected, and if the price secures above resistance, the potential target lies near $0.074.
The most conservative entry would be on a retest and reaction from ~$0.057 (bid/ask imbalance).
This publication is not financial advice.
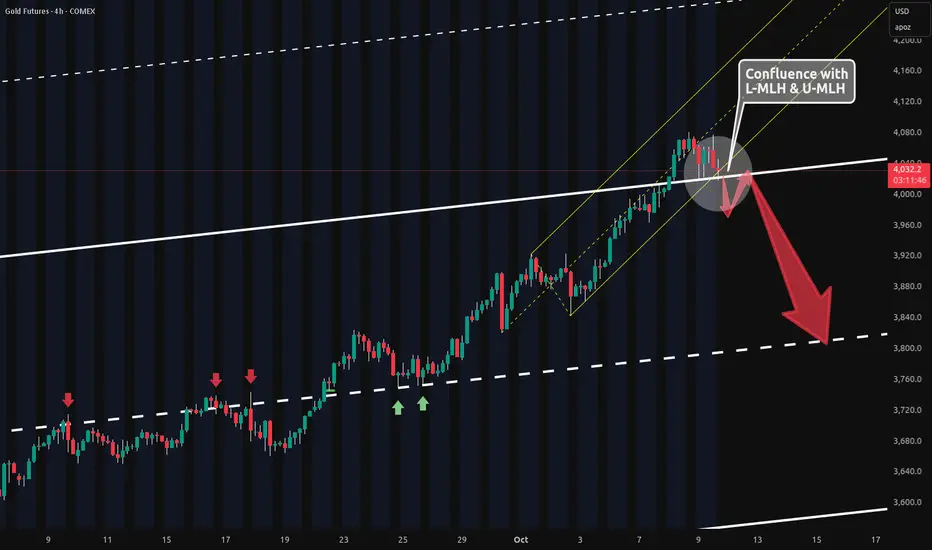
Gold 4h Potential Short Confluence🔱 Just wanted to highlight this confluence 🔱
The yellow L-MLH and white U-MLH are lining up to form a potential short setup.
Today’s selling pressure is also giving an early warning signal.
If we open and close below the white U-MLH, we’ll likely retest it before any major drop.
Shorting this move will require a decent stop, given the inherent volatility. So maybe a play with an Options Strategy would be a more secure way.
Let’s see if the party finally takes a breather.
GBPNZD to find buyers at market price?GBPNZD - 24H expiry
There is no clear indication that the upward move is coming to an end.
Although we remain bullish overall, a correction is possible with plenty of room to move lower without impacting the trend higher.
Risk/Reward would be poor to call a buy from current levels.
A move through 2.3200 will confirm the bullish momentum.
The measured move target is 2.3350.
We look to Buy at 2.3150 (stop at 2.3075)
Our profit targets will be 2.3300 and 2.3350
Resistance: 2.3250 / 2.3300 / 2.3350
Support: 2.3150 / 2.3100 / 2.3075
Risk Disclaimer
The trade ideas beyond this page are for informational purposes only and do not constitute investment advice or a solicitation to trade. This information is provided by Signal Centre, a third-party unaffiliated with OANDA, and is intended for general circulation only. OANDA does not guarantee the accuracy of this information and assumes no responsibilities for the information provided by the third party. The information does not take into account the specific investment objectives, financial situation, or particular needs of any particular person. You should take into account your specific investment objectives, financial situation, and particular needs before making a commitment to trade, including seeking, under a separate engagement, as you deem fit.
You accept that you assume all risks in independently viewing the contents and selecting a chosen strategy.
Where the research is distributed in Singapore to a person who is not an Accredited Investor, Expert Investor or an Institutional Investor, Oanda Asia Pacific Pte Ltd (“OAP“) accepts legal responsibility for the contents of the report to such persons only to the extent required by law. Singapore customers should contact OAP at 6579 8289 for matters arising from, or in connection with, the information/research distributed.

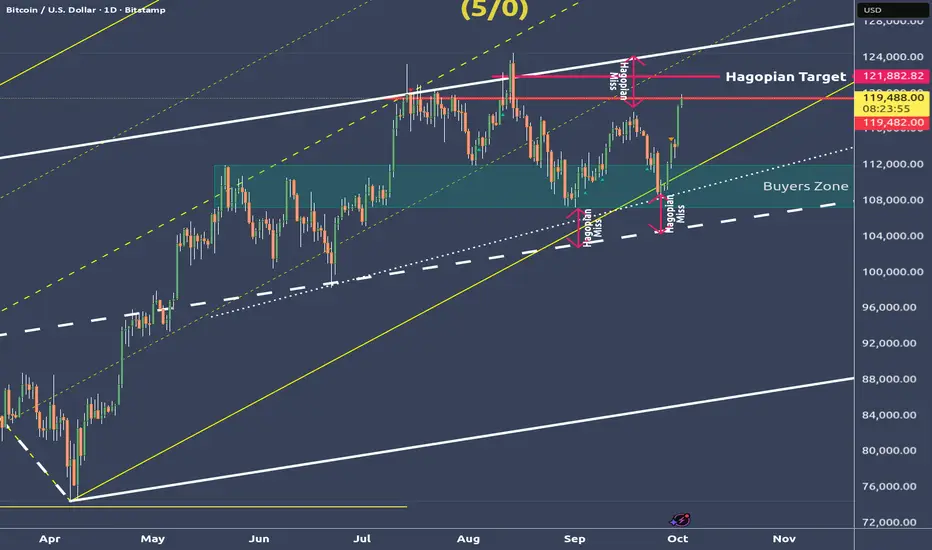
Bitcoin Hodlers are happy campers - BUT🕷️ 🌕 🦇 In Switzerland it’s now 11:50 PM 🕷️ 🌕 🦇
I’m tired from a long day in the markets, but I feel I have to get this one out because it’s important for many of you holding Bitcoin.
In my last post, I said we’d run upward to reach the Hagopian Line, and here we are, even higher.
We’ve just tagged the U-MLH for the third time.
There’s an old pattern from the futures markets that farmers once noticed. It’s called the “Three Drives” pattern.
The old farmers knew that when this pattern appeared, it was time to hedge their crops, or add to their hedge.
When I was a student at MarketGeometry, Tim Morge explained this pattern, and ever since it’s served me well as a signal for a trend reversal.
I don’t know exactly how this will help each of you, but I’m sure it’s worth a heads-up. Whether you decide to hedge, close your positions, or just HODL until the sun burns out, it’s something to keep in mind.
Meanwhile, the Harvest Moon is shining into my office tonight, twinkling with a strange grin... 🌕
Time for me to rest.
Good night, everyone.
🌾 🌾 🌾 🌾 🌾 🌾 🌾

China50 to form a higher low?CHN50 - 24h expiry
Daily signals are bullish.
Intraday dips continue to attract buyers and there is no clear indication that this sequence for trading is coming to an end.
Trading has been mixed and volatile.
Dip buying offers good risk/reward.
Trend line support is located at 15030.
We look to Buy at 15075 (stop at 14945)
Our profit targets will be 15465 and 15525
Resistance: 15339 / 15400 / 15500
Support: 15109 / 14948 / 14855
Risk Disclaimer
The trade ideas beyond this page are for informational purposes only and do not constitute investment advice or a solicitation to trade. This information is provided by Signal Centre, a third-party unaffiliated with OANDA, and is intended for general circulation only. OANDA does not guarantee the accuracy of this information and assumes no responsibilities for the information provided by the third party. The information does not take into account the specific investment objectives, financial situation, or particular needs of any particular person. You should take into account your specific investment objectives, financial situation, and particular needs before making a commitment to trade, including seeking, under a separate engagement, as you deem fit.
You accept that you assume all risks in independently viewing the contents and selecting a chosen strategy.
Where the research is distributed in Singapore to a person who is not an Accredited Investor, Expert Investor or an Institutional Investor, Oanda Asia Pacific Pte Ltd (“OAP“) accepts legal responsibility for the contents of the report to such persons only to the extent required by law. Singapore customers should contact OAP at 6579 8289 for matters arising from, or in connection with, the information/research distributed.

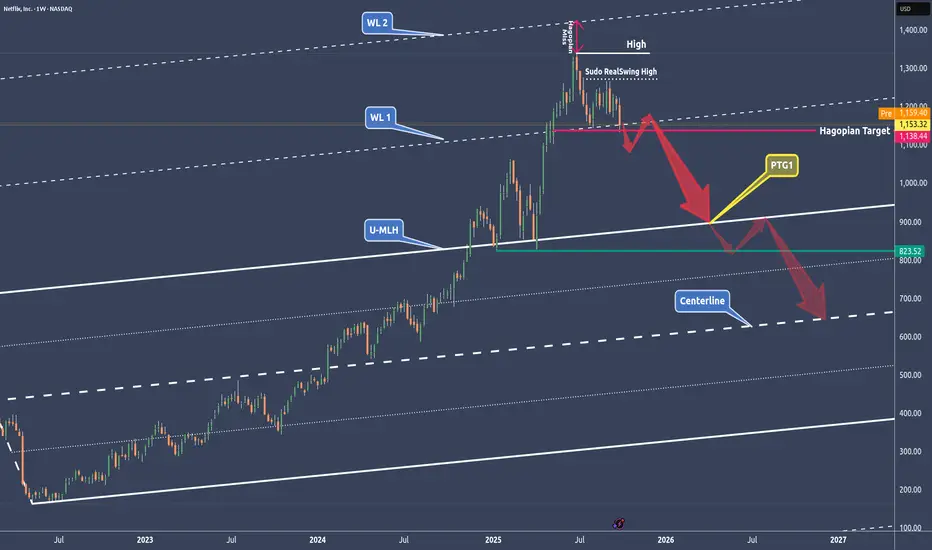
NFLX - NetFlix done after the run?🔱 A break of the WL1 could be the technical short signal 🔱
NetFlix had a monster run.
✅ Here’s a grounded fundamental breakdown of risks that could push Netflix downward. None of these are certainties, instead think of them as warning signs, not predictions.
👉 Slowing subscriber growth – growth in mature markets may plateau, and churn could rise if hit shows underperform.
👉 Rising competition and costs – rivals like Disney+ and Amazon force Netflix to spend more on content, squeezing profit margins.
👉 High valuation risk – expectations are lofty, so even a small earnings miss could trigger a sharp sell-off.
✅ Chart analysis
After missing WL2, we’ve got a Hagopian in play, which I’d say still hasn’t been fulfilled. The line was touched by a few ticks, but usually these lines break more decisively.
🔨 If we open and close below WL1, I’m stalking a pullback to it, just to hit the market on the head. If this break really happens, we’ll also have a clean structure for our stop, placed above the last RealSwing high.
🎯 The target is set in stone for me: It's the U-MLH and beyond, down to the Centerline.
Let’s stay focused and keep our cool.
Happy new week!
EURCHF Bullish Wait for a bullish confirmation around the FVG zone (0.9335–0.9340) or the OB This could include:
A bullish candle formation like a bullish engulfing candle or a pin bar.
A break of structure: Look for a shift from lower lows and lower highs to higher highs and higher lows, which signals the market is starting to form an uptrend.
Order block confirmation: If the price moves into the yellow order block (OB) and reacts with bullish price action, that can be another signal to go long.

GOLD OUTLOOK: POSSIBLE XAUUSD SHORT ON 15MIN TF BUYERS ARE OVERALL STILL IN CONTROL FROM 4HR/1HR TF.
Looking forward to short as soon as buyers spike up once again creating an illusion for buying....Keep watch on the S & R that should resist buyers to continue long. Same area where we would like to see SELLERS stepping in.
Stay tuned for more update

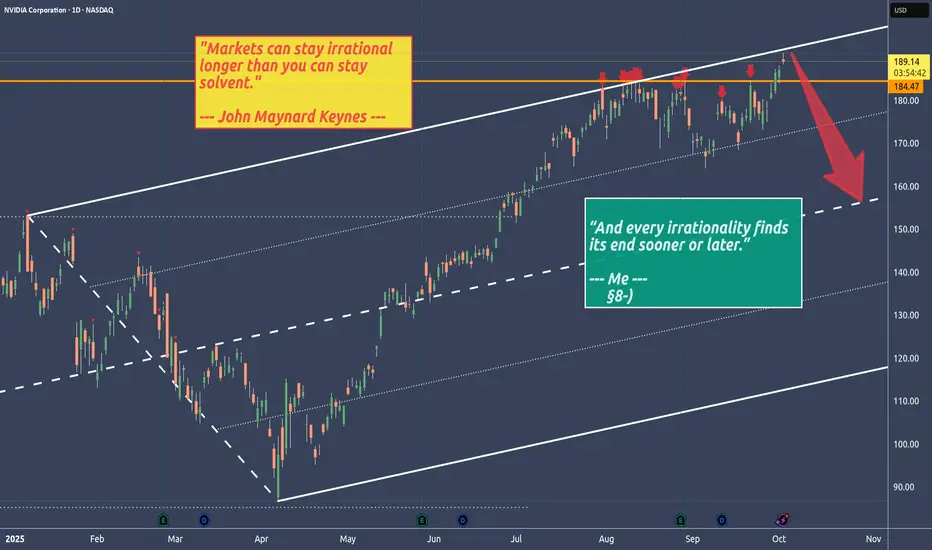
NVIDIA - Stalking NVDA with a short trade in mind🔱 Second approach to crack the U-MLH 🔱
No matter how irrational markets get, sooner or later the Black Bird strikes them down.
We’re back at the U-MLH where price is stretched.
Could it trade through it?
Absolutely.
Even better would be if price trades above the U-MLH and then falls back into the fork — that would be a strong confirming short signal.
But a turn right at the U-MLH would also be a heads-up for me.
👉 Stalking NVDA with a short trade in mind.
Bitcoin deep dive - We go up to the Hagopians line🔱 Up to the HAGOPIAN's line! 🔱
My last post showed what the possible moves are.
Bitcoin blew through both U-MLH's and is now on the way to the HAGOPIAN-Line.
I could imagine that we even tag the white U-MLH again.
That would be about where the confluence with the yellow forks 1/4 line is.
Because there is much more to say about this chart, I thought I'll do a video.
⛏️ I constructed the Chart from the ground up so you can see all the details and thoughts running through my Mycel Network §8-)
👉 Just check my SOM links.
🙏 Thanks you all for the Boosters I got lately. You all are absolutely awesom and I really appreciate it! 🙏
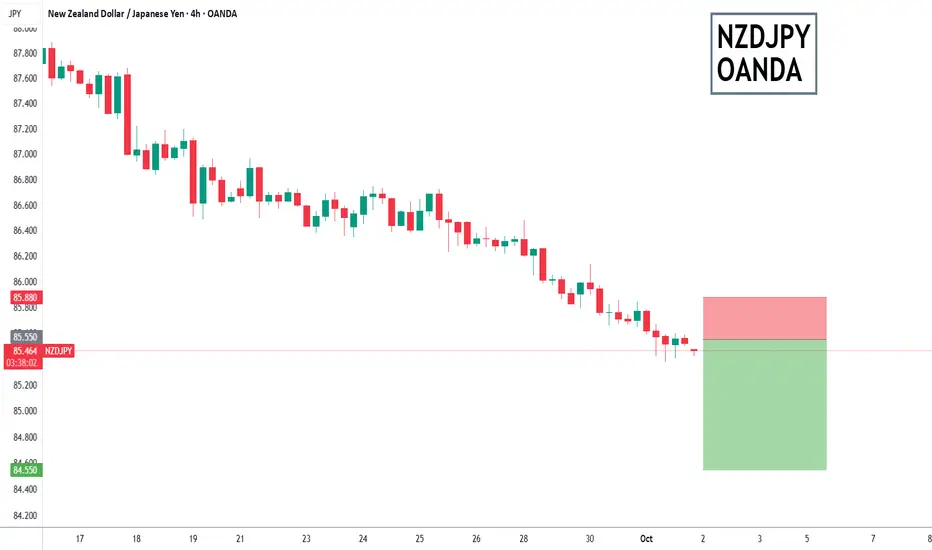
NZDJPY to find sellers at market price?NZDJPY - 24h expiry
Our short term bias remains negative.
The lack of interest is a concern for bulls.
There is no clear indication that the downward move is coming to an end.
Offers ample risk/reward to sell at the market.
20 1hour EMA is at 85.57.
We look to Sell at 85.55 (stop at 85.88)
Our profit targets will be 84.55 and 84.35
Resistance: 85.85 / 86.13 / 86.48
Support: 85.38 / 85.00 / 84.50
Risk Disclaimer
The trade ideas beyond this page are for informational purposes only and do not constitute investment advice or a solicitation to trade. This information is provided by Signal Centre, a third-party unaffiliated with OANDA, and is intended for general circulation only. OANDA does not guarantee the accuracy of this information and assumes no responsibilities for the information provided by the third party. The information does not take into account the specific investment objectives, financial situation, or particular needs of any particular person. You should take into account your specific investment objectives, financial situation, and particular needs before making a commitment to trade, including seeking, under a separate engagement, as you deem fit.
You accept that you assume all risks in independently viewing the contents and selecting a chosen strategy.
Where the research is distributed in Singapore to a person who is not an Accredited Investor, Expert Investor or an Institutional Investor, Oanda Asia Pacific Pte Ltd (“OAP“) accepts legal responsibility for the contents of the report to such persons only to the extent required by law. Singapore customers should contact OAP at 6579 8289 for matters arising from, or in connection with, the information/research distributed.
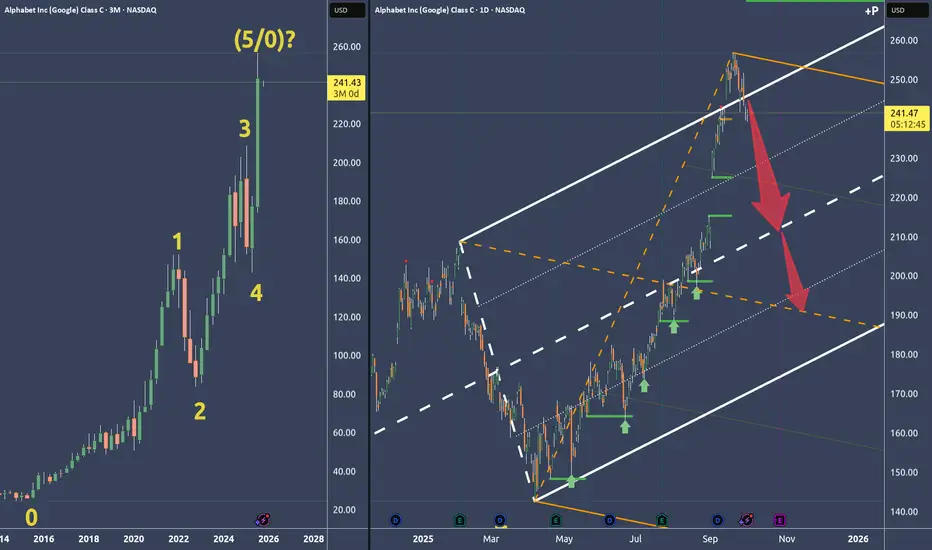
Google Alphabet: Why I think it's time to short🔱 Simple decision because of the Fork framework 🔱
Left Chart:
Zero-to-five count with a potential P5 and a turn.
Why P5?...
Right Chart:
...because price broke out of the U-MLH, then fell back into the fork. As a filter I like it when price is opening and closing inside the fork again. All in all it's a new and weak behaviour.
Or in short: That’s a pretty darn strong short signal to me.
Following the rules, taking acceptable risks, and hunting a fat profit.
👉 PTG1: The white centerline
👉 PTG2: The orange centerline
🛷 Happy Sleigh Ride 🎄
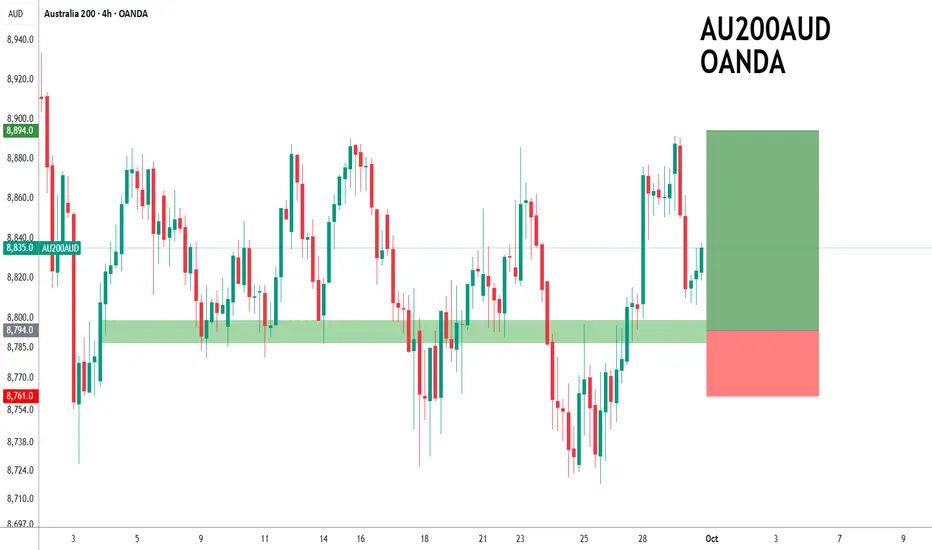
ASX200 to find buyers at previous support?ASX200 - 24h expiry
Daily signals are mildly bullish.
50 1day EMA is at 8792.
Short term bias has turned positive.
Support is located at 8780 and should stem dips to this area.
Risk/Reward would be poor to call a buy from current levels.
We look to Buy at 8794 (stop at 8761)
Our profit targets will be 8894 and 8914
Resistance: 8835 / 8850 / 8890
Support: 8806 / 8780 / 8717
Risk Disclaimer
The trade ideas beyond this page are for informational purposes only and do not constitute investment advice or a solicitation to trade. This information is provided by Signal Centre, a third-party unaffiliated with OANDA, and is intended for general circulation only. OANDA does not guarantee the accuracy of this information and assumes no responsibilities for the information provided by the third party. The information does not take into account the specific investment objectives, financial situation, or particular needs of any particular person. You should take into account your specific investment objectives, financial situation, and particular needs before making a commitment to trade, including seeking, under a separate engagement, as you deem fit.
You accept that you assume all risks in independently viewing the contents and selecting a chosen strategy.
Where the research is distributed in Singapore to a person who is not an Accredited Investor, Expert Investor or an Institutional Investor, Oanda Asia Pacific Pte Ltd (“OAP“) accepts legal responsibility for the contents of the report to such persons only to the extent required by law. Singapore customers should contact OAP at 6579 8289 for matters arising from, or in connection with, the information/research distributed.
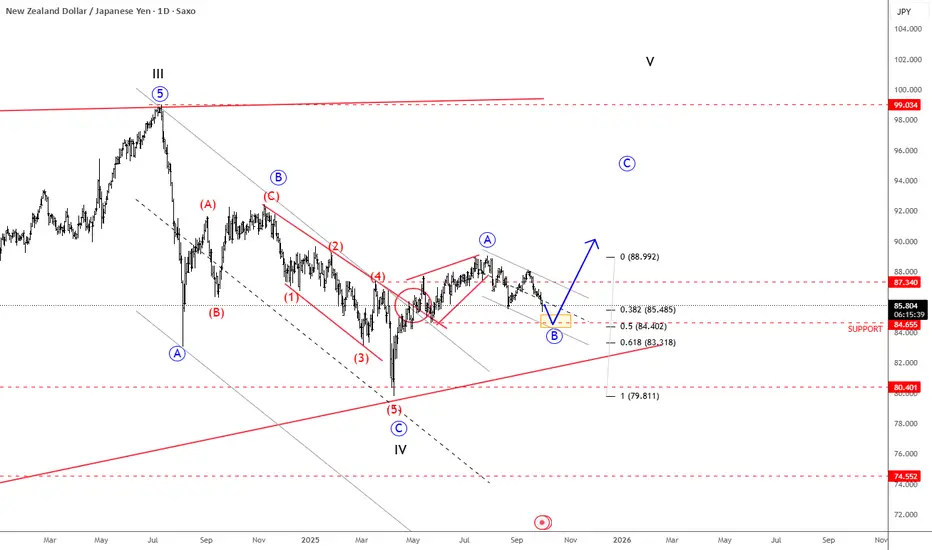
NZDJPY Is Forming A Bullish SetupNew Zealand dollar turned up against the Japanese Yen since April, when we saw a strong rebound from 80.40 support, a key level going back to March 2023. The recovery is quite strong, and it looks like a leading diagonal pattern into wave A; so it's a motive wave structure that already pushed above the 87.34 resistance, which is a strong bullish signal, suggesting more upside ahead. So if we are correct, then current retracement is a contra-trend move; possibly wave B that has a nice support at 85-84 area, which is not that far away, so we may get a new bounce in a few weeks; ideally an impulse, out of a current downward channel.
NZDUSD to continue in the downward move?NZDUSD - 24h expiry
There is no clear indication that the downward move is coming to an end.
Although we remain bearish overall, a correction is possible without impacting the trend lower.
Risk/Reward would be poor to call a sell from current levels.
A move through 0.5770 will confirm the bearish momentum.
The measured move target is 0.5725.
We look to Sell at 0.5800 (stop at 0.5825)
Our profit targets will be 0.5750 and 0.5725
Resistance: 0.5800 / 0.5825 / 0.5850
Support: 0.5760 / 0.5750 / 0.5725
Risk Disclaimer
The trade ideas beyond this page are for informational purposes only and do not constitute investment advice or a solicitation to trade. This information is provided by Signal Centre, a third-party unaffiliated with OANDA, and is intended for general circulation only. OANDA does not guarantee the accuracy of this information and assumes no responsibilities for the information provided by the third party. The information does not take into account the specific investment objectives, financial situation, or particular needs of any particular person. You should take into account your specific investment objectives, financial situation, and particular needs before making a commitment to trade, including seeking, under a separate engagement, as you deem fit.
You accept that you assume all risks in independently viewing the contents and selecting a chosen strategy.
Where the research is distributed in Singapore to a person who is not an Accredited Investor, Expert Investor or an Institutional Investor, Oanda Asia Pacific Pte Ltd (“OAP“) accepts legal responsibility for the contents of the report to such persons only to the extent required by law. Singapore customers should contact OAP at 6579 8289 for matters arising from, or in connection with, the information/research distributed.

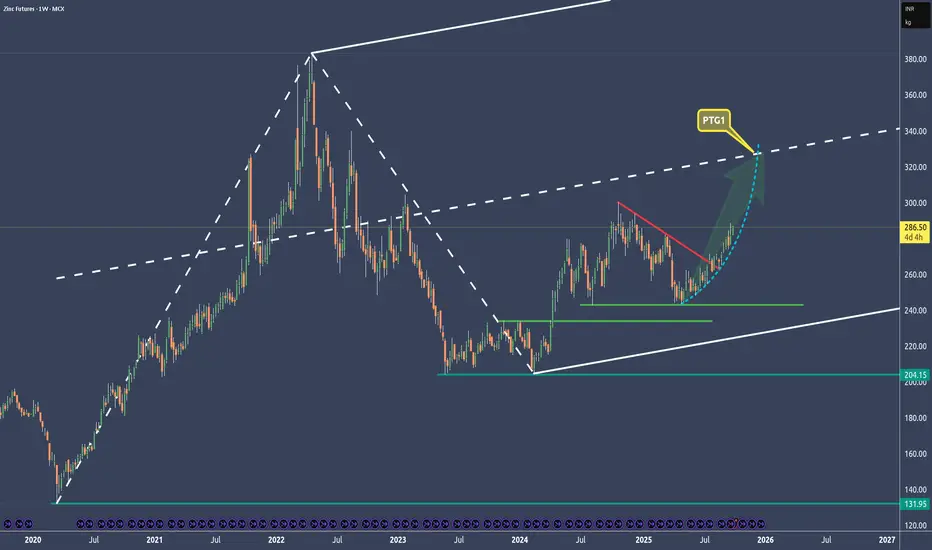
Zinc - Exponential Move To Profit Along With Copper🔱 I posted about copper and zinc on Sep 17. 🔱
Both are closely correlated, and now zinc is moving exponentially.
The target is at the centerline of course with around an 80% probability.
👉 If you think that these forks are doing a good job, then throw me booster please and check out my links. §8-)
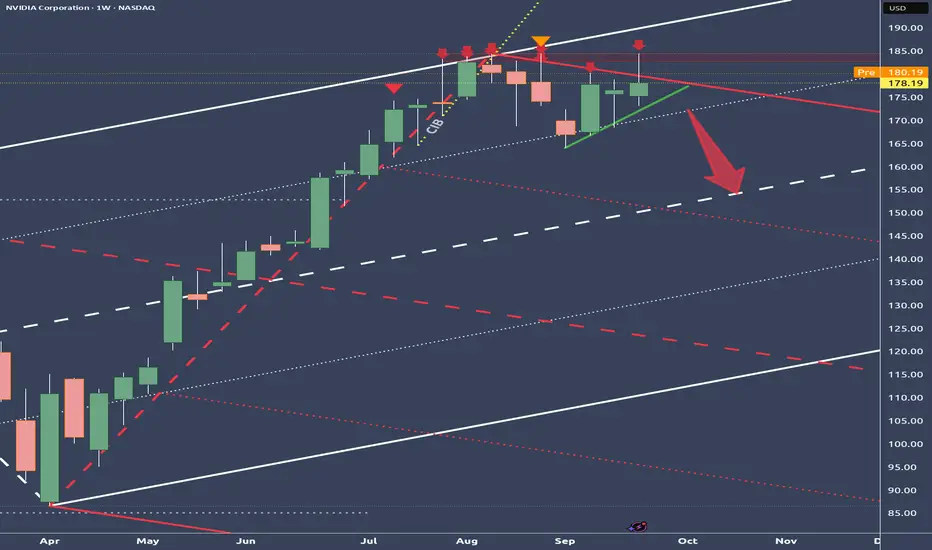
NVIDIA – Enormous Pressure After Reaching the Stretch LevelBetween July 31 and August 13, price kept nagging at the white U-MLH,
but there wasn’t enough strength to break through.
From there, price began to drift lower, pressing against the red U-MLH.
The close last Friday failed to break below the red U-MLH –
a clear sign of weakness!
If the green mini-trendline gives way and the white ¼-Line moves above price as well,
NVDA could be ripe for a short setup.
Let’s stalk the trade.
EUR/USD: A Decision Level for SurePrice managed to reach the white centerline again (80% rule!) after forming a Hagopian in early 2025.
Now it’s sandwiched between the orange U-MLH and the white centerline.
Wherever it breaks out will determine the direction we should trade.
If it breaks upwards, the next targets are the ¼-line and then the U-MLH.
If it breaks below the white centerline, I’ll wait for a test/retest and then jump on the train south toward the white L-MLH.
Patience is key!

SPX - That's all folks?The world has gone nuts, but markets didn't even blink.
Now the SPX has reached it's U-MLH, which means, it's at a real extreme.
This is a level where price starts to stall, then turn.
Often we see "a last attempt" to break through, and it really could happen. But then, gravity again takes it's toll and the rocket starts to turn south.
Here are the scenarios I see:
1. Immediate turn at the U-MLH. Target is the Centerline.
2. A break of the U-MLH, then back into the fork and a fall down to the Centerline.
3. Break the U-MLH, continuation to the WL1.
The most unlikely would be 3.
In my view, Party People should have left allready, but they refused to.
And that's why this time headaches will be the least problem they face.
Wating for a short signal, to load up heavy.

XAUUSD Has Left the buildingOn the way up, we first found support at the L-MLH (1).
Then the Centerline stepped in as resistance (2), but it eventually couldn’t hold price down.
Eating through the Centerline like a mouse through cheese, price found support again at (2) before blasting upward to the U-MLH — and quickly through it.
Once again, the U-MLH turned from prior resistance into fresh support.
From there, price mirrored (2), moving sideways before blasting off to the moon! 🚀
I’m surprised that WL1 offered no resistance at all.
Now that we’ve left WL1 behind, WL2 is the next target.
Watching the show patiently.

BTCUSD – Last Chance to Go HigherOver the weekend, price found support just outside the white L-MLH. That’s where I previously mentioned the red Centerline — the target for the earlier short trade.
Now, however, price has jumped back into the fork. Tthis could be the last chance to break out of the down-sloping yellow fork to the upside.
P3 would be my next level to watch for support after the break of the red Centerline.
