ES (SPX, SPY) Analysis, Key Levels, Setup for Fri (Jan 16)
The S&P 500 futures market is signaling renewed optimism heading into Friday's session, buoyed by a powerful earnings report from Taiwan Semiconductor Manufacturing Co. and resilient labor market data that together have eased concerns about the durability of the artificial intelligence trade.
E-mini S&P 500 futures extended gains for a second consecutive session, settling Thursday near 6994, advancing 12.25 points, or 0.18%, from the prior close of 6981.75.
The catalyst proved to be TSMC's fourth-quarter results, which showed profit growth of 35% and a commitment to capital expenditures of $52 billion to $56 billion in 2026. The guidance dispelled fears that hyperscaler spending on AI infrastructure might be cooling, sending Nvidia Corp. shares up more than 2% and lifting the broader semiconductor complex.
"Taiwan Semi's results today, and more importantly, their capex spending plans, point to reassuring investors that the AI trade is not necessarily a bubble at this point," said Kim Forrest, chief investment officer at Bokeh Capital Partners.
The CBOE Volatility Index fell 5.43% to 15.84, its lowest level in weeks, suggesting options traders see diminished risk of near-term turbulence.
Trade Developments Add Tailwind
Taiwan's Vice Premier confirmed that a bilateral tariff agreement with the United States would be signed within several weeks. The arrangement includes $250 billion in company-led investment alongside $250 billion in credit guarantees a framework the official described as distinct from recent deals struck with Japan and South Korea.
The development carries implications for semiconductor supply chains that remain central to U.S. economic competitiveness. Taiwan emphasized that domestic investment would continue even as companies expand their American footprint, a signal that TSMC's Arizona operations will complement rather than replace its home-island capacity.
Bank earnings provided additional support. Goldman Sachs Group Inc. and Morgan Stanley both exceeded analyst expectations, capitalizing on a resurgence in dealmaking activity. BlackRock Inc. reported record assets under management of $14 trillion.
Labor market data reinforced the constructive tone. Initial jobless claims for the week ending January 10 totaled 198,000, well below the 215,000 economists had forecast—evidence that employment conditions remain firm despite elevated interest rates.
Technical Picture Favors Continuation
From a structural perspective, the daily chart maintains a pattern of higher highs and higher lows, with price holding above a significant volume concentration between 6880 and 6900. Fibonacci extensions derived from the recent swing project potential upside targets at 7149.75, 7226.75, and 7311.75.
The four-hour timeframe shows consolidation between a premium zone near 7025-7050 and equilibrium around 6900. A higher low established at 6923 earlier this week suggests buyers remain willing to defend pullbacks.
On the one-hour chart, a series of bullish momentum signals have confirmed the near-term uptrend. The 6900-6910 zone, representing the prior week's low, now serves as structural support. Overhead, resistance near 7050, where distribution activity would be expected.
Treasury yields present a modest headwind, with the 10-year note at 4.17% as of Thursday's close.
Key Levels
Resistance
7050 → Premium zone, Weak High 39%
7017.25 → PDH (primary target)
7000 → Psychological, PWH area
Pivot
6992.25 → VWAP
6981.75 → Prior Close
Support
6974.75 → PDL (range edge)
6949.50 → ONL
6920-6925 → 1H HL structure
6900-6910 → PWL, critical support
6860 → Strong Low 61%, 1.272 Fib extension
Primary Setup: Long ES at PDL Support
Bias: Bullish above 6992.25 VWAP
Entry Zone: 6974 - 6978 (PDL range edge)
Stop Loss: 6964 (below PDL structure)
Target 1: 6992.25 (VWAP) → Scale 50%
Target 2: 7017.25 (PDH) → Runner at breakeven
Risk: 10-14 points
Confirmation Checklist
- CVD divergence at 6974-6978 (selling exhaustion)
- Bid wall formation / absorption
- Hold above 6970 on retest
- Volume decline into the pullback
Alternative Setups
Long Breakout
Entry: Above 7020 (with retest)
Target: 7040-7050
Stop: Below 7010
Short at Premium
Entry: 7040-7050 (rejection only)
Target: 7020 / 7000
Stop: Above 7060
Long Deep Pullback
Entry: 6920-6925 (1H HL)
Target: 6975 / 7000
Stop: Below 6910
Economic Calendar - Friday Jan 16
8:30 AM ET → Business Leaders Survey (Low)
9:15 AM ET → Industrial Production & Capacity Utilization ⚠️ (High)
11:45 AM ET → NY Fed Staff Nowcast (Low)
Industrial Production is the main event. A beat confirms manufacturing strength and supports continuation toward 7017.25+. A miss could offer pullback opportunity toward structural support.
Setups

ES (SPX, SPY) Analysis, CPI, Levels for Tue (Jan 13)
CPI Day Setup: Key Levels, Scenarios & Trade Ideas
FUNDAMENTAL BACKDROP
Increasing Pressure on Federal Reserve Independence
The political landscape surrounding the Federal Reserve is growing increasingly turbulent, as recent developments have raised concerns about potential interference in monetary policy. The Department of Justice served Fed Chair Jerome Powell with grand jury subpoenas on Friday, prompting Powell to defend the integrity of the Fed in a video statement, labeling the subpoenas as a "pretext" for a concerted effort to pressure the central bank into lowering interest rates. Senator John Thune has commented on the challenges this investigation poses for any future confirmation of Powell.
In a recent address, Fed President John Williams emphasized a cautious outlook, projecting U.S. economic growth to land between 2.5% and 2.75% for 2026. He noted that inflation is anticipated to peak in the first half of the year at rates between 2.75% and 3.0%, with a return to the 2% target expected by 2027. Williams reassured markets, stating that the Fed is “not under strong pressure to change rates,” and he acknowledged that the current market calm reflects an underlying uncertainty regarding these developments.
Geopolitical Tensions Rising
President Donald Trump has initiated a significant trade move, imposing 25% tariffs on nations conducting business with Iran, effective immediately. In a swift response, Iran’s foreign minister stated that Tehran is prepared for either “war or dialogue,” adding a layer of geopolitical risk that could influence market volatility in overnight trading sessions.
Foreign Exchange and Global Market Insights
In the global currency markets, the Dollar/Yen pair has reached a one-year high, trading at 158.25. Meanwhile, the Chinese Yuan continues to weaken, with the People’s Bank of China’s mid-point rate floating around 6.9734. Additionally, gold prices remain buoyed near record highs, driven by persistent demand for safe-haven assets amidst ongoing political and economic uncertainties.
TUESDAY'S KEY EVENT: CPI REPORT SET FOR 8:30 AM ET
Consensus Expectations:
- Headline CPI MoM is expected at 0.3%, up from the previous 0.2%.
- Headline CPI YoY is anticipated to remain steady at 2.7%.
- Core CPI MoM is projected at 0.3%, an increase from last month’s reading of 0.2%.
- Core CPI YoY is forecasted at 2.7%, slightly up from 2.6% previously reported.
Important Context:
Recent data collection for October and November has been impacted by the government shutdown, leading to some analysts warning of potential upside risks due to a "payback" effect from previous artificially low readings. Shelter inflation continues to be stable at around 3.0% year-over-year. The Core CPI month-over-month figure is expected to be the most immediate market mover, making it a critical focus for investors.
CPI Scenario Matrix:
- Much Lower (<0.2% Core MoM): Potential market rally of 30-50 points.
- Lower (0.2%): Anticipated rally of 15-25 points.
- In-Line (0.3%): Expected to result in market fluctuations of ±10-15 points.
- Higher (0.4-0.5%): Predicted market sell-off of 25-40 points.
- Much Higher (>0.5%): Market "flush" could lead to a drop of 40-60 points.
Technical Structure:
- Daily: Current prices are at a "Strong High 90%," indicating an extended phase while still maintaining trend integrity. Multiple higher high structures are currently showing signs of exhaustion, with a key support level at 6,900.
- 4-Hour: A change in character has been confirmed from the lows of 6,968, resulting in a sequence of higher lows at 6,950, 6,968, and 6,998. A higher low at 6,988 must hold for bullish continuation.
- 1-Hour: Prices are currently in a premium zone above 7,009, with a break of structure confirmed following recovery from the morning lows. Consolidation is forming ahead of the CPI catalyst.
Overnight Market Forecast
In the Base Case scenario, traders are positioned for a consolidation phase within the range of 7,004 to 7,013, driven by thin liquidity and pre-CPI positioning. As market participants reduce risk ahead of key data releases, expect choppy price action.
On the Bullish Case front, there’s a 25% likelihood of probing levels between 7,017 and 7,021, fueled by short covering prior to the CPI announcement. The calming tone from Fed's Williams is supporting risk appetite, but a stall is expected below the 7,025 mark.
Conversely, the Bearish Case carries a 20% probability of a dip to the 6,996 to 6,998 range, influenced by headline risks related to the Fed and tensions in Iran. There is pre-CPI hedging pressure that could lead to a bounce at the Y-VAL.
Post-CPI Scenarios
Scenario A Bullish Acceptance (35% Probability)
- Trigger: A 15-minute close above 7,025.25.
- Targets: 7,040 and then 7,058-7,065.
- Invalidation: Falling back below 7,021.
Scenario B Rejection/Fade (40% Probability)
- Trigger: A sweep above 7,021-7,025 followed by a failure to hold above 7,021.
- Targets: 6,996.50, moving down to 6,968.75.
- Invalidation: Acceptance above 7,025.
Scenario C - Breakdown (25% Probability)
- Trigger: A 15-minute close below 6,996.50.
- Targets: 6,968.75 and then 6,950.00.
- Invalidation: A reclaim and hold above 6,996.50.
BIAS & SUMMARY
Overall Lean: Slight bearish into CPI, but data-dependent
Bull Case: Cool CPI + Williams' calm tone = squeeze to 7,040+
Bear Case: Hot CPI + Fed/Iran headlines = flush to 6,968 or lower
Key Zones to Watch:
7,025 cap - break = bullish continuation
7,005 VWAP - pivot zone
6,996 Y-VAL - break = bearish acceptance
6,968 PDL - critical support
Risk Management Note: CPI releases create significant volatility. IV crush post-print is real if trading options, take profits quickly on directional moves rather than holding for extended targets.

ES (SPX, SPY) Fundamental Analysis for Wed Jan 7As we head into Wednesday's session, the S&P 500 E-mini futures are testing significant resistance at the prior day's highs, reflecting a strong rebound from the lows observed last week. The current market landscape is marked by various challenges, including a divided Federal Reserve, softening labor data, and emerging geopolitical tensions, particularly related to U.S. military actions in Venezuela.
The Federal Reserve is maintaining its interest rates at the 3.50%-3.75% range after a 25 basis point cut in December. Internal divisions within the Fed have become increasingly apparent, with some members advocating for more substantial cuts while others are in favor of holding rates steady. Currently, the market assigns roughly a 15% chance of a rate cut in January, with the next Federal Open Market Committee (FOMC) meeting scheduled for January 27-28.
The minutes from December's meeting revealed growing concerns over short-term funding stress and the potential for abrupt market volatility, spurring discussions regarding the possibility of Treasury purchases to enhance liquidity in the financial system.
Data Catalyst Update
ADP Employment Change (Released at 8:15 AM ET)
- Actual: +41K
- Forecast: +50K
- Previous: -32K
Today's ADP Employment change shows a modest miss, reflecting a labor market that is recovering yet remains soft. While this figure is an improvement from November's contraction, it falls short of expectations. This outcome supports the view of a gradual cooling in the labor market without signaling an imminent recession. The reading is mildly dovish for the Federal Reserve's policy stance and offers limited directional clarity ahead of Friday's Non-Farm Payrolls report.
ISM Services PMI (Scheduled for 10:00 AM ET)
- Forecast: ~53.0
- Previous: 52.6
The ISM Services PMI is the key market-moving release of the day. Given that the services sector accounts for approximately 70% of U.S. economic activity, the implications of this report are significant. A reading below 50 would indicate contraction and likely trigger risk-off sentiment in the markets. Conversely, a robust reading above 54 could reignite concerns about hawkish Fed policies, putting pressure on equities. The ideal scenario for market bulls would be a print that comes in line with expectations or slightly soft, thereby sustaining the narrative of a "soft landing."
Additional Releases of Note:
- Factory Orders (10:00 AM): Expected -1.2%
- JOLTS Job Openings (10:00 AM): Expected 7.64M, down from prior 7.67M
- Fed Vice Chair Bowman to speak at 4:10 PM
LABOR MARKET CONTEXT
In the last week of 2025, initial jobless claims fell to 199,000, marking the lowest level since early last year. This decline indicates a resilient labor market, even as the unemployment rate has risen to 4.6% in November—the highest rate since September 2021. This uptick can be attributed primarily to federal workforce reductions linked to ongoing government restructuring efforts.
Overall, the labor market appears stable, characterized by low hiring and equally low firing rates. Continuing claims have increased to 1.92 million, underscoring the reality that although layoffs have remained subdued, job seekers are facing extended search periods. The upcoming Non-Farm Payroll (NFP) report, with a forecast of approximately 55,000 new jobs, will offer crucial insights into the employment landscape for December.
GEOPOLITICAL RISK
The recent U.S. capture of Venezuelan President Nicolás Maduro has injected a new layer of uncertainty into the geopolitical landscape. In the wake of this development, Washington has announced plans to take temporary control of Venezuela while facilitating the involvement of U.S. energy firms in the exploration and development of the country’s vast oil reserves—the largest in the world. This situation has led to a modest uptick in demand for the dollar as a safe haven, while simultaneously increasing volatility within energy markets.
From an equities perspective, this scenario presents a short-term challenge as investors grapple with the implications of U.S. access to Venezuelan oil. However, should this development result in a significant increase in oil supply, it could ultimately have disinflationary effects.
CURRENCY & RATES
The EUR/USD exchange rate has retraced to the 1.1685-1.1700 range after failing to maintain momentum above the 1.1800 threshold. While the dollar is finding some support driven by geopolitical flows, it remains fundamentally weak in light of expectations for Federal Reserve easing. The DXY index is currently hovering around 98.25, notably below the recent high of 100.40.
On the European front, German inflation has come in at 1.8%, marking the first dip below the European Central Bank’s 2% target since September 2024. This development effectively reduces the likelihood of any near-term ECB interest rate hikes, maintaining the narrative of policy divergence between the ECB and other central banks.
In the bond markets, a rally occurred overnight as yields fell, reflecting a shift in investor risk positioning as they look ahead to 2026.
Market Structure Analysis
ES futures closed Tuesday at 6,988.25, marking a notable rebound from Monday's low of 6,931. This upward movement has brought prices near key resistance levels established in the prior week and quarter, specifically between 6,991 and 6,995. This zone represents a significant confluence of resistance.
While daily oscillators indicate elevated levels, they do not yet reach extremes, allowing for the possibility of continued upward momentum should this resistance be surpassed. The overarching trend remains bullish, underscored by a series of higher highs since the lows observed in October. However, an analysis of the 4-hour and 1-hour timeframes reveals overbought conditions, which typically signal a need for consolidation or a potential pullback.
Market Outlook: Neutral-to-Bullish with Anticipated Pullback
The current macroeconomic landscape favors equities, as the Federal Reserve adopts a more accommodative stance, inflationary pressures appear to be easing, and while the labor market remains stable, signs of cooling are evident. However, market positioning has grown extended near resistance levels, and the upcoming ISM report introduces potential volatility.
From a bullish perspective, an ideal scenario would see a quick dip in response to the ISM data, targeting the 6,960-6,970 support zone. Such a pullback could facilitate institutional buying before the market resumes its upward trajectory. A sustained move above 6,995 would pave the way toward the psychologically significant 7,000 mark and possibly higher.
Key Risk Factors to Watch:
- A surprisingly strong ISM reading (greater than 55) could reignite hawkish concerns from the Fed.
- Ongoing tensions in Venezuela could introduce additional market uncertainties.
- Pre-NFP positioning may lead to increased market volatility and choppy trading conditions.
Bottom Line
Today's market outlook is largely shaped by the upcoming 10:00 AM release of the ISM Services index, which is expected to bring significant volatility. The recent ADP employment report, which fell short of expectations, did not stir up much reaction, leading to a market that remains in a cautionary holding pattern around key resistance levels.
Traders should be watchful for potential trading opportunities, particularly during any pullbacks to the value-area support. Current higher-timeframe trends suggest a preference for buying on dips rather than pursuing breakouts at these elevated levels.
Key Levels to Monitor:
- Support: 6,959 - 6,972
- Resistance: 6,991 - 7,000

ES (SPX, SPY) Analysis Week-ahead from Jan 5 to Jan 9, 2026Multi-Timeframe Market Analysis
Weekly Overview: The Big Picture
The E-mini S&P 500 (ES) continues to demonstrate an uptrend on a macro scale, characterized by a series of higher highs and higher lows. However, the recent market activity has resembled a gradual grind near the upper boundaries of a multi-month trading range—a behavior often referred to as “premium.” This indicates a slowdown in upward momentum, with pullbacks becoming increasingly pronounced. While the market does not exhibit extreme overbought conditions, the acceleration seen in prior weeks has noticeably diminished.
Daily Trend and Range Dynamics
On a daily basis, the market is operating within an upward trend that is currently exhibiting range-bound characteristics. We are witnessing repeated attempts to test the upper supply zone around the 6980-7000 level, followed by mean reversion toward the mid-to-lower 6900s. The latest daily swing reflects a pullback from this upper band, positioning prices now towards the center of this range, where liquidity zones take precedence over simply chasing trends.
4-Hour Perspective: Impulse vs. Correction
Analyzing the 4-hour chart reveals a distinct corrective move followed by a rebound that has yet to solidify a sequence of higher highs. While the overarching weekly trend remains bullish, the current 4-hour action feels more like a rebound effort, with the market in a phase of "repair" after experiencing a sharp decline.
1-Hour Intraday Context
At the intraday level, the latest 1-hour movement reflects a rebound from the lower 6800s towards the resistance zone in the low-to-mid 6900s. This places traders in a critical “decision zone” as we enter Monday's session, where the market faces a pivotal moment: it must either reclaim and sustain levels above these key resistance shelves (indicating bullish continuation) or risk further fading of rallies, which would suggest a return to range-bound or corrective trading.
Oscillator and Momentum Indicators (Weekly and Daily)
From a momentum perspective, the weekly oscillators point to a constructive yet cooling outlook, lacking signs of a fresh breakout structure. Daily momentum indicators are closer to neutral territory, indicative of a market that appears to be in a wait-and-see mode, poised for a catalyst to determine its next direction.
Volatility Metrics Analysis
VIX Overview
The CBOE Volatility Index (VIX) closed the previous session at 14.51, reflecting a decline throughout the day.
VIX Term Structure
The VIX term structure remains in contango, with an upward-sloping curve indicating that implied volatility is anticipated to rise over the coming months. Specifically, the implied volatility for January sits at 12.55, February at 15.38, and March at 17.34, with further increases projected for later months. This pattern is typically indicative of stable market conditions, suggesting that volatility is being priced higher down the line compared to the present.
Rates Volatility (MOVE)
The MOVE Index, which measures volatility in interest rates, is currently at 62.36 as we approach market close, also reflecting a decrease on the day. This level does not indicate significant stress within the market, aligning more with an environment in which investors are not exhibiting panic regarding interest rate fluctuations.
Options and Positioning Overview
Current Put/Call Ratios (Latest Daily Figures)
- Total Put/Call: 0.83
- Index Put/Call: 1.08
- ETP Put/Call: 0.85
- Equity Put/Call: 0.56
Analysis: The equity flow currently exhibits a call-leaning sentiment, as indicated by the lower equity put/call ratio. In contrast, index hedging remains active, with the index put/call ratio above 1. This duality is characteristic of late-cycle market behavior, where investors often purchase upside in individual stocks while simultaneously maintaining protective index hedges.
10-day Moving Average of Put/Call Ratios
Unfortunately, a definitive and authoritative 10-day moving average for the total put/call ratio is not readily available from the sources providing daily data in a machine-readable format. While the daily figures presented are confirmed, the 10-day averages cannot be securely sourced at this time.
SKEW - Tail Risk Pricing
The SKEW index closed at 141.86, a figure that Cboe describes as reflective of the pricing dynamics surrounding out-of-the-money SPX options, particularly those associated with tail risk. Typically, values for SKEW fluctuate within the 100-150 range. The implication is clear: despite a calm front-end volatility environment (as suggested by VIX levels), tail hedges are attractively priced.
Dealer Gamma Insights
Considering the current landscape of low spot volatility coupled with contango and a modest equity put/call ratio, market conditions suggest that dip buyers may defend the initial downside levels effectively. However, the elevated SKEW indicates that the demand for downside tail protection is increasing, meaning that if the market breaches key support levels (S4), panic-induced hedging activity could accelerate rapid downward movements. This interpretation is based on the metrics discussed and does not represent direct insights from dealer positioning.
Market Breadth and Internals Analysis
Advancers vs. Decliners (NYSE)
On January 2, 2026, the New York Stock Exchange recorded 1,882 advancing issues compared to 882 declining ones.
Breadth Oscillator (McClellan)
The NYSE’s McClellan Oscillator is currently at -18.826, a notable improvement from -76.414 previously. This indicates that while breadth remains slightly negative, the recent uptick suggests a reduction in selling pressure.
Sector Performance Snapshot
Recent market activity has highlighted leadership in the energy sector, along with notable strength in semiconductor stocks, while consumer segments have lagged behind. Should this trend continue, it would support a “grind/range” market environment rather than a drastic “waterfall selloff,” unless unexpected macroeconomic events disrupt the landscape.
Market Dynamics: Minor Wobble vs. Distribution Day
With breadth showing signs of improvement and credit markets not exhibiting significant stress, the current evidence leans towards a “minor wobble/consolidation” scenario rather than a full-scale distribution. This outlook holds, provided that key support levels remain intact and market internals do not deteriorate concurrently.
Credit and Funding Overview
High Yield ETFs
- HYG: 80.67
- JNK: 97.24
High Yield Spreads (OAS)
As of the last available print on December 31, 2025, the ICE BofA US High Yield OAS stands at 2.81%. This level is considered tight and typically signifies “orderly credit” conditions. It is important to monitor these spreads closely; a sharp widening could signal increased risk aversion, which often leads to more significant pullbacks in equity markets.
Sentiment and Crowd Positioning
AAII Sentiment (Latest)
- Bullish: 42.0%
- Neutral: 31.0%
- Bearish: 27.0%
The current sentiment readings indicate a notable tilt toward optimism. While this sentiment alone does not serve as a reliable timing mechanism for market reversals, it effectively diminishes the “wall of worry” that frequently fuels market squeezes.
Cross-Asset and Global Risk Tone
Crypto (Risk-On Proxy)
- BTC: 91,314
- ETH: 3,137.63
The resilience in cryptocurrency prices typically reflects a broader risk-on sentiment, although it should be noted that this is not a definitive indicator for daily movements in equities.
ES vs. NQ Relative Strength
The Nasdaq (NQ) continues to exhibit higher beta characteristics. If NQ consistently underperforms during market rallies, it may hinder attempts for the S&P 500 (ES) to push through resistance levels at R1 and R2.
Scheduled Events(ET):
Mon Jan 5
• 10:00 AM - ISM Manufacturing PMI (Dec)
Tue Jan 6
• 9:45 AM - S&P Global Final Services PMI (Dec)
Wed Jan 7
• 8:15 AM - ADP Employment Change (Dec)
• 10:00 AM - ISM Services PMI (Dec)
• 10:00 AM - JOLTS Job Openings (Nov)
• Late afternoon - Fed speaker risk (watch headlines)
Thu Jan 8
• 8:30 AM - Weekly Unemployment Claims
• 8:30 AM - Productivity and Unit Labor Costs (Q3)
Fri Jan 9 (highest impact)
• 8:30 AM - Nonfarm Payrolls, Unemployment Rate, Average Hourly Earnings
• 10:00 AM - University of Michigan Consumer Sentiment (prelim)
Two A++ setups (Level-KZ Protocol 15/5/1)
A++ Setup 1 - Rejection Fade Short (R1/R2 cap)
Entry: 6934.75-6937.50
Hard SL: 6946.25 (above the 15m rejection wick)
TP1: 6906.50 (S1)
TP2: 6889.50 (S3 top)
TP3: 6875.50 (S4 top)
Invalidation: 15m acceptance above 6940.75 and holding (no immediate snapback)
A++ Setup 2 - Bounce Long (S4 defend)
Entry: 6869.00-6876.00
Hard SL: 6859.75 (below the reclaim wick and below 6861.75 fib magnet)
TP1: 6902.75 (S1)
TP2: 6938.50 (R1)
TP3: 6982.50 (R3 first tag)
Invalidation: 15m bodies holding below 6866.75
Good Luck !!!

ES (SPX, SPY) Analysis, Levels, Setups for Fri (Dec 12)CONFIRMED EVENTS - FRI 12/12 (ET)
13:00 - Baker Hughes U.S. rig count
15:30 - CFTC Commitments of Traders (COT) release (usual time)
Theme risk: liquidity headlines remain in play with the Fed starting reserve-management T-bill buying on 12/12 (not a data print, but worth respecting).
Market Analysis: Pre-Market Overview
As we approach the market open, the ES is currently positioned near the main pivot point at 6896.50 (Y-POC). Overnight trading saw a rise to the 6911.75-6912.50 range, but prices have since retraced back below a critical resistance zone at 6908.50-6909.25, which includes the year’s value area high (Y-VAH) and the previous day’s high (PDH). This dynamic suggests a cautious trading atmosphere characterized by “tight range first, trend second,” unless we witness a definitive reclaim above this resistance.
When ES gets this tight, it usually means liquidity is being packed for a pop (either direction). The trap is overtrading inside the middle of the box.
Right now the clean box is:
• Premium zone: 6900.75 then 6908.50-6909.25
• Bottom zone: 6892.00 then 6889.75
Key Resistance Levels:
- 6900.75: Asia session low
- 6908.50-6909.25: Significant resistance from Y-VAH and PDH
- 6911.75-6912.50: Upper threshold to watch
If buyers can maintain a position above 6909.25 for 15 minutes, it may set the stage for a rally towards 6922.25, aligning with prior closing levels.
Key Support Levels:
- 6892.00: London session low
- 6891.25: Overnight high
- 6884.75: Further potential support
- 6878.00: Continued downside target
- 6866.50: Year’s value area low (Y-VAL)
A decisive move below 6892.00 could trigger a morning pullback towards the 6884.75-6878.00 zone, with 6866.50 acting as a deeper support reference.
Today’s market activity will likely be influenced by developments in the semiconductor sector. Broadcom is placing pressure on the AI space due to concerns over margins, while Nvidia's outlook is being scrutinized in light of recent China-related headlines. Traders should brace for increased volatility around the 6900 and 6909 levels as movements in semiconductor stocks unfold.
The only significant intraday economic release scheduled is the Baker Hughes rig count, expected at 1:00 PM ET. Investors should also note that larger US economic data releases are anticipated next week, following a backlog caused by the recent government shutdown.
A++ SETUP 1 - REJECTION FADE (SHORT) from 6911.75-6915.50
15m pushes above 6911.75/6915.50 and closes back below 6909.25 - then 5m retest fails - then 1m first pullback gives LH.
Entry: 6909.75-6911.25
Hard SL: 6916.25 (above the rejection wick)
TP1: 6896.50
TP2: 6884.75
TP3: 6878.00
A++ SETUP 2 - ACCEPTANCE CONTINUATION (LONG) above 6922.25
15m full-body close above 6922.25 - then 5m pullback holds 6915.50-6911.75 and re-closes up - then 1m HL to enter.
Entry: 6916.00-6918.00 (on the hold)
Hard SL: 6908.25 (below the hold + back under PDH/Y-VAH area)
TP1: 6934.00
TP2: 6946.50
TP3: 6976.75
Good Luck
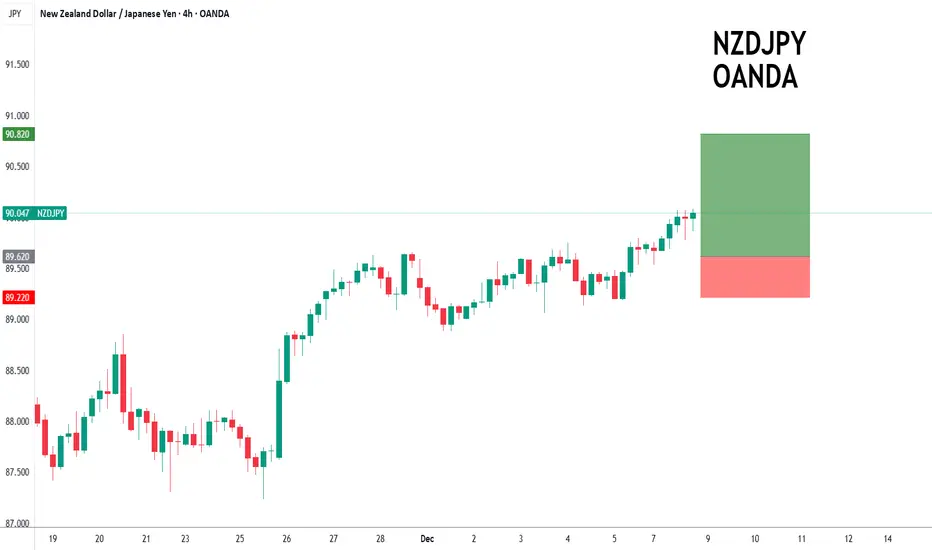
NZDJPY intraday dips continue to attract buyers.NZDJPY - 24h expiry
Intraday dips continue to attract buyers and there is no clear indication that this sequence for trading is coming to an end.
88.88 has been pivotal.
20 4hour EMA is at 89.62.
The RSI is trending higher.
Dip buying offers good risk/reward.
We look to Buy at 89.62 (stop at 89.22)
Our profit targets will be 90.82 and 91.02
Resistance: 90.07 / 90.50 / 91.00
Support: 89.60 / 89.06 / 88.88
Risk Disclaimer
The trade ideas beyond this page are for informational purposes only and do not constitute investment advice or a solicitation to trade. This information is provided by Signal Centre, a third-party unaffiliated with OANDA, and is intended for general circulation only. OANDA does not guarantee the accuracy of this information and assumes no responsibilities for the information provided by the third party. The information does not take into account the specific investment objectives, financial situation, or particular needs of any particular person. You should take into account your specific investment objectives, financial situation, and particular needs before making a commitment to trade, including seeking, under a separate engagement, as you deem fit.
You accept that you assume all risks in independently viewing the contents and selecting a chosen strategy.
Where the research is distributed in Singapore to a person who is not an Accredited Investor, Expert Investor or an Institutional Investor, Oanda Asia Pacific Pte Ltd (“OAP“) accepts legal responsibility for the contents of the report to such persons only to the extent required by law. Singapore customers should contact OAP at 6579 8289 for matters arising from, or in connection with, the information/research distributed.
EURAUD to find buyers at current market price?EURAUD - 24h expiry
The selloff is close to an exhaustion count on the intraday chart.
We expect a reversal in this move.
Risk/Reward would be poor to call a buy from current levels.
A move through 1.7650 will confirm the bullish momentum.
The measured move target is 1.7800.
We look to Buy at 1.7600 (stop at 1.7525)
Our profit targets will be 1.7750 and 1.7800
Resistance: 1.7650 / 1.7700 / 1.7750
Support: 1.7600 / 1.7550 / 1.7525
Risk Disclaimer
The trade ideas beyond this page are for informational purposes only and do not constitute investment advice or a solicitation to trade. This information is provided by Signal Centre, a third-party unaffiliated with OANDA, and is intended for general circulation only. OANDA does not guarantee the accuracy of this information and assumes no responsibilities for the information provided by the third party. The information does not take into account the specific investment objectives, financial situation, or particular needs of any particular person. You should take into account your specific investment objectives, financial situation, and particular needs before making a commitment to trade, including seeking, under a separate engagement, as you deem fit.
You accept that you assume all risks in independently viewing the contents and selecting a chosen strategy.
Where the research is distributed in Singapore to a person who is not an Accredited Investor, Expert Investor or an Institutional Investor, Oanda Asia Pacific Pte Ltd (“OAP“) accepts legal responsibility for the contents of the report to such persons only to the extent required by law. Singapore customers should contact OAP at 6579 8289 for matters arising from, or in connection with, the information/research distributed.

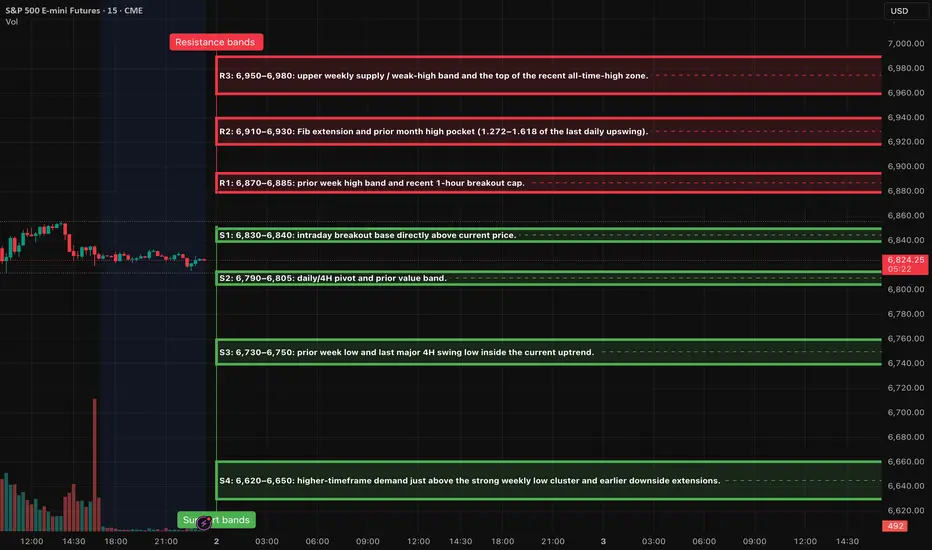
ES (SPX, SPY) Analysis, Levels, Setups for Tue (Dec 2nd)The market structure remains optimistic on the higher timeframes, bolstered by a significant rebound from the 6,520 levels. Currently, prices are fluctuating in the upper range of this move, consolidating between the intraday support and the previous weekly high. Although momentum indicators are stretched, they have yet to indicate a reversal, suggesting a potential continuation toward resistance levels R1 and possibly R2, provided that buyers can uphold the nearest support zones. Conversely, a failure to maintain support at S1 and S2 could pave the way for a deeper corrective phase targeting S3.
The levels are remain the same from yesterday analysis.
A++ SETUP 1 - LONG FROM S2 RELOAD BAND (6,790-6,805)
look for an overnight or early NY flush into 6,800 ± 10 points, followed by a strong rejection: wick below S2 on 15m, close back inside the band, plus a higher low on 5m.
Entry zone: 6,800-6,795 (inside S2 once rejection shows).
Hard stop: 6,780 (below the lower edge of S2 and recent wick structure).
TP1: 6,845-6,855 (back through S1 into the middle of the current range).
TP2: 6,870-6,885 (R1 test).
A++ SETUP 2 - SHORT LIQUIDITY SWEEP INTO R1 (6,870-6,885)
during London or NY AM, price spikes through 6,870 into the 6,870-6,885 band, takes out prior highs, but then prints a rejection: 15m candle with an upper wick and close back below about 6,875, plus a lower high on 5m.
Entry zone: 6,875-6,880 after the rejection is confirmed, not on the first blind touch.
Hard stop: 6,895 (above the top of R1; acceptance above there suggests a push toward R2).
TP1: 6,835-6,840 (back into S1).
TP2: 6,800-6,795 (retest of S2).
Key Events and Data to Watch on Tuesday
Tomorrow's U.S. session will be pivotal, focusing on key indicators of manufacturing and construction. The final S&P Global U.S. Manufacturing PMI will be released at 9:45 a.m. ET, followed closely by the ISM Manufacturing Index at 10:00 a.m. ET—both crucial for assessing factory activity and the momentum of economic growth. Concurrently, the Commerce Department will unveil October Construction Spending figures, a vital metric for understanding demand in infrastructure and housing sectors. Additionally, domestic vehicle sales data will be published, providing further insight into consumer strength.
Moreover, the OECD's latest Economic Outlook will present updated global growth projections, which could significantly influence market risk appetite. As markets remain attuned to indicators of decelerating economic activity, any surprises in these reports could lead to notable shifts between support levels (S2) and resistance levels (R1/R2), potentially reinforcing expectations for a rate cut from the Fed in December.
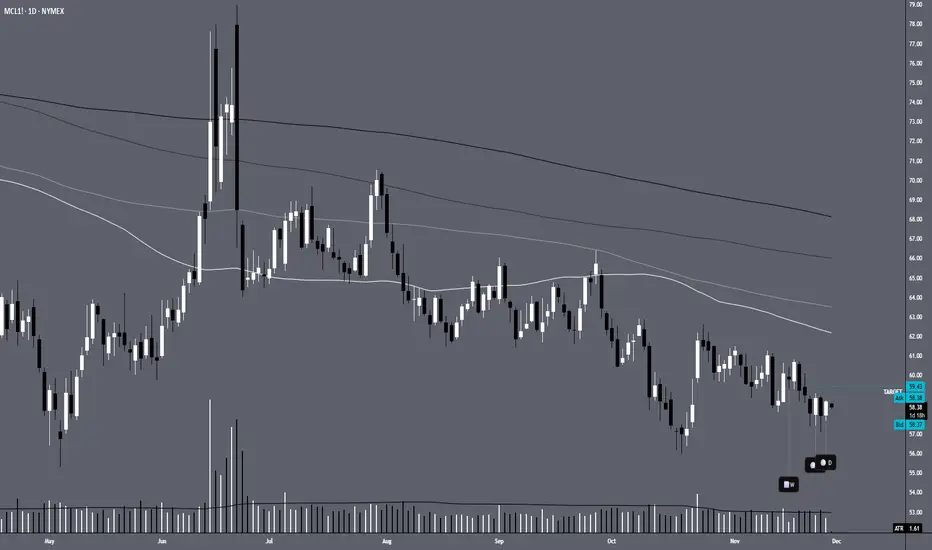
MCL1!Price is currently underneath the quarter's mark. Testing a support zone. Price could retest the November resistance zone.
USDJPYAccording to the current quarter, price has been below the average. There was a sign of weakness on the week on 11/09/25 and since then, price has some bullish momentum going on with a more recent pullback. I want to see if price can test the current target which is near a previous resistance. If not, remember that trading is simply a game of probabilities.

NZDCADAccording to the current quarter, price has been below the average. There was a sign of weakness on the week on 11/16/25 and since then, price has some bullish momentum going on. I want to see if price can test the current target. If not, remember that trading is simply a game of probabilities. It's not much to grab according to my target but I have to stick to my strategy.

GBPUSDAccording to the current quarter, price has been below the average. Price is also at a level where the third and fourth quarter ago from the current has averaged. There was a sign of weakness on the week on 11/2/25 and since then, price is a very small range zone. I want to see if price can test the current target. If not, remember that trading is simply a game of probabilities. It's not much to grab according to my target but I have to stick to my strategy.

EURNZDAccording to the current quarter, price has been above the average. There has been two signs of weakness on the week of 11/09/25 and 11/16/25. Since the week of the 9th, there seems to be a range play going on. I want to see if price can test the current target. If not, remember that trading is simply a game of probabilities.

CADCHF According to the current quarter, price has been below the average. There was a sign of weakness on the week on 11/2/25 and since then, price is testing a resistance zone. I want to see if price can test the current target. If not, remember that trading is simply a game of probabilities.

ES (SPX, SPY) Analysis, Levels, PA Forecast, Setups Fri (Nov 21)Analyzing Today’s Sharp Market Decline
The significant selloff observed today was not an arbitrary event. The day began with a robust rally following another impressive earnings report in the AI-chip sector, which propelled futures sharply upward and triggered a short squeeze in the Nasdaq. However, the release of a stronger-than-anticipated jobs report shifted the market's sentiment. While hiring showed signs of rebounding, the unemployment rate also ticked higher, undermining the prevailing narrative that the Federal Reserve would soon lower interest rates.
This development served as a stark reminder of the ongoing restrictive monetary policy, coupled with slowing economic growth and exorbitant valuations in the tech sector. Major investment funds capitalized on the morning’s strength in AI and large-cap stocks as an opportunity to reduce their risk exposure. Additionally, systematic trend-followers faced compulsion to sell once the S&P 500 fell below critical support levels.
The environment for high-beta assets, including cryptocurrencies, is already in a “reset” phase, which left little incentive for dip-buying at lower price points. As the E-mini S&P 500 futures broke through the previous day’s support levels, the situation escalated into a full liquidation. This perfect storm involved trapped long positions from the morning breakout, stop-loss orders falling into execution beneath yesterday’s lows, and mechanical selling, culminating in the largest intraday reversal since the spring.
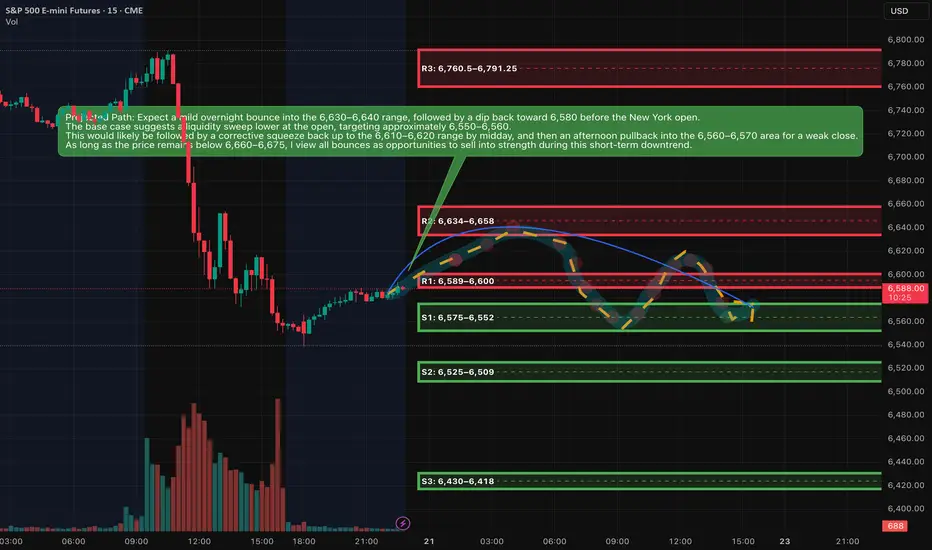
Market Outlook
The current market sentiment is skewed bearish as the ES remains entrenched below the critical 6,660 to 6,700 range. The price is hovering near a significant demand zone established around the lows of the previous trading day and today’s New York session. While we can expect some upward bounces, these movements appear to be temporary rallies within an ongoing downtrend, rather than indicators of a potential new upward leg.
Market Analysis: Is This the Beginning of a Downtrend or a Temporary Shakeout?
In the recent developments within the E-mini S&P 500 (ES) on the daily timeframe, we’ve observed the formation of a distinct lower high following the recent all-time peak. This shift has seen prices breach the last identified higher-low area, establishing a new narrative. The sequence has transitioned from a higher high to a lower high, culminating in a movement into prior demand zones marked by increased volume, all while momentum appears to be rolling over.
On the four-hour chart, the prevailing trend reflects a series of lower highs and lower lows. The recent selloff has further entrenched this trajectory into the discount zone, now signaling proximity to the next Fibonacci retracement target below.
While momentum indicators have already dipped from overbought conditions, they have not yet reached deeply oversold thresholds, indicating potential for another leg downward following any short-term corrective bounce.
From a broader perspective, the long-term trend remains positive; however, a short- to medium-term corrective phase appears to be in play. Today’s market dynamics suggest we may be in the midst of this corrective leg rather than witnessing the final downturn.
As prices have recently entered a significant demand zone, a bounce lasting one to three sessions—or a period of sideways consolidation—seems likely before any potential further decline.
In summary, while current conditions favor a move towards lower prices in the days ahead, the market likely anticipates a "lower after a bounce" scenario rather than an immediate and steep decline.
Key resistance zones
Resistance is written as bands, not single ticks.
R1: 6,589–6,600
This band sits around the current Asia-session high and the underside of today’s New York low. It is the first lid above price. If rallies stall here, the tape stays heavy and favors another test of the lows.
R2: 6,634–6,658
This is the main breakdown zone from today, centered around the New York afternoon high and the upper edge of the late-session range. As long as ES trades below this shelf, the short-term downtrend remains intact and every bounce is suspect.
R3: 6,760.5–6,791.25
This band covers the New York morning low-to-high range and the origin of the big sell leg. If price ever retests this area and fails, it is a prime region for larger swing shorts. Only sustained trade and closes above this pocket would suggest the current corrective leg is ending.
---
Key support zones
S1: 6,575–6,552
This is the immediate floor combining the Asia-session low, New York afternoon low, and prior-day value low. It is where we are effectively trading now. Expect reactive bounces and stop-runs here, as both sides are active.
S2: 6,525–6,509
This is the next downside magnet if S1 breaks cleanly. It aligns with a fib extension and 4-hour demand. A decisive move into this region would represent the next step down in the correction.
S3: 6,430–6,418
Deeper extension and prior higher-timeframe demand. If the correction matures into a more serious pullback over several sessions, this pocket becomes a reasonable medium-term downside destination.
A++ Setup 1 – Short from R2 supply (continuation short)
Direction: Short
Entry zone: 6,638–6,648
SL (hard stop): 6,678
TP1: 6,588
TP2: 6,552
TP3: 6,515
Invalidation (structure):
If we get a 15m full-body close above 6,675, treat the short idea as invalid and stand aside; market is likely shifting into a squeeze toward 6,700+ instead of extending the down leg.
---
A++ Setup 2 – Quick-reclaim long from S1 demand (counter-trend bounce)
Direction: Long
Entry logic: need a flush then reclaim
Entry zone (after reclaim): 6,562–6,568
SL (hard stop): 6,538
TP1: 6,610
TP2: 6,638
TP3: 6,660
Invalidation (structure):
If price breaks below 6,552 and 15m closes stay below 6,545 without a fast reclaim, the bounce idea is invalid; then you wait for the deeper S2 zone instead of forcing longs here.
Good Luck !!!
ES (SPX, SPY) Analyses, Key Zones, Setups for Wed (Nov 19th)Market Analysis: A Shift in Momentum for ES
In today's market, the daily chart for the E-mini S&P 500 (ES) reveals a notable shift in momentum, characterized by a sequence of price action that signals a potential downtrend. Previously, we observed a high, followed by a lower high, and today's movement has decisively broken through the last remaining support at the higher-low shelf. This change comes after a rejection from the recent lower-high zone, situated just below the 6,900 mark, followed by a retreat through the crucial 6,700 threshold. What initially appeared to be a bullish uptick is now consolidating into a corrective downswing.
Today's significant drop marks the continuation of this emerging downward trajectory. Prices breached intraday support around 6,675 to 6,700, slid past the prior higher-low region near 6,635, and ultimately settled atop the initial daily demand zone. Notably, the selling volume during this decline expanded compared to previous sessions, underscoring that this movement reflects genuine market participation rather than mere fluctuations.
While the longer-term outlook remains bullish, reflected in the weekly trend, the daily and four-hour charts currently indicate a pronounced short-term downtrend. Key indicators include the formation of a lower high, the breach of the previous higher-low, and a liquidity run to the downside toward the extension cluster. As we move forward, this developing bearish scenario suggests potential for further declines in the coming sessions, though we are positioned within local demand territory, indicating that bounces and two-directional trading are likely in the near term.
Key Resistance Zones
Resistance 1: 6,637
This level represents today’s late-session swing high on the 30-minute chart, denoted as the S-session high (S.H 6,637). It serves as the initial resistance point above the current market price.
Resistance 2: 6,679.75 – 6,687.50
A cluster of highs, with NYAM.H marked at 6,679.75, LO.H at 6,685.75, and NYPM.H at 6,687.50, forms a critical intraday supply pocket. This region represents the primary A++ short zone should the price experience a bounce.
Resistance 3: 6,700 – 6,720
Above the NY session high band, the 4-hour chart highlights a previously broken support shelf and local supply just below 6,720. Any movement back into this area would likely be corrective within the ongoing downswing unless the E-mini S&P can close and hold a daily candle above this range.
Higher-Timeframe Cap:
Any price action remaining below the recent daily lower-high zone—situated near the last significant LH before the drop—maintains a bearish bias for the larger swing. A definitive daily close above this lower-high would be necessary to negate the current short-term downtrend.
---
Key Support Zones
Support 1: 6,627.50 and 6,614.75
The AS.L level is printed at 6,627.50, with the NL.L around 6,614.75 on the 30-minute chart. Together, these levels form the initial local support shelf just beneath the current price.
Support 2: 6,606.50 – 6,603.25
Marked by NYPM.L at 6,606.50 and NYAM.L at 6,603.25, this band serves as the next area of resting liquidity from today’s trading sessions. A clean break and sustained move below this range could pave the way for the Fibonacci targets below.
Support 3 (Major Fibonacci Cluster): 6,541.50 – 6,509.00
On the 1-hour chart, the 1.272 Fibonacci level is found at 6,541.50, while the 4-hour chart places it at 6,509.00. The daily chart marks the 1.272 at 6,521.25, creating a significant demand box from approximately 6,541 down to 6,509, with 6,521 serving as a mid-pivot. This is the pivotal "bounce or break" zone.
Support 4 (Deeper Extension Pocket): 6,501.75 – 6,458.00
The 1-hour chart identifies the 1.618 Fibonacci extension at 6,501.75 and the 2.0 extension at 6,458.00. The 4-hour chart aligns the 1.618 at 6,429.25 and the 2.0 at 6,341.50, with the daily chart placing the 1.618 at 6,418.00 and the 2.0 around 6,304.00. The initial focus for tomorrow is the 6,502–6,458 region. Should the 6,541–6,509 band fail, this area becomes a strong magnet where a more pronounced short-covering bounce is likely.
The definitive structural line on the downside is the cumulative daily 1.618–2.0 cluster, ranging from approximately 6,418 down to 6,304. A decline to this range could signify a major correction leg rather than a mere shallow pullback.
A++ SETUP 1 — REJECTION SHORT FROM NY HIGH BAND
Trigger:
15m: candle wicks into 6,680–6,688 and closes back below about 6,675.
5m/1m: a failed attempt to push higher (lower high) after that rejection.
Entry:
Aggressive: enter short 6,678–6,682 after the 15m rejection close and 1m fails to make new highs.
Conservative: limit sell in 6,680–6,685 on a controlled retest from below.
Stop (hard invalidation):
Around 6,698.00 above the band and intraday highs (about 16–20 points of risk if filled 6,678–6,682).
Targets:
TP1: 6,637.00 (session swing high). From 6,680 entry with 6,698 stop ≈ 2.3R.
TP2: 6,606.50 – 6,603.25 (NYPM.L / NYAM.L shelf), ≈ 4R from 6,680 entry.
TP3: 6,541.50 – 6,521.25 (top of fib demand cluster), campaign-style extension.
A++ SETUP 2 — EXHAUSTION LONG FROM FIB CLUSTER DEMAND
Trigger:
15m: price trades below 6,530, tags 6,521–6,509, then closes back above about 6,530 (wick through, body back up).
5m/1m: a higher low forms above roughly 6,520 after that reclaim; sellers fail to push back below the cluster.
Entry:
Aggressive: 6,525–6,535 on the first higher low on 1m/5m after the 15m reclaim of 6,530.
Conservative: limit buy near 6,525 on a controlled retest into the top of the cluster after the first reaction.
Stop (hard invalidation):
Around 6,497.00 under the bottom of the cluster and recent swing low (≈ 30–38 points of risk if entered 6,525–6,535).
Targets:
TP1: 6,595–6,600 (broken structure and local VWAP zone). From 6,530 entry with 6,497 stop ≈ 2R.
TP2: 6,637.00 (S-session high and first major resistance).
TP3: 6,679.75 – 6,687.50 (NYAM.H / LO.H / NYPM.H band), where a bounce can turn into a full squeeze.
Upcoming Economic Indicators
For tomorrow's trading session (Wednesday, U.S. time), traders should keep an eye on several key economic releases:
- At 8:30 AM ET, the U.S. will release Housing Starts and Building Permits for October, along with import/export price indices. These figures are vital for gauging growth, especially after a series of subdued permits and erratic starts.
- At 10:30 AM ET, the EIA Weekly Petroleum Status Report, alongside crude inventory data, is expected to influence energy markets and broader risk sentiment.
- Later in the afternoon, markets will be attentive to FOMC minutes and remarks from New York Fed President John Williams, both of which could impact rate-cut expectations based on the overall tone relative to recent communications.
Good luck !!!

GBPAUD has formed a double top.GBPAUD - 24h expiry
Posted a Double Top formation.
We look for a temporary move higher.
The bearish engulfing candle on the 4 hour chart is negative for sentiment.
The overnight rally has been sold into and there is scope for further bearish pressure going into this morning.
Risk/Reward would be poor to call a sell from current levels.
We look to Sell at 2.0305 (stop at 2.0381)
Our profit targets will be 2.0085 and 2.0045
Resistance: 2.0260 / 2.0343 / 2.0400
Support: 2.0150 / 2.0100 / 2.0030
Risk Disclaimer
The trade ideas beyond this page are for informational purposes only and do not constitute investment advice or a solicitation to trade. This information is provided by Signal Centre, a third-party unaffiliated with OANDA, and is intended for general circulation only. OANDA does not guarantee the accuracy of this information and assumes no responsibilities for the information provided by the third party. The information does not take into account the specific investment objectives, financial situation, or particular needs of any particular person. You should take into account your specific investment objectives, financial situation, and particular needs before making a commitment to trade, including seeking, under a separate engagement, as you deem fit.
You accept that you assume all risks in independently viewing the contents and selecting a chosen strategy.
Where the research is distributed in Singapore to a person who is not an Accredited Investor, Expert Investor or an Institutional Investor, Oanda Asia Pacific Pte Ltd (“OAP“) accepts legal responsibility for the contents of the report to such persons only to the extent required by law. Singapore customers should contact OAP at 6579 8289 for matters arising from, or in connection with, the information/research distributed.

ES (SPX, SPY) Analysis, Key Zones, Setups for Tue (Nov 18th)ES experienced a notable decline, concluding the day with a sharp downturn but managed a late-session rebound off a significant demand zone. At this juncture, it appears to be a robust corrective phase within an overarching uptrend, with a reasonable probability of a bounce or a range-bound trading day ahead, barring any unexpected developments from data releases or commentary from Federal Reserve speakers.
Looking ahead to tomorrow, November 18, 2025, the economic calendar is unusually packed for a Tuesday, as various U.S. data are set to be released following delays caused by a government shutdown. Key indicators to watch that could influence ES during the New York session include the import and export price indexes for October at 8:30 AM ET, industrial production and capacity utilization figures also for October at 9:15 AM ET, and the NAHB housing market index for November at 10:00 AM ET.
Additionally, several Federal Reserve officials, including Barr, Waller, Williams, and Kashkari, are scheduled to speak throughout the day. The market is particularly attuned to their insights regarding the likelihood of another rate cut, especially in light of the recently released October FOMC minutes and this week’s jobs report.
Given the abundance of potential market-moving information, I would consider the period from 9:15 to 10:15 AM ET as a critical window for "headline risk" tomorrow.
The recent market decline can largely be attributed to macroeconomic factors:
The S&P 500 cash index ended the day down approximately 0.9%, with the Dow falling around 1.2% and the Nasdaq declining by about 0.8%. This pullback has moved the indices further away from their all-time highs established last month.
The selling pressure was particularly acute among mega-cap technology stocks and the AI sector. Major players such as Nvidia, Apple, Palantir, and AMD faced heavy trading as investors began to question whether the recent surge in tech stocks, driven by AI enthusiasm, had outpaced underlying fundamentals ahead of Nvidia’s earnings release on Wednesday.
Market sentiment was further dampened by a noteworthy prediction from Stifel's chief strategist, who suggested a potential 5% drop in the S&P 500, targeting a level around 6,350 in the coming months. This outlook was based on concerns regarding high valuations and uncertainties surrounding the Fed’s future policy as delayed economic data begins to materialize.
Interestingly, the yield on 10-year Treasuries dipped slightly towards ~4.13% , indicating that today’s selloff was more of a de-risking/profit-taking maneuver specific to equities rather than a reflection of widespread risk aversion typically signaled by bond market movements.
From a technical perspective on the ES futures:
Intraday trading patterns reflected a continuation of last week’s trend of lower highs and lower lows. Prices faltered near the 6,800–6,805 mark during the overnight session before entering a clear downtrend through the morning. The volume accelerated during the late-morning selloff, ultimately reaching a low around the 6,658–6,660 band, which coincides with established daily demand zones.
Following this drop, we observed a pronounced shift in behavior: significant buying volume surged at the lows, leading to a rejected price at that demand zone and a controlled short-covering rally back above 6,690, approaching the 6,700–6,705 range as the day closed. The Nasdaq exhibited a similar trajectory, with a heavy selloff subsequently followed by a recovery.
Structurally, today’s activity reflects:
A strong continuation of downside movement, stemming from last week’s lower-high structure and macro-driven de-risking, culminating in a liquidity flush into a previously identified demand pocket followed by short-covering toward the close.
From a broader perspective, is this the beginning of a genuine downtrend?
On the daily chart, ES remains within a larger uptrend originating from the summer lows. A higher peak above 6,900 was established in late October, with the current pullback representing a decline of approximately 3–4% from that peak. Today's trading reached the 6,650–6,670 support region, which previously served as a vital higher low space, before closing back above it. Daily momentum indicators have rolled over but are beginning to flatten, indicating they are not yet deeply oversold.
In contrast, the shorter-term 4-hour and 1-hour views present a more bearish outlook: a sequence of lower highs has formed, and the retest of prior higher low levels appears to be underway. Short-term moving averages have shifted downward, and 4-hour momentum remains negative, albeit with initial signs of a slight positive divergence compared to new price lows.
In summary:
I interpret this phase as a significant corrective downswing within a larger uptrend rather than the onset of a new bear market. The potential for a more substantial correction exists, particularly if Nvidia’s earnings disappoint or if the run of delayed economic data proves weak. However, the day's trading indicates more of a necessary adjustment rather than the onset of a catastrophic decline, aligning with institutional views that this pullback signifies a "healthy reset" following a robust advance, rather than an indication of a market bubble bursting.
Should ES close below the 6,650 mark on a daily basis and subsequently begin to print lower highs under that level, I would increase my assessment of the risk of a transition into a more enduring downtrend, with targets around the 6,350–6,400 range over the coming weeks, echoing Stifel's projections. For the time being, however, buyers continue to defend this crucial daily support zone.
Key zones to monitor for tomorrow, in the futures market:
I identify the following support zones:
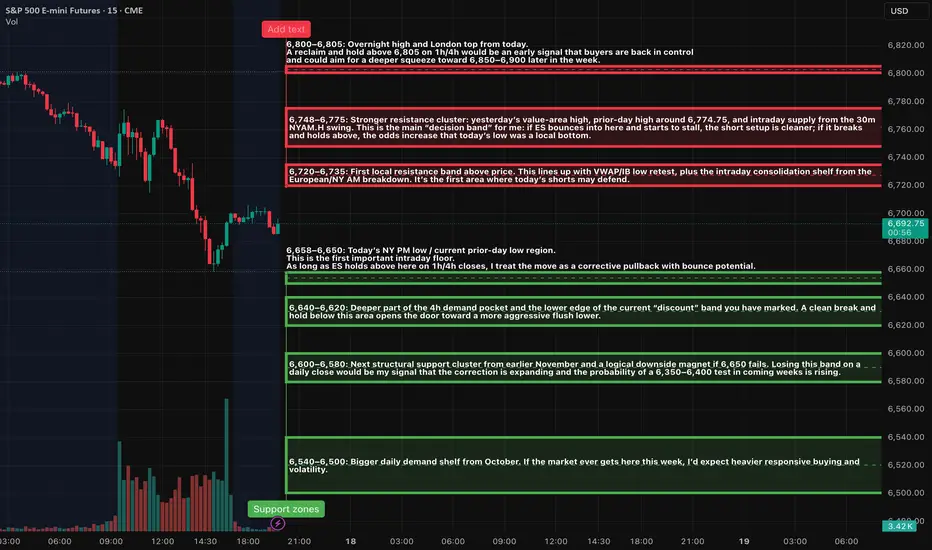
6,658–6,650: This region marks today’s New York PM low and aligns with the prior day’s low. It serves as the first critical intraday support level. As long as ES maintains closes above this area on 1-hour and 4-hour charts, I consider the movement to be a corrective phase rather than a broader downtrend.
ES (SPX, SPY) Analysis for Week Ahead (Nov 17th - 21st)Market Analysis: ES1 - Navigating Recent Price Action and Upcoming Economic Catalysts
Current Price Context:
The E-mini S&P 500 (ES1) is currently trading in the range of 6,755 to 6,785, following a sharp pullback from the 6,880 to 6,900 peak and a notable rebound off the 6,650 levels. While both the weekly and daily structures exhibit an overarching uptrend characterized by higher highs and higher lows, we are presently experiencing a mid-pullback phase, with prices resting below a newly established supply zone spanning 6,850 to 6,900. Importantly, we remain above the key demand shelf situated around 6,650 to 6,670.
Big Picture Overview: Weekly and Daily Trends
- Weekly Analysis: Over recent months, ES has ascended from approximately 6,000 to the 6,900 level. The past few weeks have seen a new high printed, followed by a red candle signaling a pullback towards mid-range levels. Despite this corrective move, we maintain a buffer above the preceding weekly low near the 6,500 to 6,550 range, affirming the uptrend. The current price action appears more as a corrective pause rather than a definitive peak.
- Daily Perspective: After reaching a new high just shy of the 6,900 mark, the market retreated into the mid-6,600s before bouncing back. Recent daily candles indicate a phase of consolidation within the 6,730 to 6,780 range, characterized by wicks on both ends and diminishing body sizes, alongside reduced volume compared to earlier volatility. Oscillator indicators are retreating from overbought conditions but appear to be stabilizing, suggesting a digestion phase rather than a full-scale momentum breakdown.
Shorter Timeframe Analysis (4-Hour and 1-Hour):
- On the 4-hour chart, a completed downward impulse from around 6,880 to the low 6,650s has been observed, with the price touching the 1.272 Fibonacci extension at approximately 6,653. Additional Fibonacci levels below include 6,597 (1.618) and 6,536 (2.0). The price action around the 1.272 extension has prompted a robust response, featuring significant green candles and increased volume, establishing a base between 6,700 and 6,800.
- On the 1-hour chart, the market exhibits a minor uptrend (from lower lows to higher highs) that has encountered resistance around 6,780. Currently, price action is consolidating near a pivot level of 6,750, leading to the establishment of a balance range between 6,720 and 6,780 as we head into Monday.
Summary: The broader context remains bullish on higher timeframes, with a corrective phase taking root on the medium timeframe, while the short-term landscape indicates balance. This scenario represents a classic "trend pullback parked on key support," with next week's developments likely steering us either back toward the highs or engendering a deeper test of 6,600 or 6,550, contingent on forthcoming economic data and Fed commentary.
Macro and Event Landscape: A Busy Week Ahead
The recent U.S. government shutdown has resulted in a considerable backlog of economic data releases. Market participants will be closely monitoring delayed payroll data, along with other significant indicators such as industrial production and housing metrics that are being released simultaneously. This aggregation of data is anticipated to introduce intraday volatility, particularly during the 8:30 to 10:00 AM ET windows.
Key Economic Indicators to Watch:
- Core Data Releases: In the week of November 17–21, critical releases include:
- Empire State manufacturing index
- Import and export price indices
- Industrial production and capacity utilization figures for October
- Housing starts and building permits scheduled for mid-week
- Additional delayed labor data later in the week as agencies address the backlog.
- FOMC Minutes and Fed Commentary: The release of the FOMC minutes from the late October meeting will communicate the Fed's confidence in the recent improvements in inflation and its openness to potential rate cuts in December. A lineup of Fed speakers is set to take the stage, likely influencing market sentiment and causing price reactions based on their comments.
- Corporate Earnings: Noteworthy earnings reports from Nvidia and major retailers, including Walmart, are on the calendar. Nvidia's performance will be scrutinized as a barometer for the AI segment, while insights from retail giants will provide a glimpse into consumer health as the holiday season approaches. Strong results coupled with optimistic guidance tend to buoy ES, while any disappointments could weigh on index futures, especially given the concentrated leadership from a handful of major tech stocks.
Market Sentiment and Positioning: Rate-cut expectations for December have decreased to about 40%, leaving investors cautious but not overly alarmed. This environment allows for potential relief rallies if data and Fed sentiments tilt favorably, while a series of negative reports may trigger a notable risk-off sentiment.
Conclusion: The upcoming week is poised to be event-driven, lacking a singular "mega" release like CPI but rather presenting a series of medium-to-large catalysts (Fed minutes, late payrolls, industrial production, housing statistics, Nvidia, and Walmart). Traders should be prepared for choppy conditions and liquidity fluctuations around the release times, with clearer directional moves anticipated between these events.
KEY ZONES – RESISTANCE
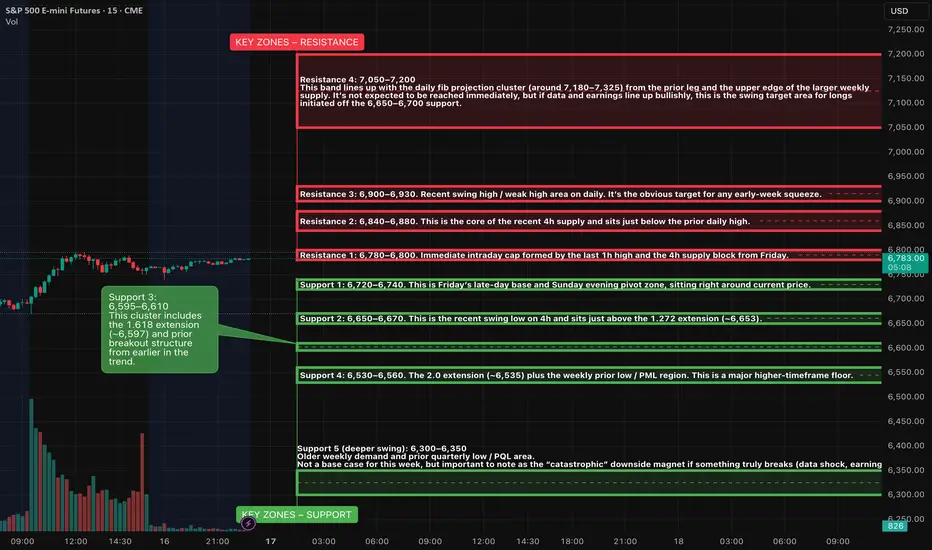
Resistance 1: 6,780–6,800
Immediate intraday cap formed by the last 1h high and the 4h supply block from Friday. This is the ceiling that has repeatedly turned price in the last session. A 1h or 4h close above 6,800 would confirm that buyers are back in control and likely aim for 6,850+ fairly quickly.
Resistance 2: 6,840–6,880
This is the core of the recent 4h supply and sits just below the prior daily high. It’s where the last strong sell program launched. If price trades into this pocket on light volume and stalls, that favours a lower-high top and another rotation back toward 6,720–6,700. If the tape pushes through decisively, shorts will be forced to cover.
Resistance 3: 6,900–6,930
Recent swing high / weak high area on daily. It’s the obvious target for any early-week squeeze. If this zone gets cleaned out and holds on the retest, the uptrend resumes and we can start talking about higher fib extensions and a run toward the 7,000 handle. A sharp rejection here, especially around Fed minutes or Nvidia earnings, would fit a double-top pattern and could kick off a deeper pullback leg.
Resistance 4: 7,050–7,200
This band lines up with the daily fib projection cluster (around 7,180–7,325) from the prior leg and the upper edge of the larger weekly supply. It’s not expected to be reached immediately, but if data and earnings line up bullishly, this is the swing target area for longs initiated off the 6,650–6,700 support.
KEY ZONES – SUPPORT
Support 1: 6,720–6,740
This is Friday’s late-day base and Sunday evening pivot zone, sitting right around current price. It lines up with the 1h equilibrium where price has been rotating. As long as ES holds above 6,720 on closing basis, buyers are defending the immediate balance and can make another push toward 6,780–6,800.
Support 2: 6,650–6,670
This is the recent swing low on 4h and sits just above the 1.272 extension (~6,653). It’s the first real higher-timeframe demand pocket of this pullback. A clean tag and strong bounce here would look like a classic trend-pullback low forming. A sustained break under 6,650 would suggest the market isn’t done repricing and opens the door to the deeper fibs.
Support 3: 6,595–6,610
This cluster includes the 1.618 extension (~6,597) and prior breakout structure from earlier in the trend. It’s the “deeper but still healthy” retrace area; if ES flushes into this band on bad data then snaps back, it can still preserve the weekly uptrend. Failing here would start to threaten the bullish structure and invite a test toward the prior weekly low.
Support 4: 6,530–6,560
The 2.0 extension (~6,535) plus the weekly prior low / PML region. This is a major higher-timeframe floor. If ES ever gets here this week, the tape is likely under stress, but it also becomes the zone where large buyers usually test the waters for a bigger swing entry. A weekly close below ~6,530 would be the first real warning that the uptrend is morphing into something more corrective or even distributive.
Support 5 (deeper swing): 6,300–6,350
Older weekly demand and prior quarterly low / PQL area. Not a base case for this week, but important to note as the “catastrophic” downside magnet if something truly breaks (data shock, earnings disaster, geopolitical flare-up).
SETUPS – WEEK AHEAD IDEA PACK
1. Trend-pullback continuation long from support
Location: 6,650–6,670 primary, 6,595–6,610 secondary.
Trigger idea:
Look for an overnight or early-week sweep into 6,650–6,670 that quickly rejects (long lower wick on 1h / 4h, strong reclaim back above 6,680). Ideally, this happens outside the heaviest data windows so it’s more order-flow driven than headline noise.
If that fails and price drives into 6,595–6,610 instead, repeat the same logic there: washout, strong reaction, then a reclaim of 6,620–6,630 as confirmation that buyers stepped in.
Upside path from this setup:
First target is the 6,780–6,800 cap. If that gives way, next magnet is 6,840–6,880, then a possible extension run at the 6,900–6,930 recent high area. Later in the week, if macro tailwinds show up, this move can stretch toward 7,000 and, in an optimistic case, into the 7,100+ fib cluster.
Risk management conceptually:
From a swing perspective, the “line in the sand” for this idea is under 6,595. A clean daily close below that level would invalidate the shallow-pullback idea and suggest we are heading toward 6,530–6,560 or lower.
2. Short-term fade from the 6,840–6,880 / 6,900 pocket
Location: 6,840–6,880 first, 6,900–6,930 as extension.
Trigger idea:
If ES trades up into 6,840–6,880 ahead of Fed minutes or the Nvidia/Walmart prints and shows tired price action (long upper wicks on 15m/1h, loss of intraday momentum, failure to hold above 6,860), that area is attractive for a tactical short aiming back toward the 6,780–6,750 pivot.
A more aggressive fade is possible into 6,900–6,930 if the first test breaches 6,880 but immediately stalls at the prior high.
Downside path from this setup:
First magnet is the 6,780–6,800 band, then the balance base at 6,720–6,740. If that gives way on a macro shock, sellers can push for a retest of 6,650–6,670.
Risk management conceptually:
For shorts initiated at 6,840–6,880, a protective stop makes sense above 6,910–6,920. Fades taken into a full sweep of 6,900–6,930 should respect a hard stop above ~6,950; above that, risk of a proper breakout toward 7,000+ increases sharply.
3. Range-trade scalps inside 6,720–6,780
While ES is stuck inside this intraday box, there is room for mean-reversion trades: buying dips into 6,720–6,730 and selling pushes into 6,770–6,780 with tight intraday stops. This is a lower-quality idea compared to the bigger levels, but it’s relevant if Monday and early Tuesday stay choppy while everyone waits for the meat of the calendar mid-week.
Gold continuation patternHere's exactly my idea, confirm it before you enter a trade! daily and 3H timeframe gaps. recommended to hit that gap only before it retraces back to 3600-3700 or above zone again.
Wait for that entry buy zone again. Or if you want to short this idea. look on 3H swept.
Chart is on daily. we might see 4180-4200, that's my short zone!
If you're having a good thoughts comment yours. this is a free community. Been dealing this moves. It's my base fibonacci level 1.61 above/retrace! before the price continues higher.
Follow for more. Watch only my zones entry buy/sell , Long/short! choose wisely.
To invest in my idea direct/private me here! with 70-30 split profit!

ES (SPX, SPY) Analysis, Levels, Setups for Wed (Nov 12)Price closed near the prior week’s highs after a clear four-hour impulsive leg from last Friday’s low. Momentum appears constructive while the 15-minute swing structure holds higher lows above the New York value shelf.
Setups:
Play A — Acceptance Long: Wait for a 15m full-body close ≥6,900 and a 5m pullback that holds ≥6,892–6,895. Enter on a 1m HL reclaim. Hard SL = 15m trigger-wick low minus 0.25–0.50. TP1 6,915. TP2 6,935. TP3 6,955–6,975. Viability gate: TP1 must be ≥2.0R versus the 15m stop.
Play B — Rejection Fade: If 6,900–6,915 rejects with a 15m close back inside ≤6,889, enter on a 5m re-close lower and a 1m LH. Hard SL = 6,905–6,912 (above rejection wick). TP1 6,872. TP2 6,852. TP3 6,839→6,810 if momentum accelerates.
Bias & Invalidation: Bias is mildly bullish while 6,865–6,872 holds on 15m closes. Bias flips neutral-to-bearish on decisive 15m body-through below 6,839.
Kill-Zones (ET): NY AM 09:30–11:00 for entries. Manage through Lunch. NY PM 13:30–16:00 for follow-through or fades into exhaustion.
News & Events (tomorrow): No CPI risk on the docket. Watch the U.S. 10-Year Note auction around 13:00 ET and headline risk from the OPEC and IEA monthly oil reports in the morning; both can sway rates and index tone.

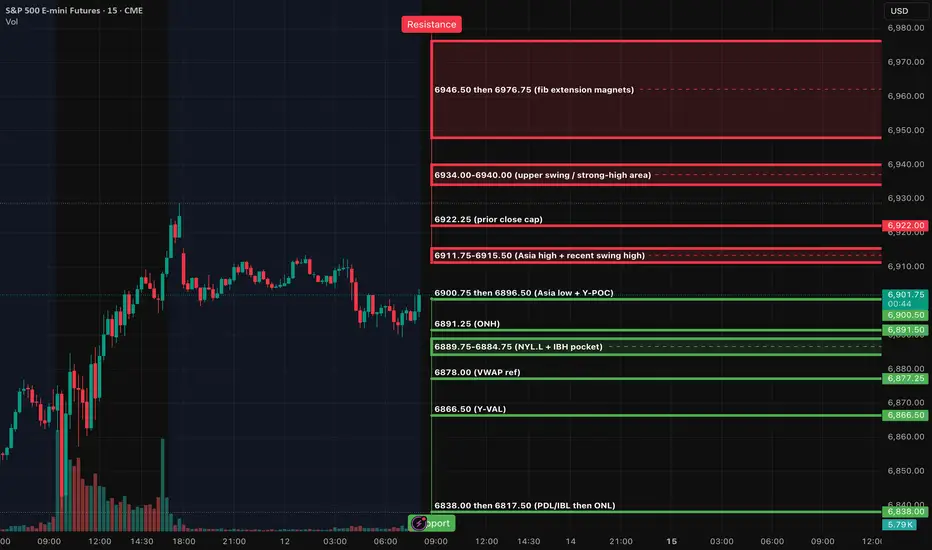
ES (SPX, SPY) Analysis, Key Levels, Setups for (Nov 11th)S (Dec) Plan for Tue, Nov 11 — Level-KZ Protocol (15/5/1).
Bias is constructive while trading above the 6,838–6,845 range; the first test into 6,880–6,900 serves as a decision point. Thinner liquidity is expected around the U.S. holiday, so execute trades only within NY kill zones.
Setups (trade the level → next level; 15m→5m→1m sequence)
Long — Bounce at 6,838–6,845: sweep/quick-reclaim → 5m re-close → 1m HL entry. Hard SL below 6,830 wick. TP1 6,872–6,880, TP2 6,900, TP3 6,930. Viability gate: TP1 ≥ 2.0R.
Long — Acceptance above 6,900: full 15m body close >6,900 → hold the retest → 1m HL. SL below trigger wick. TP1 6,930, TP2 6,955–6,970, runner eyes weak-high cleanup.
Short — Rejection fade 6,900–6,930: wick through → 15m close back below 6,895 → 5m LH. SL above session high. TP1 6,872, TP2 6,845, TP3 6,805; lose 6,805 and momentum can slide toward 6,770 then 6,733.
News & session conditions (ET)
U.S. Veterans Day — equities open; U.S. bond market closed; U.S. macro slate is light. Overnight focus: NZ inflation expectations (evening ET), U.K. Labour Market (pre-London), Germany ZEW (pre-NY). Expect patchy liquidity around the holiday; be strict with the 2R viability gate and trade only inside NY AM/PM kill-zones.

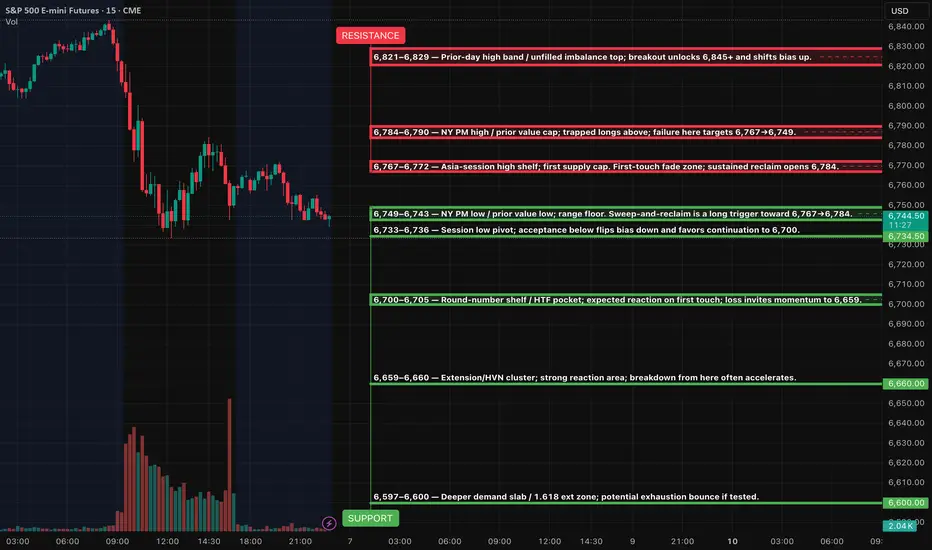
ES (SPX, SPY) Key Levels, Analysis and Setups for Fri (Oct 7th)EVENTS (ET, unaffected by shutdown): 3:00am NY Fed Williams speech; 7:00am Fed Vice Chair Jefferson speech; 10:00am Univ. of Michigan Consumer Sentiment (prelim); 2:00pm Fed G.19 Consumer Credit. Employment Situation report is postponed due to the shutdown (treat as no 8:30am print).
SETUPS (Level-KZ Protocol 15m→5m→1m)
ES LONG (A++) — 6,767 reclaim → 6,784 → 6,821
Entry: 6,768–6,772 after a 5m close and hold above 6,767 with 1m HL confirmation.
Hard SL: 6,755.
TP1: 6,784. TP2: 6,821. TP3: 6,845 if momentum persists.
ES SHORT (A++) — 6,784–6,790 pop-and-fail → 6,749 → 6,733
Entry: 6,782–6,789 on a 15m rejection close back inside the band followed by a 5m re-close down.
Hard SL: 6,796.
TP1: 6,767. TP2: 6,749. TP3: 6,733.
ES LONG (A+ Bounce) — 6,742–6,749 sweep & instant reclaim → 6,767 → 6,784
Entry: 6,750–6,753 after a swift reclaim and 1m HL.
Hard SL: 6,740.
TP1: 6,767. TP2: 6,784. TP3: 6,821.
ES SHORT (A+ Continuation) — 6,733 breakdown & retest → 6,700 → 6,659
Entry: 6,732–6,728 on 15m acceptance below 6,733 and a 5m LH retest.
Hard SL: 6,744.
TP1: 6,700. TP2: 6,659. TP3: 6,597.
KILL-ZONES & MANAGEMENT
Asia 20:00–00:00 optional and lighter size, London 02:00–05:00 optional, NY AM 09:30–11:00 primary for entries, Lunch 12:00–13:00 manage only, NY PM 13:30–16:00 allows second push or reversal plays. Daily guardrails: stop at −2R net or lock in ≥+3R net.