Growth up to 200% according to NFPTo date, the market continues to move exactly according to the scenario that I outlined in the last review. On Monday and Tuesday, the probability of a flat with sales attempts prevails, but from the middle of the week I expect the bullish trend to continue as part of a pullback on the annual candle and seasonal growth with an attempt to consolidate in the range of 3250-3500 ETH.
This week, NFP and SHELL reached medium-term supports, which I am now taking into account to work alongside TURTLE NTRN MITO VIC ENSO HOOK BMT. At the moment, 50% of tokens are already in circulation with further smooth unlocking, which will put minimal pressure on the price. In the future, the area for reliable scalping will shift slightly next year. For this instrument, there are long-term technical signals for growth up to 0.35-45, that is, 10X+. However, with the current bear market, we can still expect an attempt to retest the 0.060-75 range with a further pullback and resumption of growth in a new annual candle, which can already bring up to 150% profit. The intermediate resistance is the 0.05 level. If the daily or weekly candle opens higher, an active continuation of growth is likely. The opening of the second half of the month above this level will also be a signal for support.
Shell

Shell PLC Breaks Out and Retests Key Support After LNG RulingShell has been thrust back into the spotlight after an International Chamber of Commerce arbitration panel ordered the company to pay Venture Global’s legal fees in an LNG supply dispute. The ruling follows Shell’s earlier loss in a case centered on Venture Global’s failure to deliver contracted LNG cargoes while selling into the spot market during the price surge triggered by Russia’s 2022 invasion of Ukraine. Although the fee amount remains undisclosed, Venture Global stated it will direct the funds toward coastal restoration projects in Louisiana. Shell is appealing the decision in the New York Supreme Court, mirroring a similar challenge by BP after it also lost an LNG arbitration worth more than $1 billion.
Fundamentally, Shell’s legal setback underscores the complexity of LNG contract structures and the high-stakes nature of supply obligations during volatile markets. Despite this, Shell remains one of the strongest integrated oil and gas companies globally, supported by consistent cash flow, disciplined capital spending, and a growing pivot toward LNG, which remains central to its long-term energy strategy. While the legal outcome introduces short-term uncertainty, Shell’s diversified operating base and strong balance sheet soften the potential financial impact. The broader LNG market remains tight, and long-term demand projections favor established suppliers like Shell.
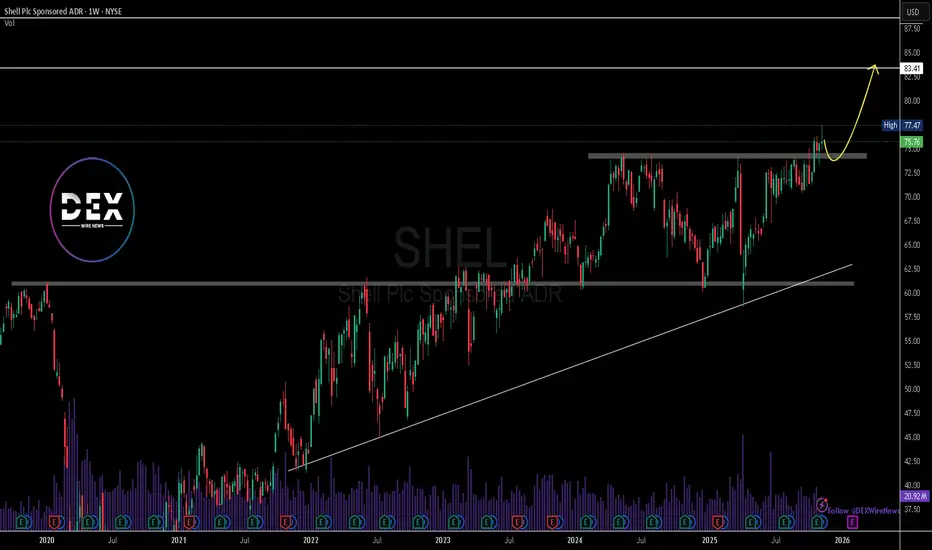
Technically, Shell’s chart is showing strength. Price has broken above a key multi-year resistance zone around $74–$75, completing a clean breakout pattern. The stock has respected a rising trendline since 2021, signaling steady long-term bullish structure. With momentum building above resistance, the next potential upside target aligns with the $82–$85 zone. A successful retest of the breakout area could confirm continuation. If price slips back into the range, support sits at $70 and deeper support around $62. Overall, bullish bias remains intact.
SHELL/USDT — at the Critical Zone: Breakout or Deadly Rejection?The price of SHELL is currently walking on a tightrope — right at the confluence between the key support zone of 0.120–0.108 and the descending trendline that has been suppressing every bullish attempt for months.
The chart now enters a make-or-break phase where the next major direction will soon be decided.
---
Technical Structure Overview
The current setup forms a Descending Triangle Pattern, where:
The horizontal base (yellow zone) acts as the last line of defense for buyers,
While the descending trendline serves as the main wall for sellers.
In recent months, every breakout attempt has been rejected from this trendline — but this time, momentum looks stronger, and volume is starting to build up.
---
Bullish Scenario
If the price breaks and closes above 0.142 with strong volume confirmation:
The descending triangle could invalidate and turn into a bullish breakout reversal,
Upside targets will likely be at:
0.185 → 0.205 → 0.226 → 0.260 → 0.330,
Such a move may signal the start of a medium-term trend reversal, especially if the broader crypto market gains strength.
Main confirmation: a daily close above 0.142 followed by a successful retest of the breakout zone as new support.
---
Bearish Scenario
However, if momentum fails and the price gets rejected from the trendline and then breaks below 0.108,
The descending triangle will confirm as a bearish continuation pattern,
The next downside target sits around 0.085–0.075, the previous demand area.
Losing 0.108 support may trigger a panic sell and extend the bearish cycle significantly.
---
Key Takeaway
The 0.120–0.108 zone is the lifeline for buyers right now.
A breakout above it could reshape the entire medium-term structure,
while a breakdown below it could open the path for a deeper selloff.
Moments like this are often golden opportunities for technical traders — where the risk is tightly controlled, but the reward potential is substantial if confirmation appears.
---
Conclusion
SHELL stands at the final equilibrium between buyers and sellers.
The longer price stays under the descending trendline, the more pressure builds up for a decisive move.
Once the breakout or breakdown happens, a volatility expansion is inevitable.
The key is simple:
Watch the daily close, monitor the volume, and follow the confirmation.
#SHELLUSDT #CryptoAnalysis #BreakoutZone #TechnicalAnalysis #DescendingTriangle #CryptoSetup #PriceAction #SupportResistance #TrendReversal #CryptoTrader #ChartOfTheDay

SHELLUSDT UPDATE#SHELL
UPDATE
SHELL Technical Setup
Pattern: Bullish Falling Wedge
Current Price: $0.110
Target Price: $0.253
Target % Gain: 130.62%
EURONEXT:SHELL is breaking out of a bullish falling wedge pattern on the 1D timeframe. Current price is $0.110 with a target near $0.253, offering a potential upside of over 130%. The breakout suggests renewed bullish momentum and possible continuation toward higher levels.
Time Frame: 1D
Risk Management Tip: Always use proper risk management.

SHELLUSDT UPDATE#SHELL
UPDATE
SHELL Technical Setup
Pattern: Bullish Falling Wedge
Current Price: $0.096
Target Price: $0.138
Target % Gain: 46.30%
EURONEXT:SHELL is breaking out of a bullish falling wedge pattern on the 4H timeframe. Current price is $0.096 with a target near $0.138, indicating about 46% potential upside. The breakout confirms bullish strength with potential for further continuation.
Time Frame: 4H
Risk Management Tip: Always use proper risk management.

SHELLUSDT Forming Falling WedgeSHELLUSDT is currently forming a falling wedge pattern, a classic bullish reversal structure that often signals the end of a downtrend and the beginning of a new upward move. This technical setup reflects a period of market compression where selling pressure weakens while buyers gradually gain strength. As the price tightens near the wedge’s apex, traders are anticipating a breakout that could mark the start of a significant bullish trend in the coming days.
The trading volume remains strong, indicating active participation and growing interest among traders and investors. A volume surge accompanying a breakout from this pattern would be a powerful confirmation of bullish momentum. With an expected gain of around 140% to 150%+, SHELLUSDT is attracting attention as a high-potential opportunity in the altcoin market. The technical structure aligns well with broader market sentiment, hinting at possible price acceleration once resistance levels are breached.
Investors are showing renewed confidence in SHELL’s fundamentals and market positioning, further supporting the technical outlook. As accumulation continues and confidence builds, SHELLUSDT could experience a strong rally phase, potentially outperforming many peers in the near term. The combination of bullish pattern formation, healthy volume, and investor interest positions SHELLUSDT as one to watch for traders looking for dynamic breakout opportunities.
✅ Show your support by hitting the like button and
✅ Leaving a comment below! (What is You opinion about this Coin)
Your feedback and engagement keep me inspired to share more insightful market analysis with you!

SHELL/USDT — Reclaiming Key Zone, Potential BreakoutThe best DCA coin of the moment for the low cap
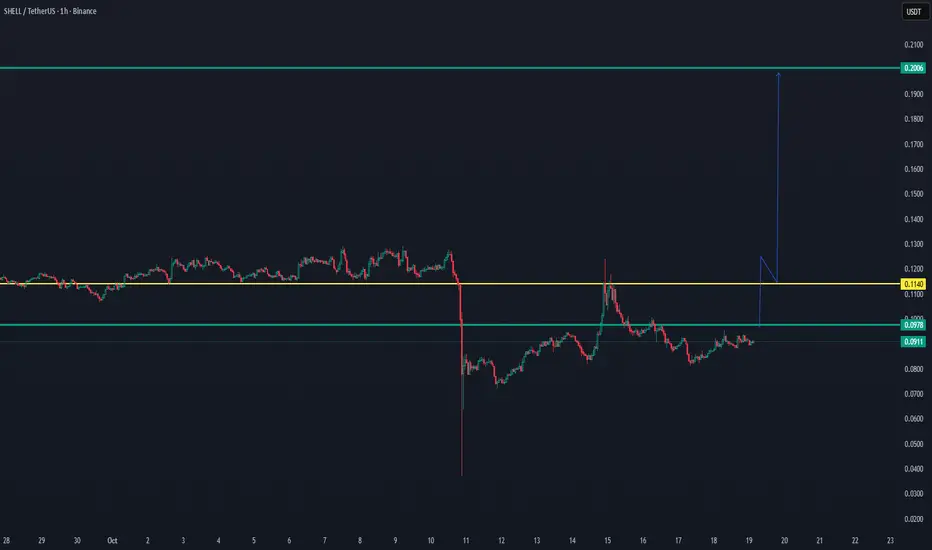
SHELL/USDT — Reclaiming Key Zone, Potential Breakout Toward $0.20 🚀
SHELL is currently building momentum near the $0.097–$0.100 zone, after reclaiming short-term structure from its recent drop. This consolidation indicates accumulation, setting the stage for a potential breakout move.
The $0.114 zone remains the key breakout level — a 1H close above it could confirm continuation toward the $0.20 target, aligning with the next major resistance area.
📊 Technical Overview:
Support: $0.090
Breakout Level: $0.114
Main Target: $0.200
Momentum: Recovering with early bullish signals
Once the price confirms above $0.114 with strength, the chart opens a wide “open space” toward the next resistance at $0.20, creating strong potential for a trend expansion.
📈 Bias: Bullish setup forming
🎯 Targets: $0.114 → $0.200
THE MAIN TREND LEVEL IS THE REASON OF BREAKOUT BLESSWe previously identified the key main rend level, which is the reason for today’s breakout. We can learn a lot from this coin and apply the same analysis to other coins, such as Shell:USDT.
Since the breakout is a risk management.
Shell:USDT is our next follow which can show also a breakout soon

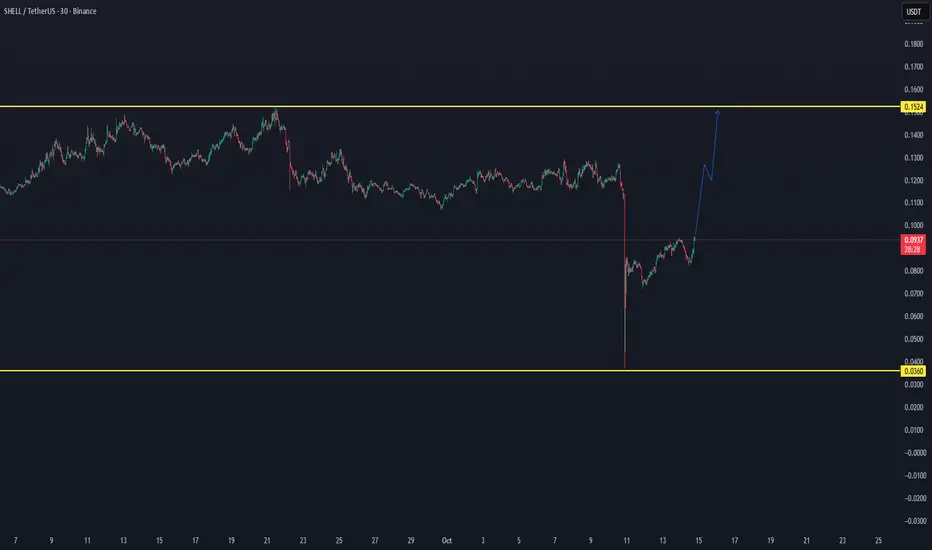
SHELL/USDT — Breakout Setup Building, Eyes on $0.1524SHELL/USDT — Breakout Setup Building, Eyes on $0.1524 🚀
SHELL has formed a clear bottom structure and is now showing early signs of trend recovery after a sharp correction. The price is currently reclaiming strength above the $0.09 level, suggesting a potential shift in short-term momentum.
📊 Technical Overview:
Support zone: $0.0360
Current price: $0.093
Breakout target: $0.1524
A breakout above $0.10–$0.11 could confirm a new upward phase, opening the path toward the $0.1524 zone, which acts as the next significant resistance level.
Momentum indicators and price structure indicate that buyers are gradually stepping in — pointing to a possible continuation move if volume supports the trend.
📈 Bias: Bullish setup forming
🎯 Targets: $0.115 → $0.1524
🕓 Watch for confirmation: A 4H close above $0.10
SHELL/USDT — Demand Zone: Accumulation or Final Breakdown?
SHELL is currently sitting at a critical support zone between 0.106–0.122 USDT, a region that has acted as a strong base since May. Each time price dips into this yellow zone, buyers have stepped in to absorb the selling pressure — marking it as a battlefield between bulls and bears.
However, sellers are still dominating the broader structure. The series of lower highs since August forms a clear descending triangle pattern, typically bearish — yet, in some cases, such formations become hidden accumulation zones once buying volume quietly starts building near the support.
---
Key Levels
Main Support Zone: 0.106–0.122 (highlighted in yellow — critical buyer defense)
Immediate Resistance: 0.1518 (first breakout trigger)
Next Resistance Levels: 0.1836 → 0.2047 → 0.2275 → 0.26
Major Resistance Targets: 0.33 and 0.59
Current Price: ≈ 0.1214 USDT
---
Market Structure
The current setup forms a descending triangle, defined by constant support and descending highs — a sign of ongoing bearish pressure.
Yet, if the support continues to hold and the market begins to form higher lows, this could shift into a reversal base, signaling the start of a potential trend recovery toward 0.18–0.20 USDT.
But if price breaks below 0.1058 with conviction, it may trigger a capitulation wave, driving SHELL down toward 0.06–0.08 USDT.
---
Bullish Scenario
Bullish confirmation checklist:
1. Price continues to hold above 0.106–0.122.
2. A daily close above 0.1518 with strong buying volume.
3. Successful retest of 0.1518 as new support.
Bullish targets:
0.1518 → 0.1836 → 0.2047 → 0.2275 → 0.26
Potential upside: +25% to +114% from current levels.
Bullish narrative:
If buyers manage to defend this zone, it could represent a final accumulation phase before a larger reversal. This structure often reflects where smart money starts positioning quietly before a trend shift.
---
Bearish Scenario
Bearish confirmation checklist:
1. A daily close below 0.1058 (confirmed breakdown).
2. Failed retest of previous support (turns into resistance).
3. Increasing sell volume confirming momentum continuation.
Downside projection (measured move):
Height of triangle ≈ 0.046 → Breakdown target ≈ 0.0598 USDT.
Potential drop: ~50% from current price.
Bearish narrative:
If the 0.106 zone collapses, buyers lose control. This could trigger a panic-sell phase, clearing out weak hands before the market finds its true bottom.
---
Strategic Takeaway
SHELL is at a make-or-break point:
Hold the zone: Possible start of a new accumulation and recovery.
Lose the zone: Likely continuation of the downtrend with deeper correction.
Aggressive traders may look for entries near support with tight stops below 0.1058.
Conservative traders can wait for confirmation above 0.1518 before taking a position.
Watch for volume spikes and daily closes — they’ll reveal whether this is the beginning of a new bullish cycle or a final breakdown before capitulation.
---
#SHELL #SHELLUSDT #CryptoAnalysis #SupportResistance #DescendingTriangle #Breakout #AltcoinSetup #CryptoChart #TechnicalAnalysis
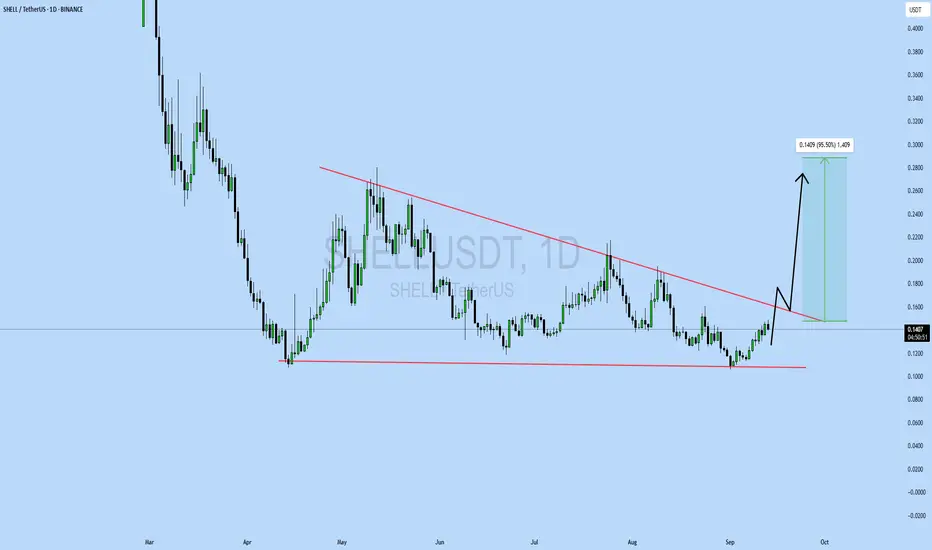
SHELLUSDT Forming Falling Wedge#SHELL
UPDATE
SHELL Technical Setup
Pattern : Bullish Falling Wedge Pattern
Current Price: $0.1407
Target Price: $0.2800
Target % Gain: 95.50%
Technical Analysis: SHELL is trading in a bullish falling wedge on the daily timeframe and is testing trendline resistance. A breakout above $0.16 would confirm strong upside momentum toward $0.28, supported by accumulation and wedge structure.
Time Frame: 1D
Risk Management Tip: Always use proper risk management.
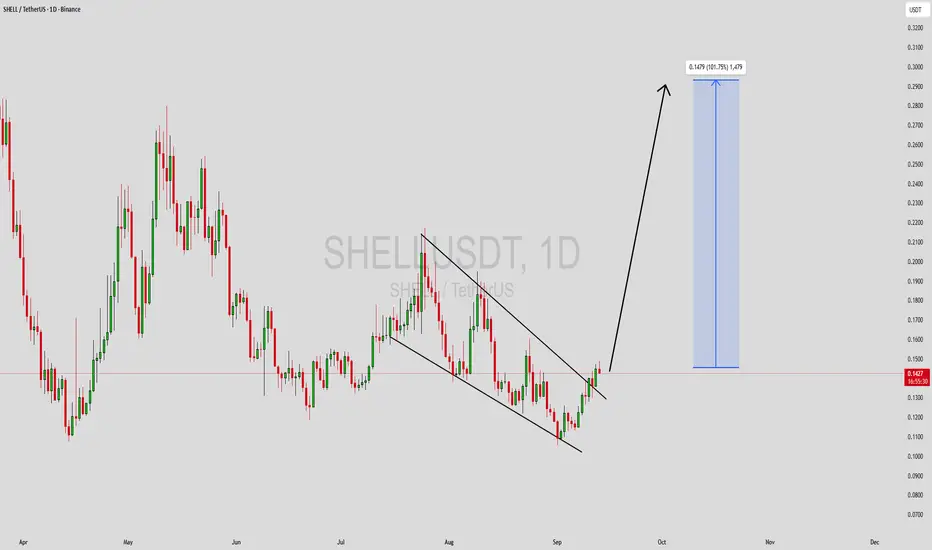
SHELLUSDT Forming Falling WedgeSHELLUSDT is showing a strong technical setup with the formation of a falling wedge pattern, which is historically considered a bullish reversal signal. The price has been consolidating within the wedge while maintaining steady volume, suggesting accumulation and growing investor interest. Once the breakout is confirmed, momentum could drive prices sharply higher.
The falling wedge structure indicates that sellers are losing strength while buyers are gradually stepping in. With the volume profile supporting this move, a breakout above the resistance line could spark a rally and attract more traders into the market. This setup is further strengthened by investors’ positive sentiment around the project, fueling expectations of strong upside potential.
With a projected gain of 90% to 100%+, SHELLUSDT presents a promising opportunity for both short-term traders and long-term investors. If bullish momentum continues, the breakout could trigger significant price appreciation and establish new higher levels of support in the coming sessions.
✅ Show your support by hitting the like button and
✅ Leaving a comment below! (What is You opinion about this Coin)
Your feedback and engagement keep me inspired to share more insightful market analysis with you!

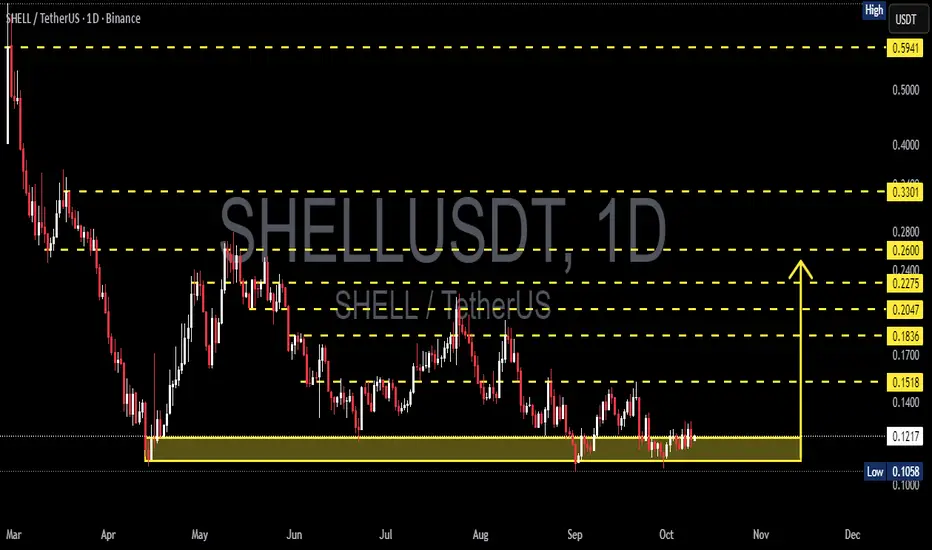
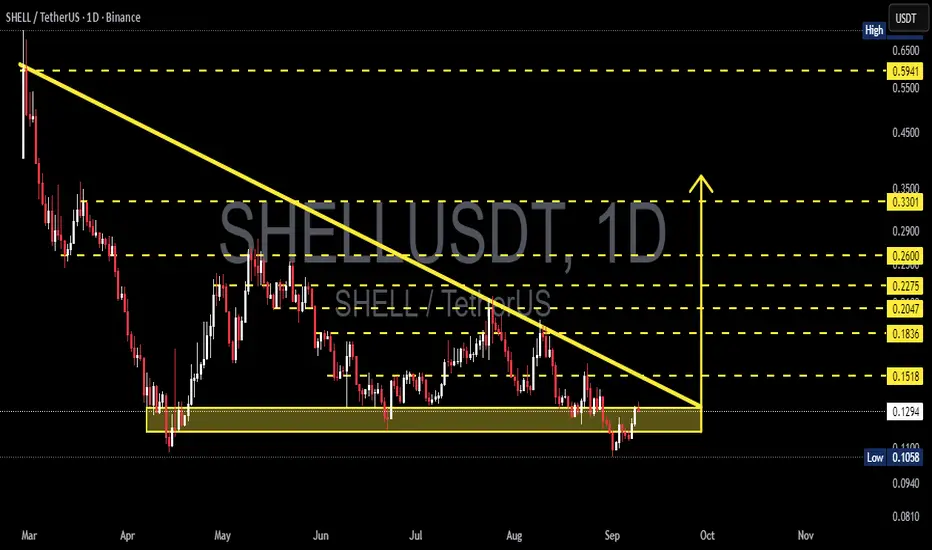
SHELL/USDT — Decision Point at the Edge of Descending TriangleCurrently, SHELL/USDT (1D) is at a critical stage after a prolonged downtrend since March. The chart clearly shows a Descending Triangle pattern, with strong support around 0.1058 – 0.1350.
Each time price dips into this zone, buyers step in for a rebound — yet sellers consistently push lower highs, forming a descending trendline. This signals the market is in a consolidation phase before a major decision: either a breakout to the upside or a breakdown to the downside.
---
🔎 Pattern and Chart Structure
Main pattern: Descending Triangle (default bias = bearish).
Strong support: 0.1058 – 0.1350 (demand zone, tested multiple times).
Dynamic resistance: Descending trendline (~0.1518 now).
Key levels to watch:
Resistance: 0.1836 → 0.2047 → 0.2275 → 0.2600 → 0.3301 → 0.5941.
Support: 0.0940 → 0.0810 (if breakdown).
---
🚀 Bullish Scenario
Bullish momentum may emerge if there’s a daily close above 0.1518 with strong volume, signaling buyers breaking through the descending pressure.
Initial target: 0.1836.
Mid targets: 0.2047 – 0.2275.
Extended targets: 0.2600 → 0.3301 → potentially 0.5941 if momentum accelerates.
Strategy: Enter after breakout confirmation, stop loss below 0.1300 or below 0.1058 for full invalidation.
---
🐻 Bearish Scenario
If price fails at the trendline and instead breaks down below 0.1058 on a daily close, the descending triangle plays out as a bearish continuation.
First target: 0.0940.
Next target: 0.0810.
Strategy: Enter short/re-entry on breakdown, with stop loss above 0.1200–0.1300.
---
📌 Conclusion: “Decision Zone”
SHELL/USDT is at a critical decision zone. Buyers are defending support, while sellers continue pressing down with lower highs.
Breakout above trendline → potential trend reversal.
Breakdown below support → bearish continuation.
Traders should avoid FOMO and wait for clear confirmation (breakout or breakdown). Risk management is essential: use stop loss and proper position sizing.
---
#SHELL #SHELLUSDT #Crypto #TechnicalAnalysis #SupportResistance #Breakout #DescendingTriangle #CryptoTrading

SHELLUSDT —Accumulation Phase or Breakdown?📌 Overall Chart Overview
Currently, SHELLUSDT is trading within a Descending Triangle pattern on the daily timeframe. This structure is characterized by lower highs pressing down through a descending trendline, while the bottom side is being defended by a strong demand zone at 0.13 – 0.15 (yellow box).
This setup signals that the market is in a tug-of-war phase: sellers are consistently applying pressure, yet buyers are still holding the line at support. The outcome of this compression will likely lead to a major move in the coming weeks.
---
🔼 Bullish Scenario (Breakout)
If the price manages to close above 0.15 and break through the descending trendline:
It would confirm a bullish breakout, signaling the potential start of a short-term trend reversal.
Upside targets to watch:
T1: 0.2047 (minor resistance)
T2: 0.2275 – 0.2400 (supply zone)
T3: 0.2600 (psychological resistance)
Extension: 0.3301 (major level, opening the path toward 0.5941 in the mid-term).
A valid breakout usually comes with a surge in volume, so volume confirmation will be key.
---
🔽 Bearish Scenario (Breakdown)
On the other hand, if price fails to hold the 0.13 – 0.15 zone and we see a daily close below 0.13:
The Descending Triangle would be confirmed as a bearish continuation pattern.
Downside targets:
T1: 0.1200
T2: 0.1077 (previous major low)
Extension zone: 0.1000 – 0.0960 (psychological levels).
This would highlight seller dominance and potentially extend the downtrend further.
---
📊 Additional Insights
Volume & Momentum: Volume is currently flat, reflecting indecision. A spike in volume will likely be the early signal of a major move.
Sentiment: A breakout would turn this demand zone into a golden accumulation area for buyers. A breakdown, however, would act as a trap for weak longs.
Risk Management: Waiting for a daily candle close beyond 0.13–0.15 is the safest approach to avoid fakeouts.
---
✨ Conclusion
SHELLUSDT is at the apex of its Descending Triangle, and the 0.13 – 0.15 range is the critical battle zone. A breakout above 0.15 opens the door for a trend reversal toward 0.20 – 0.26, while a breakdown below 0.13 could drag price down to 0.1077 or even lower.
Traders should remain patient and wait for clear confirmation before committing to an aggressive position. The current market is in a “wait and see” phase, and a powerful move is likely coming soon. 🚀📉
#SHELLUSDT #CryptoAnalysis #Altcoin #PriceAction #TechnicalAnalysis #DescendingTriangle #SupportResistance #BullishBreakout #BearishBreakdown #CryptoTrading #RiskManagement

Trading Opportunity For ShellusdtTrading Setup:
A trading signal is seen in the SHELL/USDT pair (12h).
Traders can look for a breakout entry as price is approaching a key resistance level on the chart.
⬆️ Buy now or Buy on 0.1900
🛑 SL @ 0.1500
🔵 TP1 @ 0.2800
🔵 TP2 @ 0.4000
🔵 TP3 @ 0.5000
What are these signals based on?
Classical Technical Analysis
Price Action and Trendline Breakout
RSI, Moving Averages, Volume
Risk Warning
Trading crypto, futures, and CFDs involves a risk of loss. Please consider carefully if such trading is appropriate for you. Past performance is not indicative of future results.
If you liked our ideas, please support us with your 👍 and comments.
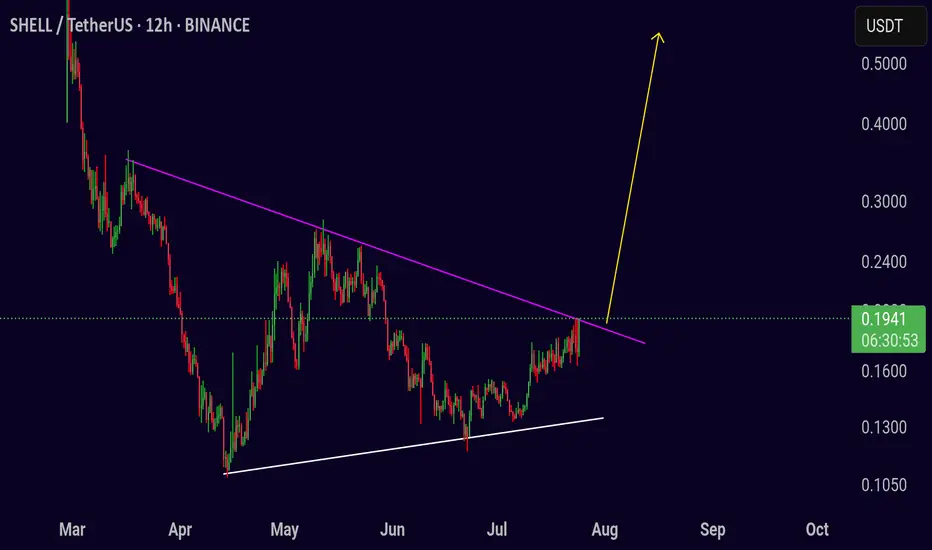
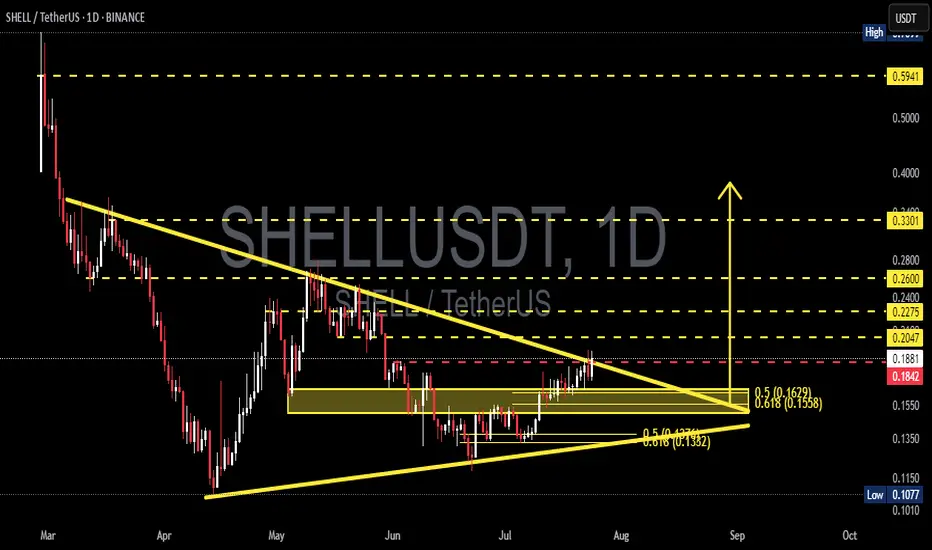
SHELLUSDT – Major Breakout Incoming? Time to Catch the Explosive🔍 Overview:
SHELL/USDT is approaching a critical breakout point after forming a large Symmetrical Triangle pattern since early May. Price has been coiling within this triangle, forming a tight squeeze between higher lows and descending resistance – a textbook setup for a high-volatility breakout.
This pattern is highly significant due to its large base structure and multiple confirmations from both trendlines, signaling that a big move may be imminent.
---
📐 Technical Pattern: Symmetrical Triangle + Fibonacci Cluster Support
The Symmetrical Triangle suggests market indecision between buyers and sellers, but pressure is building rapidly.
Strong Fibonacci confluence zone at:
0.5 @ $0.1629
0.618 @ $0.1558
This area acts as a major demand/support zone, having held firm multiple times.
The ascending support line from below shows gradual accumulation and strengthening buyer confidence.
---
🚀 Bullish Scenario (High Breakout Potential):
If price breaks above the descending triangle resistance, we could see a powerful move with clear upside targets:
✅ TP1: $0.2047 (minor local resistance)
✅ TP2: $0.2275 (previous rejection zone)
✅ TP3: $0.2400 (psychological level)
✅ TP4: $0.2600 (former supply zone)
✅ TP5: $0.3301 (measured move from triangle height)
✅ TP6: $0.5941 (long-term resistance)
📈 A confirmed breakout could trigger a mid-to-long-term trend reversal, especially if supported by volume and momentum.
---
📉 Bearish Scenario (Invalidation Risk):
On the flip side, if the price fails to break above and instead breaks below the triangle, then we might revisit key supports:
❌ Support 1: $0.1629 (Fib 0.5)
❌ Support 2: $0.1558 (Fib 0.618)
❌ Support 3: $0.1350 (previous consolidation zone)
❌ Support 4: $0.1077 (major swing low)
📉 A breakdown would negate the bullish triangle and could return price into an extended accumulation or downtrend phase.
---
🔥 Conclusion & Strategy:
SHELL is at the tip of the triangle, and a decisive move is expected soon. With volume gradually increasing and a healthy higher-low structure, all eyes are on whether it can break above resistance.
👉 For breakout traders: Watch for a close above the trendline with volume confirmation.
👉 For swing traders: The $0.1558 – $0.1629 range offers an ideal low-risk entry zone.
This breakout could mark the beginning of a strong reversal trend after months of decline. Don't miss this potential early entry opportunity!
---
📊 Key Levels Recap:
Strong Support Zone: $0.1629 – $0.1558
Breakout Trigger: ~$0.1842
Bullish Targets: $0.2047 → $0.2275 → $0.2400 → $0.2600 → $0.3301
Invalidation / Stop-Loss: Below $0.1558 (triangle breakdown)
---
📢 Final Note:
> "The bigger the base, the higher the breakout space."
SHELL is building a powerful base. If the breakout confirms, it could be the start of something big. Stay alert and prepare to ride the wave!
#SHELLUSDT #CryptoBreakout #AltcoinSetup #SymmetricalTriangle #FibonacciSupport #CryptoReversal #BullishChart #AltcoinWatchlist
MyShell Signals: Bottom Confirmed Rise ConfirmedWhat you see here is a big, classic, Adam & Eve bottom pattern.
First the rounded bottom followed by the pointed-bottom. And this reveals the market will change its trend coming from a classic signal.
What you see on this chart is a perfect falling wedge pattern (orange). This reveals an upcoming bullish breakout, the breakout leading to a new uptrend.
Then you can see a perfect higher low (purple trendline). Coupled with a reversal candle and continuation with a full green candle after the higher low, 22-June, is in. A strong combination of bullish signals but I can show you more.
The full green candle 23-June pushed SHELLUSDT daily above EMA8 and EMA13.
There was high volume 9-June. The highest volume day in months.
There is also a resistance baseline that was conquered around 0.1380. All bullish but still early. SHELLUSDT is still trading at bottom prices compared to what you will be seeing in a matter of months.
The RSI is trending up. Notice the same falling wedge pattern...
The MACD produced a bullish cross after a major higher low. This is all ultra, hyper bullish of course.
When so many bullish signals are combined together, it simply leaves no room for doubt; Crypto is going up.
MyShell is trading at bottom prices with many confirmed signals, soon to grow.
Thank you for reading.
Namaste.

Energy giants surge: Top 5 stocks to watchJune 2025 was marked by heightened volatility across the global energy sector . Amid fluctuating oil prices, geopolitical uncertainty, and ongoing industry transformation, major oil and gas companies delivered mixed results. Let’s break down the key drivers behind the moves in Shell, TotalEnergies, BP, Chevron, and Exxon Mobil.
Here are the five leaders that set the tone this June :
1. Shell: Steady growth driven by strategic adjustments . The stock climbed 7% thanks to a pragmatic dividend policy and a $3.5B share buyback plan. LNG Canada project developments also boosted investor confidence.
2. TotalEnergies: Strong performance backed by green energy push . Shares rose 5.5% after the acquisition of a renewable energy portfolio and a dividend increase. Conservative production forecast (+3% for 2025) and investment in clean energy kept demand strong.
3. BP: Recovery supported by oil price rebound . BP added around 7% on oil market stabilization and a new share buyback program. Although production declined due to asset sales, higher profitability in the oil segment offset the drop.
4. Chevron: Notable gains fueled by new projects . Chevron advanced 7.5% following the launch of the Ballymore field in the Gulf of Mexico. Expanded buyback and dividend plans further attracted investors.
5. Exxon Mobil : Stable upward momentum from production expansion. Shares jumped nearly 10% as Q1 profits reached $7.7B. Liquefied natural gas development and output growth targets energized traders.
FreshForex analysts believe the rally in energy majors may continue in the near term. Shell, TotalEnergies, BP, Chevron, and Exxon Mobil remain strong picks for active investors.

Possible x's on chessTo date, the market has reached the buying period of the second half of the week, which I outlined earlier. Against the background of extremely negative statistics for the United States over the past week and a half, ether sales were successfully repaid yesterday at the next bifurcation point, and purchases with an attempt to gain a foothold above 2100 will prevail until Sunday afternoon. Against this background, there is a new opportunity for altcoin mining.
First of all, I want to draw attention to chess, which has extremely high technical goals for retest up to $ 1 and can repeat the alpaca scenario with sufficient volatility. Today, there is a trend change and by the end of the week, the probability of a 0.1 level test prevails, which is necessary to increase volatility up to the 0.25 test. If the second half of the month opens above 0.1, we can expect the trend to continue until mid-June at least and the 0.25 test. Previously, large volumes of purchases were left for a hike above 0.25. Taking this level, in turn, opens the way up to 0.50-75, but this is probably the scenario for the fall. However, we should not rule out a sharp breakdown to 0.25 this week.
In addition to chess, I am primarily considering fio for work. Pivx adx and quick can also be considered for scalping, with possible growth waves of up to 40-60% for a local break of the last wave at least. These coins have fallen in price rather due to fears of another assignment of the monitoring tag and are highly undervalued relative to the current market position. Also this week, there is a high probability of a new bull run on fantokens with interruptions of up to 2-3. The most undervalued are the city atm acms, which I consider first.

Is Shell Ready to Break Through Key Resistance on Its 5th Try..?🚨 Shell's 5th Attempt to Break Resistance at 0.3380 🚨
Shell is currently testing the key resistance level of 0.3380 for the 5th time. 🔥 Here's what to watch for:
📈 Strategy:
Wait for a breakout on the 4-hour timeframe. If Shell sustains above **0.3380**, we could enter a long position on the retest.
🎯 Targets:
First target: 0.4000
Second target: 0.4500
Keep an eye on this level—could be a big move ahead! 🚀

shellIt's a good currency (just kidding) 😅🙈 But I'll buy it and let it come to the blue line. If it reaches that, of course.
