SHIB: breakout or dead cat bounce? key levels to watchSHIB. Still waiting for this dog to wake up or is it just pretending to be alive? Meme coins have cooled off again according to market chatter, with flows rotating back into majors while SHIB burns keep growing but price refuses to follow. That combo usually means only speculators are left in the game, not real trend buyers.
On the 4H chart price is stuck in a tight range around local support near 0.0000060 after a brutal downtrend, with a staircase of red supply zones right above. RSI is climbing from oversold but still under 50, so it looks more like a relief bounce than a reversal. Volume profile shows the real liquidity sitting slightly higher, so I expect a push up into the 0.0000066–0.0000070 zone first, then sellers to hit it again.
My base plan ✅ wait for price to spike into that supply, watch for rejection wicks and fading RSI, then look for shorts back to 0.0000055–0.0000050. If buyers suddenly punch through and we start closing 4H candles above 0.0000072 with decent volume, I’ll flip to a long idea toward the next red zone higher. I might be wrong, but for me SHIB still looks more like a dead cat bounce setup than the start of a new meme season.
Shib

1000SHIB Forming a Falling Wedge Structure1000SHIB is currently trading within a falling wedge pattern on the higher timeframe, defined by a series of lower highs and lower lows that are gradually converging. This structure reflects decreasing downside momentum, even though price remains under overall bearish pressure.
Price is now positioned close to the lower boundary of the falling wedge, an area that often acts as a short-term reaction zone. From here, the market may attempt to cover recent downside wicks or perform a brief liquidity sweep below support, which would still be consistent with the structure of the pattern.
As long as price continues to compress within the wedge, the focus remains on how it reacts around the lower trendline. A sustained defense of this area increases the probability of a mean reversion move toward the upper wedge resistance, while a clean breakdown and acceptance below the structure would invalidate the pattern and extend the broader downtrend.
At this stage, the market is still in a compression and decision-making phase, with confirmation only coming after a clear breakout from the wedge boundaries.

SHIBUSDT 1,045% profits potential with 5X leverage —LONG tradeBeyond any type of bullish signals and technical analysis, this is a 100% timing based chart setup. Shiba Inu is set to grow next, within days at max.
Here we have a double-bottom, late December vs the market flush. This double-bottom is a higher low compared to June 2023.
Shiba Inu has been bearish since March 2024. Now starts either a very strong bullish wave or an entire bullish cycle.
This bullish cycle, long-term growth, will still come with retraces and corrections, these are inevitable. But it grows long-term. This means that no new lows are possible... This is just speculation. The chart simply points higher short- to mid-term. Long-term, anything goes.
Shiba Inu is set to produce massive growth.
Full leveraged trade-numbers below:
_____
LONG SHIBUSDT
Leverage: 5X
Potential: 1045%
Allocation: 5%
Entry zone: $0.00000736 - $0.00000808
Targets:
1) $0.00000843
2) $0.00000938
3) $0.00001096
4) $0.00001351
5) $0.00001533
6) $0.00001765
7) $0.00002020
8) $0.00002434
Stop: Close weekly below $0.00000735
_____
Thanks a lot for your continued support.
Namaste.

shiba inu (SHIB)If Shiba Inu holds so much value, currently ~$5 billion, how come the chart is so lackluster for so many years? Developers spend too much money is my guess. When there is less development for a meme token, the token is more likely to do well, right? Because, if there is nothing happening behind the scenes, there is nothing to deplete the value of the tokens with no need to spend money, or so I'd like to think. Yet, there are always people who are also not in heavy development mode that still seem to spend their investment when the prices are high thus removing the potential long terms gains and future investors along the way.

SHIBA INU (SHIB) "current price < coinbase listing price" Shiba Inu proves to be predictably unsupported despite how popular it is for people to talk about their HODL and resistance to selling. The fact that so many people talked about buying Shiba Inu in the past four years and none of those holdings seem to prop up the price of Shiba Inu right now appears to prove meme tokens no matter how adapted and developed lose value faster than we realize. Tokens lose easier than Layer 1 blockchains. The interconnected value of layer 2 tokens means investing in a token will always offer more volatility. On the gains side there is an upside, on the other side that means greater percentages to impact the decline during a selling frenzy. Knowing the price of Shiba Inu is below the price of first listing to Coinbase, is it still worth it to invest time and money into a meme token in 2026 if the price does not carry a supportive value for the long term investment? Is trading cryptocurrency tokens only valuable for short term gains and short term positions?

SHIBUSDTWe are in correction at big short but should failed short and continue move price to high levels.
I wait for take trade with breakout 0.0000900 for buy and breakout 0.0000810 for short position.
CRYPTOCAP:PEPE KRAKEN:PEPEUSD BINANCE:PEPEUSDT

Is Friday May 1st 2026 is the Bottom of the Alt Market?Is History repeating itself?
Is 8 Month on Friday May 1. 2026 the next low in Alts?
Are we following the same setup as 2021?

SHIB approaching a key reversal zone inside a descending channelSHIB continues to move inside a clear descending channel that has been respected since mid October. Price is once again approaching the mid zone of the channel while holding above a short term support created by recent higher lows.
The structure is now offering two possible scenarios.
Bullish idea
A reclaim of the short term trendline resistance can trigger a recovery toward the upper boundary of the descending channel.
Important focus points:
• Price stability above the short term support
• Breakout of the diagonal resistance
• Room toward the liquidity cluster at 0.00000913
• A full channel rotation opens the path to 0.00001035
Bearish idea
Failure to hold the mid support area invites continuation inside the channel.
What to watch:
• Loss of the support zone
• Return toward 0.00000827 then 0.00000779
• Deeper liquidity around 0.00000755 at the channel bottom
This level is an important pivot inside the overall channel. SHIB is preparing for a directional decision and the next breakout or rejection should define the coming weeks.

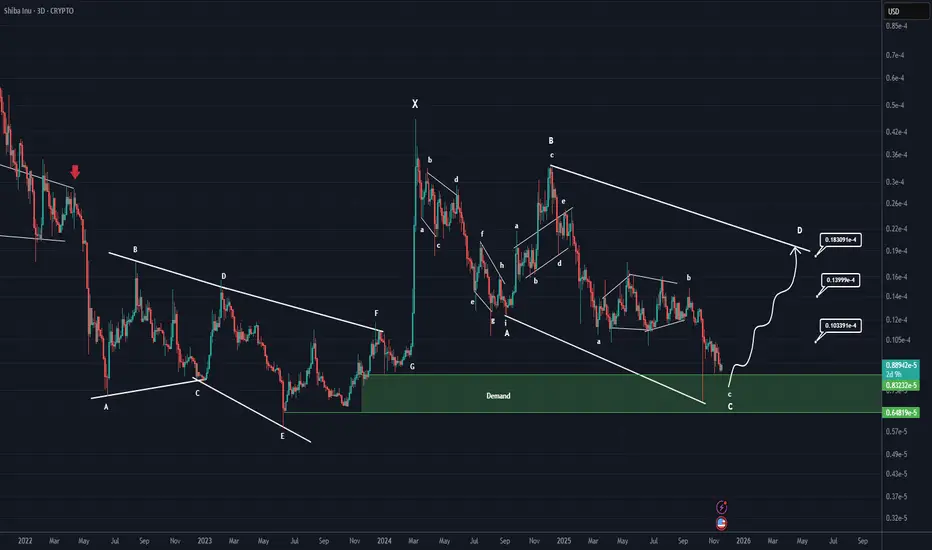
SHIBA Inu Analysis (3D)Shiba Inu is completing a very large correction across higher degrees and larger time frames.
It appears to be in a double or multiple correction, currently in the second phase. This phase itself is a complex correction, and it is now finishing wave C of this complex corrective structure.
The green zone is where Shiba can enter wave D in the higher time frames | a bullish wave.
Remember, we do not make decisions based on emotions; we analyze based on signals and indications.
For risk management, please don't forget stop loss and capital management
When we reach the first target, save some profit and then change the stop to entry
Comment if you have any questions
Thank You
SHIB/USDT — Critical Demand Zone: Reversal or Full Capitulation?SHIB is now revisiting the major demand zone at 0.000007–0.0000055, a level that has acted as the foundation of every major multi-month rally since 2021.
This zone is not just support — it is a psychological pivot that separates long-term accumulation from market capitulation.
Each historical touch of this zone has triggered strong bullish reactions, yet the current structure is different:
Weekly price action continues to print lower highs, signaling that institutional selling pressure remains active while buyer conviction has not yet shown dominance. SHIB is entering a transitional phase, where the next few weekly candles can redefine its macro direction.
---
Price Structure and Market Pattern
1. Descending Structure / Lower Highs
Indicates weakening long-term momentum and the need for strong confirmation before any sustainable bullish reversal.
2. Major Demand Zone (0.000007–0.0000055)
A multi-year accumulation area with repeated deep wicks and strong historical rejections, showing where large players have entered previously.
3. Layered Horizontal Supply Zones
Key resistance levels created by previous distribution phases:
0.0000107
0.0000160
0.0000326
0.0000667
4. Market Compression
The longer price compresses against this demand zone, the larger the eventual breakout impulse — in either direction.
---
Bullish Scenario: A Major Reversal Begins Here
Bullish confirmation requires:
1. A weekly close above 0.000007
2. A strong reversal candle (bullish engulfing, hammer with solid body)
3. Increasing buying volume
4. Early bullish divergence on RSI/MACD (weekly or daily)
If confirmed, upside levels open in stages:
Target 1: 0.0000107
Target 2: 0.0000160
Target 3: 0.0000326
Breaking above Target 3 would signal a potential macro trend shift, turning SHIB from long-term bearish to structurally bullish.
---
Bearish Scenario: Breakdown and Capitulation Phase
Bearish continuation is confirmed if:
1. Weekly close breaks below 0.0000055
2. Retest of 0.000007 fails to reclaim
3. Selling volume accelerates, showing loss of long-term accumulation interest
If this breakdown holds, price opens the door to deeper downside:
0.0000040
0.0000030
These levels represent historical liquidity pockets where capitulation tends to occur before larger players begin accumulating again.
---
Key Takeaway
SHIB is not just sitting at a support — it is testing the macro decision zone that will determine its long-term direction into 2026.
From a probability perspective:
Holding the 0.000007–0.0000055 zone = potential for a major swing rally
Losing it on a weekly close = activation of a deeper bearish leg
The upcoming weekly closures will define whether SHIB resets its long-term trend or enters a prolonged capitulation phase.
---
#SHIB #SHIBUSDT #CryptoAnalysis #MarketStructure #WeeklyChart #SupportZone #DemandZone #PriceAction #AltcoinAnalysis

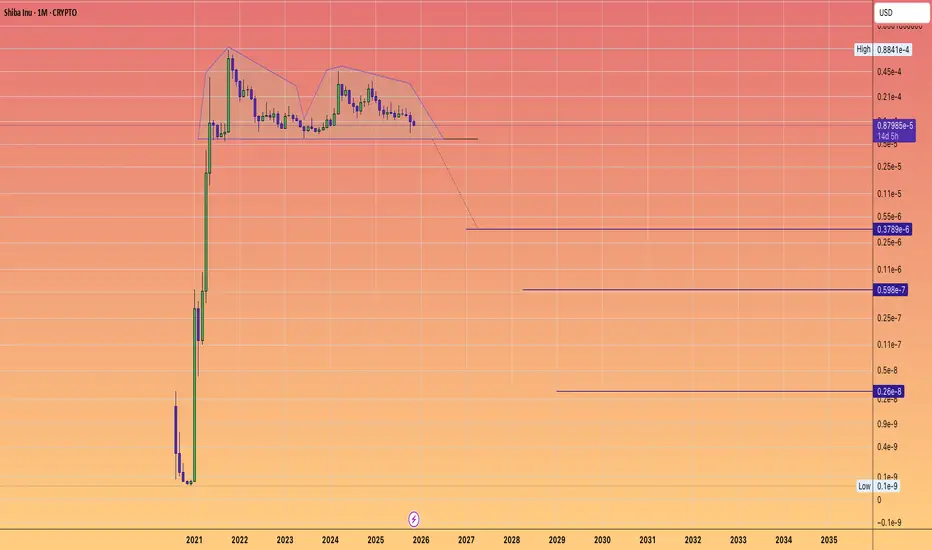
The most significant chart of inefficiency: SHIBA INUCould Shiba have created one of the most significant Double Tops in the history of assets?
Shib, along with a large portion of the Memecoin sector, is currently entering a crypto winter that COULD potentially reset nearly all tokens, coins, and memes lacking inherent utility, broad adoption, or significant social awareness.
Consider the 38 million coins that have been produced.
Which ones are truly necessary to you?
Which ones offer you real value or utility?
Which ones might be able to substitute certain elements of traditional finance?
A casino can certainly be entertaining.
But is living in a casino every day what you really want?
SHIBA's situation+next targets and expected movementsIt seems the price is forming a head and shoulders pattern, which, if correct, suggests a good price increase in the coming days. However, we should wait for the pattern to fully complete.
Best regards CobraVanguard.

Shib(based on NEo wave)this fox make everybody angry or disappointed.
but the story of this cute fox is in long term it can make up to 1000% profit.
for 1000% profit you need to buy it in the deepest price but I prefer to buy it step by step with demand zones and with post pattern confrimation.

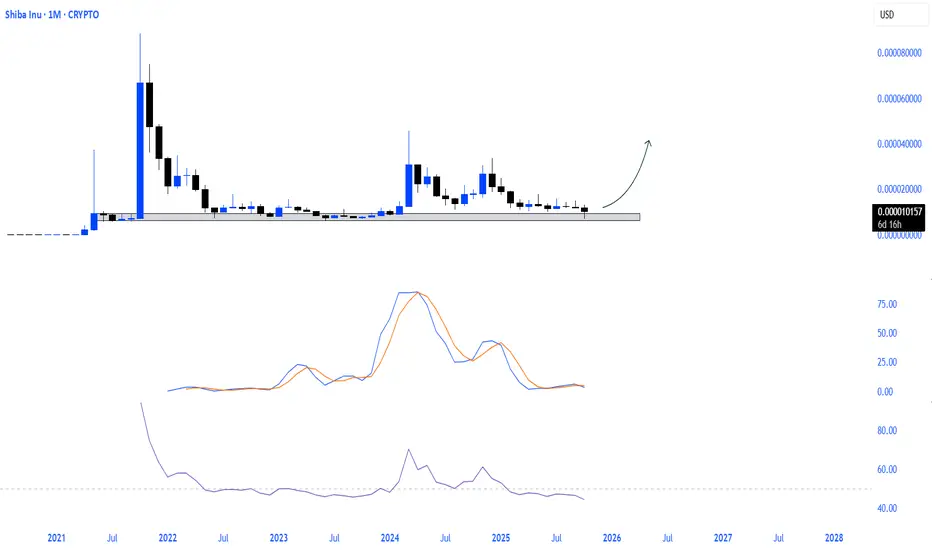
$SHIB the calm before the explode.Shiba Inu momentum is at historic lows.
The price is quietly gathering strength in a major demand zone.
This silence could be the sound of accumulation.
And every accumulation has its breakout.
More down before 150k. Buy zone targeted! COINBASE:BTCUSD If Bitcoin continues previous trends. The last 2 large rallies were preceded by 11-13% drops. We are only at 4% now. If this holds true, 100-98k is where we reverse to 150k.

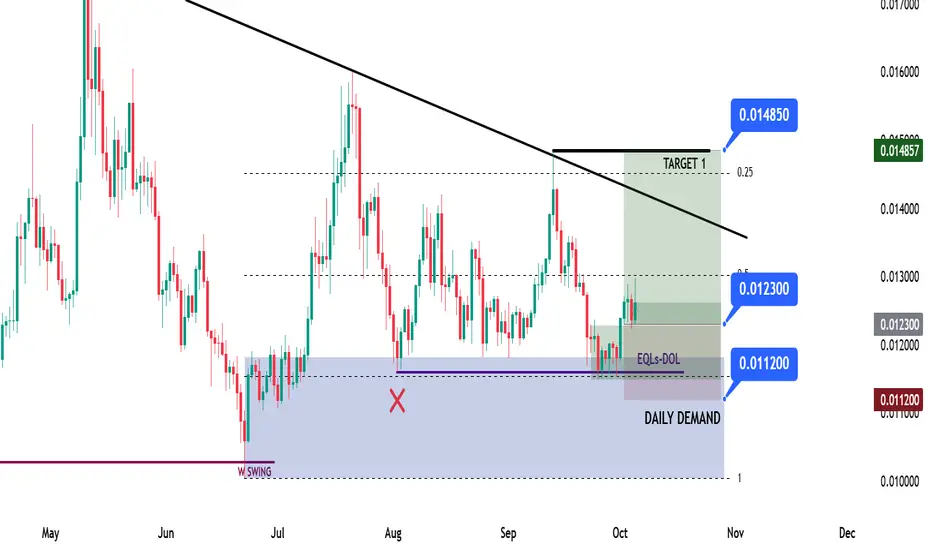
SHIB Long Idea - DLRMD Model SHIB Swing Long Opportunity - DLRMD MODEL
📊 Market Sentiment
FED has resumed its rate-cutting cycle, starting with a 0.25% cut in September, with two more expected. Institutional liquidity inflows have accelerated as the U.S. officially adopts crypto as part of its reserves. Despite elevated inflation, a weakening labor market is forcing the FED to ease, pushing more capital into risk-on assets.
📈 Technical Analysis
Price is in a higher time frame (HTF) bullish trend, so I’ll only be looking for longs.
Price swept the weekly swing liquidity, closed above, and broke the daily structure — forming a strong daily demand zone. The first tap to this zone generated a solid bullish reaction, confirming its validity.
Currently, price is rejecting from a bearish trendline after running previous liquidity. I assume price now has enough momentum to test and potentially break that trendline for the next leg higher.
📘 Model to be used – HTF Demand w/ Liquidity Run & Max Discount Zone (DLRMD Model)
1-Identify HTF trend direction and only trade in that direction.
2-Locate the HTF demand zone where price can find support and bounce.
3-Wait for LTF liquidity sweep to confirm energy for a reversal.
4- Use Fibonacci retracement to define the max discount zone (around 0.75 retracement).
5- Enter once price shows rejection or bounce confirmation.
📌 Game Plan
Entry already taken at $0.0123 from the retest of the daily demand + discount zone confluence.
I will hold the position until the bearish trendline and monitor for a breakout.
First target is the bearish trendline; once reached, stoploss will move to breakeven, and the rest will be managed toward the next liquidity level.
🎯 Setup Trigger
Setup is active now.
📋 Trade Management
Entry: $0.0123
Stoploss: $0.0112
Targets: TP1 = Bearish trendline | TP2 = $0.01485
💬 Like, follow, and comment if this breakdown supports your trading! More setups and insights coming soon stay connected!
⚠️ Disclaimer: This content is for informational and educational purposes only and does not constitute financial, investment, or trading advice. Always DYOR before making any financial decisions.

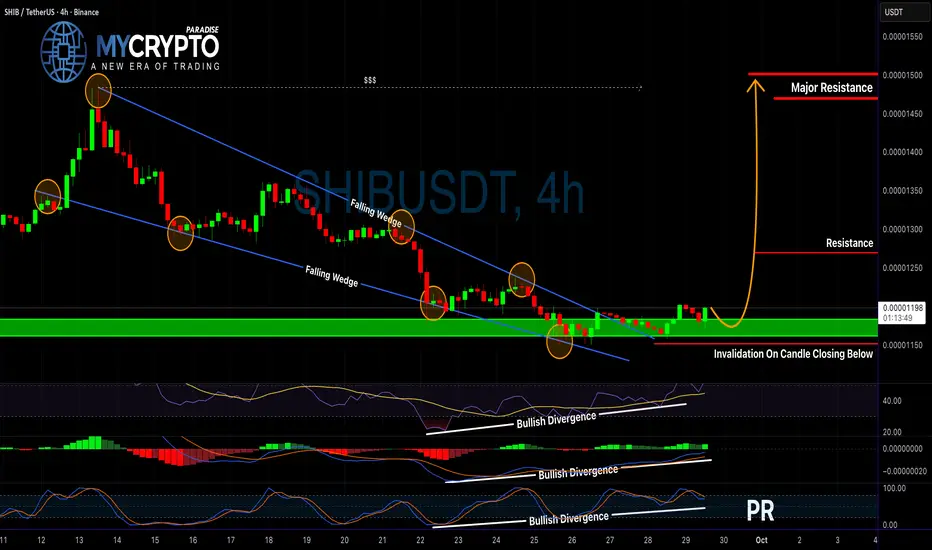
Is SHIB About to Explode or Collapse? Read Before It’s Too LateYello Paradisers! Are you paying attention to SHIB right now? Because this could either be the start of a massive bullish breakout — or the trap that wipes out impatient traders.
💎SHIBUSDT is showing strong potential after breaking out of a falling wedge pattern, which is a classic bullish reversal setup. What makes this move even more convincing is the presence of bullish divergence on the RSI, MACD, and Stochastic RSI — all of which are aligning to support a potential move to the upside.
💎From the current price level, after a proper retest of the support, the setup is still offering a favorable 1:2 risk-to-reward ratio, which is solid for short-term traders.
💎If you’re aiming for even larger risk-to-reward opportunities, you could wait for a more defined retest to enter with tighter risk parameters. However, this comes with the risk of missing the move entirely if the market doesn’t offer that second chance.
💎But here's the key — if the price breaks down and closes below the invalidation level, this entire bullish idea becomes invalid. In that case, it’s much smarter to step back and wait for cleaner price action and a higher-probability setup to form.
💎Discipline always beats impatience.
🎖Strive for consistency, not quick profits. Treat the market as a businessman, not as a gambler. That’s the only way to make it far in your crypto trading journey. Be a PRO.
MyCryptoParadise
iFeel the success🌴
SHIBUSDTBINANCE:SHIBUSDT is now in first reaction to uptrend. I wait for pullback to breakout.
Please control risk management.⚠️

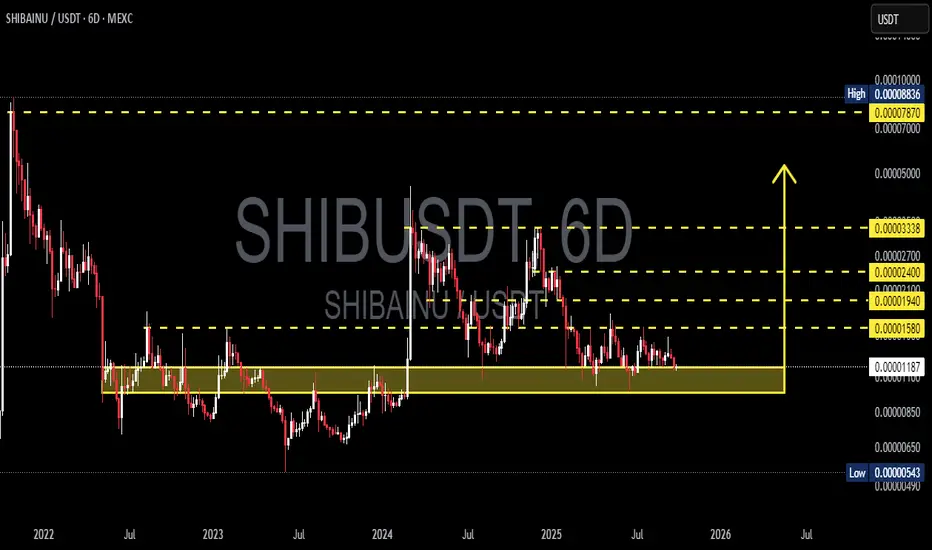
SHIBUSDT — A Major Move Will Be Decided From This Critical Zone!Overview
The 6D chart of SHIB/USDT shows a long-term consolidation that has been developing since 2022. Price is once again testing the key demand zone (0.00000850 – 0.00001183), an area that has acted as a strong support multiple times.
This zone is now a true “make or break level” — either SHIB rebounds for a major bullish wave, or it breaks down to much lower levels.
---
Structure & Price Pattern
1. Macro Downtrend
Since the ATH, SHIB has been printing lower highs, showing long-term seller dominance.
Yet, despite selling pressure, the demand zone has held — a sign that large buyers still exist here.
2. Extended Accumulation Zone
The yellow area (0.00000850 – 0.00001183) has acted as a base of accumulation since 2022.
Such prolonged consolidation often precedes explosive moves.
3. Clear Supply Levels
Resistance levels above price:
0.00001580 (initial breakout trigger)
0.00001940 → 0.00002400 → 0.00003338 (progressive bullish targets)
Major supply cluster at 0.00007870 – 0.00008836, which could be a magnet in case of a macro bullish reversal.
4. Volatility Contraction → Imminent Big Move
The 6D candles show a tightening range.
Classic signal of volatility compression, usually followed by a strong breakout or breakdown.
---
Bullish Scenario
Confirmation:
A breakout and 6D close above 0.00001580 with strong volume.
Targets:
0.00001940 → 0.00002400 → 0.00003338.
Ideal sequence:
Accumulation at support → breakout above resistance → retest as new support → rally continuation.
Reward potential: High risk-to-reward setup if the demand zone holds.
---
Bearish Scenario
Confirmation:
A breakdown below 0.00000850 with high volume.
Targets:
First: 0.00000543,
Then: potential new lows if liquidity is drained.
Risk:
If support fails, SHIB could enter a capitulation phase with accelerated downside.
---
Market Interpretation
Optimistic Buyers: See this as a long-term accumulation opportunity.
Cautious Sellers: A breakdown could trigger a steep sell-off.
Neutral Traders: Waiting for confirmed breakout/breakdown before committing larger positions.
---
Conclusion
SHIB is sitting at a critical zone that will define its macro direction into 2025–2026.
Holding support → opens path for multi-level rally.
Losing support → risk of deeper correction.
For long-term investors, this is the area to watch closely.
For swing traders, waiting for clear confirmation is the safer strategy.
---
#SHIB #SHIBUSDT #CryptoAnalysis #TechnicalAnalysis #SupportResistance #CryptoTrading #PriceAction #Accumulation #BreakoutSetup
SHIB Swing Long Idea - MemecoinSHIB Swing Long Idea
📊 Market Sentiment
Market sentiment remains strongly bullish as the FED is expected to deliver a 0.25% rate cut, with speculation building for a possible 0.5% cut in September. Monetary policy shifts are being driven by both inflation trends and weakening labor market data. The latest August and September job reports were soft, signaling that the economy is cooling rapidly. This environment continues to fuel expectations for a major bullish run in the weeks ahead.
📈 Technical Analysis
Price ran the HTF liquidity and got rejection from there.
Price created the Daily Demand after the run which confirms the price wants to seek higher liquidity.
Price made its first retest to Daily Demand and got rejection there, indicating that Daily Demand is valid and likely to send price higher.
Price is also supported by the Weekly Demand zone.
📌 Game Plan
1. Price to come back and retest the Weekly Demand zone at 0.0125$
2. Price to come back and retest the Daily Demand zone at 0.0117$
3. Price to run Equal Lows (purple line – 0.0117$) and close back above
4. Price to hit the 0.75 most discounted range level
🎯 Setup Trigger
I will be looking for a 4H break of structure before entering any position.
📋 Trade Management
Stoploss: Below the 4H swing low responsible for BOS
Targets:
• TP1: 0.0149$
• TP2: 0.016$
• TP3: 0.0175$
💬 Like, follow, and comment if you find this setup valuable!
⚠️ Disclaimer: This content is for informational and educational purposes only and does not constitute financial, investment, or trading advice. Always do your own research before making any financial decisions.

SHIBUSDTThe BINANCE:SHIBUSDT is moving in a trading range, but it could break either 0.00001300 or 0.00001190 and continue the trend after the breakout. I think it will be bullish because the larger time frame shows an uptrend.

SHIB Swing Long IdeaSHIB Swing Long Idea
📊 Market Sentiment
Market sentiment remains constructive, backed by the potential of a 0.25% rate cut at the upcoming FOMC meeting. With the USD weakening and global risk appetite improving, conditions continue to support upside momentum across crypto markets.
📈 Technical Analysis
Price has broken the LTF bullish trendline and is retracing lower.
However, the broader HTF trend remains strongly bullish, so I’m focused only on long setups.
I expect price to test the daily demand zone and sweep liquidity within it before initiating a move higher.
📌 Game Plan
1)Price to reach the daily demand zone at 0.00001177
2)Price to run the 0.00001164 daily swing liquidity level (major liquidity pool)
3)Price to retrace into the 0.75 max discount zone for confluence
🎯 Setup Trigger
I will look for a confirmed 4H break of structure before entering.
📋 Trade Management
Stoploss: Below the 4H swing low responsible for the BOS
Targets:
• TP1: $0.00001350
• TP2: $0.00001420
• TP3: $0.00001595
💬 Like, follow, and comment if you find this setup valuable!
⚠️ Disclaimer: This content is for informational and educational purposes only and does not constitute financial, investment, or trading advice. Always do your own research before making any financial decisions.
