SHIB/USDT - Critical Support Zone - Reversal or Breakdown?SHIB/USDT on the 3-Day (3D) timeframe remains in a medium-to-long-term bearish structure. Since the previous peak, price has consistently formed lower highs and lower lows, confirming strong seller dominance. Currently, price is trading near a major historical support zone, making this area crucial for determining the next directional move.
---
Pattern Explanation
Descending Trendline (Bearish Trendline)
The yellow diagonal line represents a well-respected descending trendline, connecting multiple lower highs. As long as price remains below this trendline, the overall market structure stays bearish.
Bearish Continuation Structure
Price action shows weak corrective rebounds, suggesting that every upside move is still being used as a selling opportunity.
Horizontal Key Levels (Supply & Demand Zones)
The horizontal yellow levels mark important historical supply and demand zones, where previous supports have now turned into resistances.
---
Key Levels
Resistance Zones:
0.00001120
0.00001400
0.00001550
0.00002100
0.00002430
0.00003300 (Major Resistance / Previous High)
Support Zones:
0.00000840 (Current Minor Support)
0.00000678 (Major Low / Strong Demand Area)
---
Bullish Scenario
Price holds firmly above the 0.00000678 – 0.00000840 support zone
Formation of a higher low on the 3D timeframe
A confirmed breakout and close above the descending trendline
Additional bullish confirmation if price reclaims 0.00001120
Bullish Targets (Step-by-Step):
0.00001120
0.00001400
0.00001550
0.00002100
This scenario would indicate a medium-term trend reversal, but strong volume confirmation is still required.
---
Bearish Scenario
Price fails to hold above 0.00000678
Strong breakdown and candle close below the major support
Continuation of the lower-low structure
Bearish Targets:
0.00000510
0.00000425 (Extreme demand zone / potential capitulation area)
If this scenario plays out, SHIB may enter a bearish extension phase with sustained selling pressure.
---
Conclusion
SHIB/USDT is currently trading at a critical decision zone.
As long as price remains below the descending trendline, the primary bias stays bearish.
However, this lower support region could also act as a long-term accumulation base if a valid structural breakout occurs.
Waiting for clear price action confirmation is highly recommended, especially on higher timeframes like 3D.
#SHIB #SHIBUSDT #CryptoAnalysis #TechnicalAnalysis #Downtrend #Altcoin #MarketStructure #SupportResistance #BearishTrend #PotentialReversal
Shiba

shiba inu (SHIB)If Shiba Inu holds so much value, currently ~$5 billion, how come the chart is so lackluster for so many years? Developers spend too much money is my guess. When there is less development for a meme token, the token is more likely to do well, right? Because, if there is nothing happening behind the scenes, there is nothing to deplete the value of the tokens with no need to spend money, or so I'd like to think. Yet, there are always people who are also not in heavy development mode that still seem to spend their investment when the prices are high thus removing the potential long terms gains and future investors along the way.

SHIBUSDTWe are in correction at big short but should failed short and continue move price to high levels.
I wait for take trade with breakout 0.0000900 for buy and breakout 0.0000810 for short position.
CRYPTOCAP:PEPE KRAKEN:PEPEUSD BINANCE:PEPEUSDT

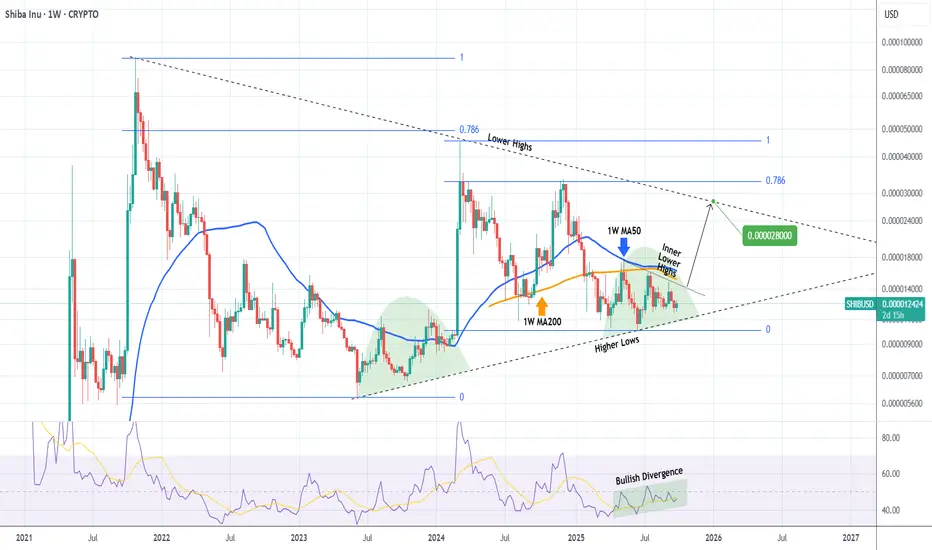
SHIBA Its first 1W Death Cross ever has been formed.Shiba Inu (SHIBUSD) has been trading within a Channel Down since the March 2024 High, which was the former Bull Cycle's Top. 4 weeks ago it completed its first ever 1W Death Cross, potentially signaling a strong bearish extension for the current Bear Cycle.
Until that happens, we have a short-term Buy Signal at our hands as not only did the Channel Down price a new Lower Low, thus technically granting the start of a new Bullish Leg, but this also took place on the 4-year Support Zone, which has been unbroken since May 2021.
As you can see, this Zone has offered numerous long-term buy opportunities. As in 2022 and 2023, every such rebound though is limited/ restricted by the presence of the 1W MA50 (blue trend-line), which has been rejecting every test since January 20 2025 (almost 1 year).
Based on that, unless we break the recent low, we expect SHIB to rally on the short-term and peak near the 1W MA50 at 0.0000115.
---
** Please LIKE 👍, FOLLOW ✅, SHARE 🙌 and COMMENT ✍ if you enjoy this idea! Also share your ideas and charts in the comments section below! This is best way to keep it relevant, support us, keep the content here free and allow the idea to reach as many people as possible. **
---
💸💸💸💸💸💸
👇 👇 👇 👇 👇 👇

SHIB fighting EMAHey guys, SHIB is setting up for a potential breakdown on the 1H timeframe, and the risk-reward is looking pretty clean for short positions right now.
Price is trading at $0.00000853, sandwiched between EMA20/50 resistance at $0.00000857-858 and the make-or-break EMA200 support at $0.00000852. The ADX reading of 56.0 confirms we're in a strong trending environment, and that trend is decidedly bearish. RSI at 30.8 is approaching oversold, but without bullish divergence and with volume running 77% below average, there's no conviction for a reversal yet.
The setup: short entries around $0.00000855 with a tight stop above $0.00000865 (invalidation if we reclaim the EMA cluster). First target sits at the Bollinger Band lower support at $0.00000844, with an extended target at $0.00000838 if the EMA200 breaks. That gives us roughly 1:2.5 risk-reward on the conservative target and 1:4+ if we get the full move. The MACD remains bearish, MFI shows weak money flow at 36.5, and the internal market state is reading choppy with only 17% directional confidence, but the sell signals are stacking up.
Key risk: if price reclaims $0.00000859 (BB middle band) with volume, this whole setup gets invalidated and we could see a squeeze back toward $0.00000874. But until that happens, the path of least resistance is down, especially with such weak participation on bounces.
How are you playing this move? Waiting for the EMA200 break or already positioned short?

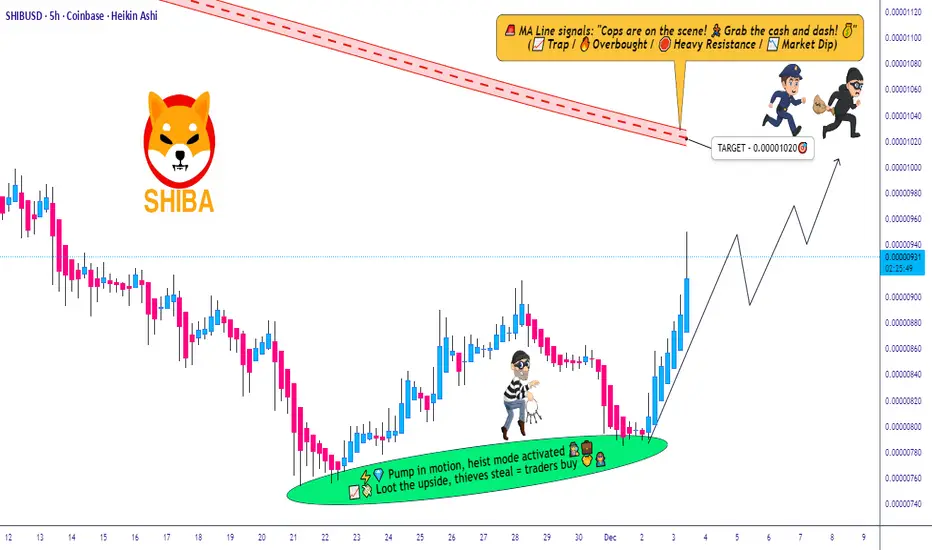
SHIB/USD Momentum Building — Is a Upside Expansion Coming?SHIB/USD Breakout Blueprint — Bullish Run Loading…? 🚀📈
📌 Asset Overview
SHIB/USD — “SHIBA INU VS U.S DOLLAR”
Crypto Market Opportunity Blueprint (DAY Trade)
🧭 Trading Plan
Plan: Bullish plan
Entry: YOU CAN ENTRY ANY PRICE LEVEL
🛡️ Stop Loss Guidance
Stop loss: This is thief SL @ 0.00000840, Dear Ladies & Gentleman (Thief OG's) Adjust your SL based on your startergy & own risk.
Note: Dear Ladies & Gentleman (Thief OG's) iam not recommended to set only my SL. its your own choice you can make money then take money at your own risk.
🎯 Take-Profit Outlook
Target: TRIANGULAR Moving average act as a strong resistance + overbought + trap is there so kindly escape with profits.
OUR target @ 0.00001020
Note: Dear Ladies & Gentleman (Thief OG's) iam not recommended to set only my TP. its your own choice you can make money then take money at your own risk.
📡 Market Context & Key Technical Insight
SHIB is now reacting strongly to triangular MA compression, signaling momentum buildup.
Overbought conditions create potential trap-zones, so profit-taking discipline is important.
Market structure remains bullish, buyers stepping in consistently on dips.
🔗 Related Pairs to Watch (Correlation + Key Points)
1️⃣ COINBASE:DOGEUSD — Dogecoin
Often moves in parallel with SHIB because both are meme-driven assets.
DOGE liquidity spikes usually lead SHIB volatility by a few minutes.
Strong DOGE breakouts can indicate SHIB momentum continuation.
2️⃣ BITSTAMP:BTCUSD — Bitcoin
BTC controls entire crypto risk sentiment.
If BTC holds above intraday EMA clusters and trends bullish, SHIB gets risk-on support.
Sharp BTC pullbacks may cause SHIB short-term weakness.
3️⃣ BITSTAMP:ETHUSD — Ethereum
SHIB is built on Ethereum, so gas fees + network congestion can influence SHIB’s intraday ranges.
ETH bullish breakouts often open liquidity for altcoins like SHIB.
4️⃣ COINBASE:SOLUSD — Solana
Not directly correlated but competes for retail meme attention.
If SOL rallies aggressively, retail flows may shift between meme-coins and high-beta L1 assets.
5️⃣ BINANCE:SHIBUSDT (Spot)
Tracks most liquid version of SHIB trading.
If SHIB/USD and SHIB/USDT diverge, it signals USD-index impact or exchange-based liquidity imbalances.
🧭 Summary
This SHIB setup is a momentum-driven bullish opportunity, but smart exits are key due to resistance and overbought traps. Watch DOGE and BTC closely—they are the primary flow leaders determining SHIB’s intraday aggression.
SHIB/USDT — Critical Demand Zone: Reversal or Full Capitulation?SHIB is now revisiting the major demand zone at 0.000007–0.0000055, a level that has acted as the foundation of every major multi-month rally since 2021.
This zone is not just support — it is a psychological pivot that separates long-term accumulation from market capitulation.
Each historical touch of this zone has triggered strong bullish reactions, yet the current structure is different:
Weekly price action continues to print lower highs, signaling that institutional selling pressure remains active while buyer conviction has not yet shown dominance. SHIB is entering a transitional phase, where the next few weekly candles can redefine its macro direction.
---
Price Structure and Market Pattern
1. Descending Structure / Lower Highs
Indicates weakening long-term momentum and the need for strong confirmation before any sustainable bullish reversal.
2. Major Demand Zone (0.000007–0.0000055)
A multi-year accumulation area with repeated deep wicks and strong historical rejections, showing where large players have entered previously.
3. Layered Horizontal Supply Zones
Key resistance levels created by previous distribution phases:
0.0000107
0.0000160
0.0000326
0.0000667
4. Market Compression
The longer price compresses against this demand zone, the larger the eventual breakout impulse — in either direction.
---
Bullish Scenario: A Major Reversal Begins Here
Bullish confirmation requires:
1. A weekly close above 0.000007
2. A strong reversal candle (bullish engulfing, hammer with solid body)
3. Increasing buying volume
4. Early bullish divergence on RSI/MACD (weekly or daily)
If confirmed, upside levels open in stages:
Target 1: 0.0000107
Target 2: 0.0000160
Target 3: 0.0000326
Breaking above Target 3 would signal a potential macro trend shift, turning SHIB from long-term bearish to structurally bullish.
---
Bearish Scenario: Breakdown and Capitulation Phase
Bearish continuation is confirmed if:
1. Weekly close breaks below 0.0000055
2. Retest of 0.000007 fails to reclaim
3. Selling volume accelerates, showing loss of long-term accumulation interest
If this breakdown holds, price opens the door to deeper downside:
0.0000040
0.0000030
These levels represent historical liquidity pockets where capitulation tends to occur before larger players begin accumulating again.
---
Key Takeaway
SHIB is not just sitting at a support — it is testing the macro decision zone that will determine its long-term direction into 2026.
From a probability perspective:
Holding the 0.000007–0.0000055 zone = potential for a major swing rally
Losing it on a weekly close = activation of a deeper bearish leg
The upcoming weekly closures will define whether SHIB resets its long-term trend or enters a prolonged capitulation phase.
---
#SHIB #SHIBUSDT #CryptoAnalysis #MarketStructure #WeeklyChart #SupportZone #DemandZone #PriceAction #AltcoinAnalysis

usdt.d 4dHello
I am Mehdi with 4-hour analysis
Based on the analysis, we expect the cryptocurrency market to start a new upward trend
Reasons
1. We are at the ceiling of the daily timeframe channel
2. Accurate harmonic ratios
3. Price action pattern
4 MACD divergence
5 RSI divergence
Resistance level 5.7
Finally, thank you for supporting me by liking, sharing and commenting

Shib(based on NEo wave)this fox make everybody angry or disappointed.
but the story of this cute fox is in long term it can make up to 1000% profit.
for 1000% profit you need to buy it in the deepest price but I prefer to buy it step by step with demand zones and with post pattern confrimation.

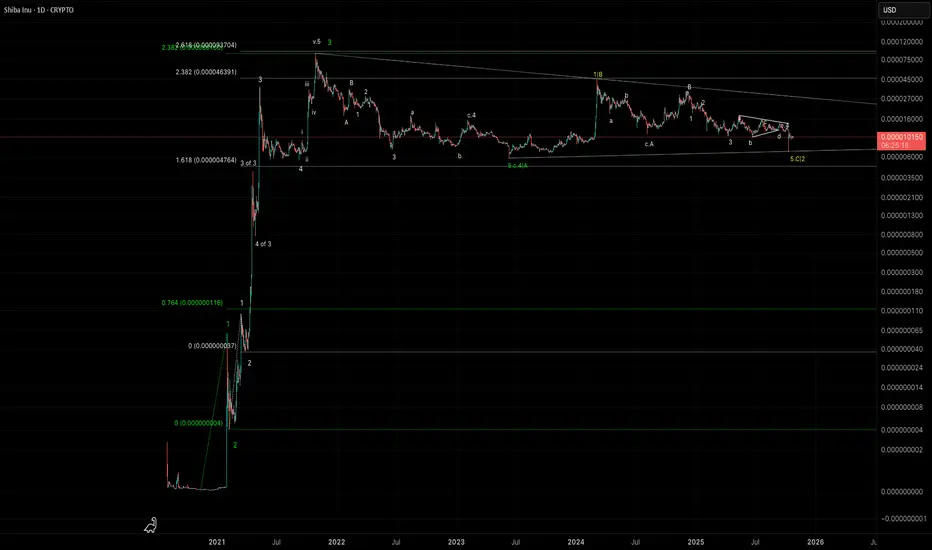
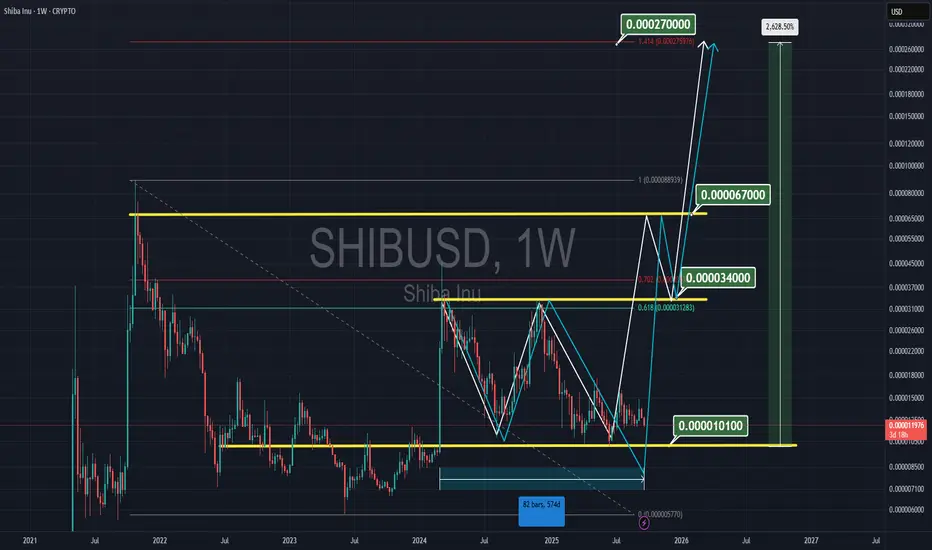
SHIBA INU, Why it needs One more highThis is my all-time elliott wave structure for SHIBA INU, and the reason why i think it needs one more high to complete 5 waves since it's creation. The structure shows how SHIBA has hit extension 2,382 to end wave 3. If we look at the internal structure —12345 white— we can see 5 waves of internal wave 3 hitting exactly the 2,618 extension. So, we have a nice confluence of 2,618 extension corresponding to all of wave 3 and 2,382 extension. SHIBA is now in a very long wave 4. Either it is a very large triangle where waves d and e are still needed or this correction is almost over. Also we have a classic bull flag. It's just a matter of time before SHIBA decides to go up and complete wave 5 to at least 2,618 extension
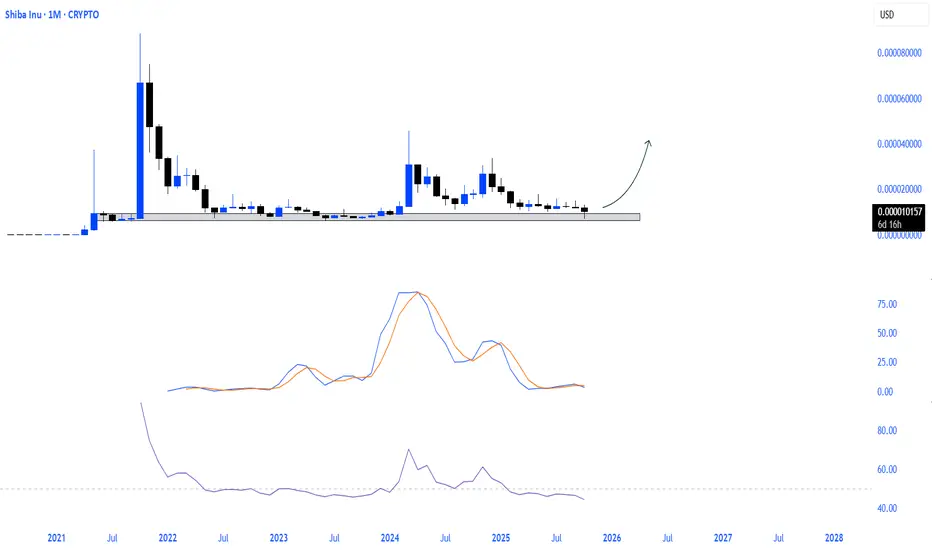
$SHIB the calm before the explode.Shiba Inu momentum is at historic lows.
The price is quietly gathering strength in a major demand zone.
This silence could be the sound of accumulation.
And every accumulation has its breakout.
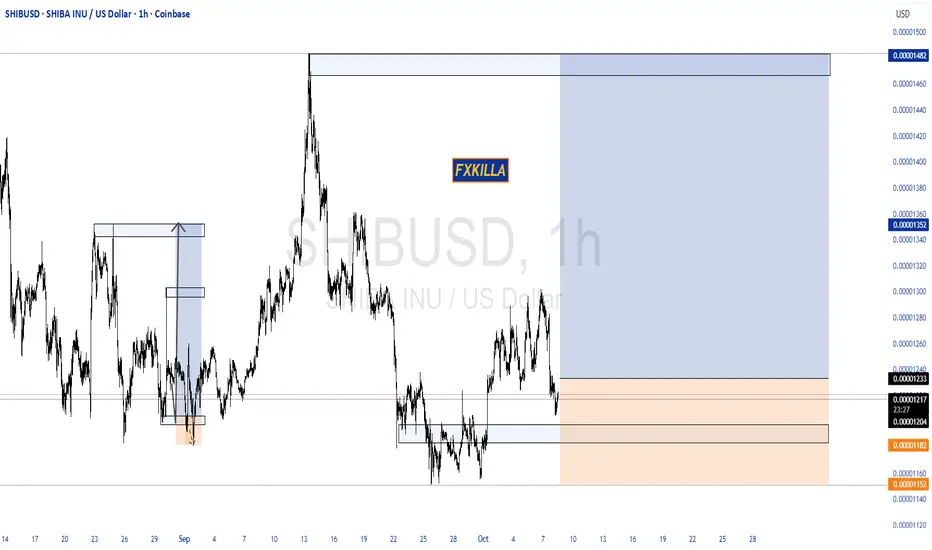
SHIBA INU HIGH PROBABILITY SETUP SOON!!!🚨 SHIBUSD HIGH PROBABILITY BUY SETUP 🚨
* Here We Can See Clearly The Next Potential Move For SHIBA Coming Hours/Days.
* Keep Your Eyes Close On Your Trading Positions.
* Happy PIP Hunting Traders.
FXKILLA.
AVL - Avalon Labs IS READY FOR A HUGE BREAKOUT UP $0,50 (DCA)We are following this coin closely and will continue to do so until it reaches our main target of $0.50+.
Based on the DCA (Dollar Cost Averaging) strategy, the ongoing burn program, and the current technical analysis (TA), this coin shows strong potential.
Depending on the upcoming data, we expect the next bullish move (the next “B” increase) to trigger a breakout into a new uptrend.


SHIBA Strong break-out expected, targeting 0.000028!Shiba Inu (SHIBUSD) has been trading within a Triangle pattern since the October 25 2021 Top of its previous Bull Cycle. The successive Lower Highs of the current Cycle have failed to make a new All Time High (ATH) and have 'trapped' the price action below its 1W MA50 (blue trend-line), is a similar Accumulation Phase on the Higher Lows like June 2023 - January 2024.
However, the 1W RSI has been rising within a Channel Up, showcasing a technical Bullish Divergence. If the price breaks above the Inner Lower Highs trend-line, it will be a first Buy Signal with confirmation coming above the 1W MA50. In that case, we expect at least a 0.000028 test of the Triangle's top (Lower Highs), still a conservative target given that the 2024 rally almost hit its 0.786 Fibonacci retracement level.
-------------------------------------------------------------------------------
** Please LIKE 👍, FOLLOW ✅, SHARE 🙌 and COMMENT ✍ if you enjoy this idea! Also share your ideas and charts in the comments section below! This is best way to keep it relevant, support us, keep the content here free and allow the idea to reach as many people as possible. **
-------------------------------------------------------------------------------
💸💸💸💸💸💸
👇 👇 👇 👇 👇 👇
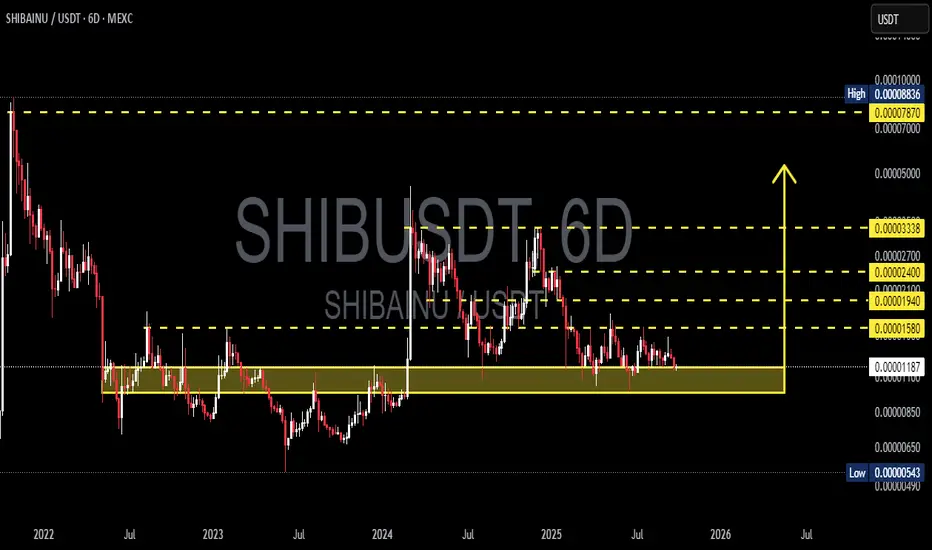
SHIBUSDT — A Major Move Will Be Decided From This Critical Zone!Overview
The 6D chart of SHIB/USDT shows a long-term consolidation that has been developing since 2022. Price is once again testing the key demand zone (0.00000850 – 0.00001183), an area that has acted as a strong support multiple times.
This zone is now a true “make or break level” — either SHIB rebounds for a major bullish wave, or it breaks down to much lower levels.
---
Structure & Price Pattern
1. Macro Downtrend
Since the ATH, SHIB has been printing lower highs, showing long-term seller dominance.
Yet, despite selling pressure, the demand zone has held — a sign that large buyers still exist here.
2. Extended Accumulation Zone
The yellow area (0.00000850 – 0.00001183) has acted as a base of accumulation since 2022.
Such prolonged consolidation often precedes explosive moves.
3. Clear Supply Levels
Resistance levels above price:
0.00001580 (initial breakout trigger)
0.00001940 → 0.00002400 → 0.00003338 (progressive bullish targets)
Major supply cluster at 0.00007870 – 0.00008836, which could be a magnet in case of a macro bullish reversal.
4. Volatility Contraction → Imminent Big Move
The 6D candles show a tightening range.
Classic signal of volatility compression, usually followed by a strong breakout or breakdown.
---
Bullish Scenario
Confirmation:
A breakout and 6D close above 0.00001580 with strong volume.
Targets:
0.00001940 → 0.00002400 → 0.00003338.
Ideal sequence:
Accumulation at support → breakout above resistance → retest as new support → rally continuation.
Reward potential: High risk-to-reward setup if the demand zone holds.
---
Bearish Scenario
Confirmation:
A breakdown below 0.00000850 with high volume.
Targets:
First: 0.00000543,
Then: potential new lows if liquidity is drained.
Risk:
If support fails, SHIB could enter a capitulation phase with accelerated downside.
---
Market Interpretation
Optimistic Buyers: See this as a long-term accumulation opportunity.
Cautious Sellers: A breakdown could trigger a steep sell-off.
Neutral Traders: Waiting for confirmed breakout/breakdown before committing larger positions.
---
Conclusion
SHIB is sitting at a critical zone that will define its macro direction into 2025–2026.
Holding support → opens path for multi-level rally.
Losing support → risk of deeper correction.
For long-term investors, this is the area to watch closely.
For swing traders, waiting for clear confirmation is the safer strategy.
---
#SHIB #SHIBUSDT #CryptoAnalysis #TechnicalAnalysis #SupportResistance #CryptoTrading #PriceAction #Accumulation #BreakoutSetup
SHIBA TO $0.00027It's been 574 days; Shiba is trading between the 101 support and 34 resistance lines. I believe it's an accumulation zone, with a breakthrough imminent. My target is approximately 0.00027, at 1.4 of the Fibonacci.
SHIB Sell to BUYBINANCE:SHIBUSDT Market Update:
After a significant downtrend and following a descending trendline on the daily timeframe, SHIB finally broke out and saw an impressive pump.
However, I now anticipate a potential correction from the current level (the red box) down towards the green box. I expect to see strong support in that area, which could then lead to the next bullish leg higher.

SHIBUSDTThe BINANCE:SHIBUSDT is moving in a trading range, but it could break either 0.00001300 or 0.00001190 and continue the trend after the breakout. I think it will be bullish because the larger time frame shows an uptrend.

Shiba Inu Sees Heavy Selling at 3-Week Price PeakShiba Inu is up 6.69% in the past week, with the token trading at $0.00001291. The meme coin is attempting to establish $0.00001285 as a support level, holding near its recent peak.
However, maintaining this momentum appears difficult without strong investor conviction. If selling continues, SHIB could drop toward $0.00001252 or even lower to $0.00001182, erasing recent gains.
On the flip side, if Shiba Inu price successfully defends the $0.00001285 support, a rebound may follow. In that case, SHIB could push toward $0.00001391, which would invalidate the bearish outlook and signal renewed strength.

SHIBA +100%?? | BEST Buy OPPORTUNITYSHIBA has been in a downtrend for many weeks.
From here, upside is likely - especially if we look at the consecutive amount of "red" weekly candles (blue on this chart).
A 40% bounce zone is easily possible from this zone. Even at modest, 20% would be ideal:
____________
BYBIT:SHIBUSDT

(SHIB) shiba inu "boxes" yearlyWhat's the deal with shiba inu? There is so much talk about it, yet the chart looks less than the comparison to what XRP looks like, for instance. XRP has a huge following, but so does Shiba Inu. Shiba Inu even has haters due to so many people talking about the revelation that Shiba Inu will win in the end. This year, Shiba Inu did not do much of anything unless you count all that has gone on with the website and the company. As for the chart graphs pictures, the look is one that feels like there could be a predictable end to the year brewing. Or is there?

Shiba Inu Trades at Bottom Prices, Can't Go Much LowerShiba Inu (SHIBUSDT) is already trading at bottom prices, this is good news because it means that it can't go much lower. We also know from the bottom we grow.
For example, look back to May 2022 - February 2024. SHIBUSDT was sideways and trading at bottom prices, what happened? This bottom consolidation period led to a strong bullish breakout. Expect the same.
Now in Feb. - August 2025 we have the same market conditions but within a higher low. The same. As SHIBUSDT consolidates at bottom prices, what follows is a wave of growth.
Notice how five weeks of bearish action produced only a tiny 22% retrace. This is quite stable for a Cryptocurrency since this is a very volatile market.
The next positive signal comes from marketwide action. Cardano had a similar chart but started to move forward. Chainlink had the exact same chart but is already moving ahead. The same with many others. That is, the action for SHIBUSDT is happening weekly below EMA55/89 but with the mentioned higher low and consolidation phase. Since the market is one and interconnected, we know Shiba Inu will do the same. Dogecoin is also trading at bottom prices, relatively low. We are only weeks away from a massive bullish run.
Patience is key.
Thanks a lot for your continued support.
Namaste.
