SHIBUSDT 6DSHIB ~ 6D Analysis
#SHIB Buy gradually from here with a short -term target of at least 20%+.
Shibainu

Shiba Inu Nears Major Support - Breakdown or Bounce?The $0.000005 - $0.000008 range has been a key support zone for Shiba Inu over the years. With a double-top "M" pattern in play since March 2024, and current market price at $0.00001231, CRYPTOCAP:SHIB is approaching this critical area once again.
What do you think - will price test the zone, or is a pump incoming from here?
Drop your thoughts!
Kindly support this idea with a LIKE👍 if you find it useful🥳
Happy Trading💰🥳🤗

Don’t Miss the Next Shiro Neko SurgeShiro Neko is setting up for another breakout.
Consider buying in the next few days — it may surpass its all-time high at any moment.
Remember: it hit a 1 Bi market cap in just one day.
Don’t underestimate it — 2 Bi within a week is on the table.
Stay sharp. 📈🐾
#ShiroNeko

SHIBUSDT Buy Signal We see Head and Shoulders pattern on SHIB H4 chart. Daily chart is also bullish. after few losses this position can make great comeback. Risk reward 1/5

ShibaInu SHIB price analysisNow the price of CRYPTOCAP:SHIB is at the top of the Buy zone.
But do we want to buy this asset in our portfolio: more likely no than yes.
Well, who already has #ShibaInu purchased, then he can only wait for a miracle in the form of at least x2 growth by the summer of 2025, to the range of $0.000029-0.000030
Or maybe OKX:SHIBUSDT price will repeat the "feat" of its older brother CRYPTOCAP:DOGE ? 👇
The patterns of price behavior on the global chart are quite similar, what do you think ?

#SHIB/USDT#SHIB
The price is moving within a descending channel on the 1-hour frame, adhering well to it, and is on its way to breaking it strongly upwards and retesting it.
We are seeing a bounce from the lower boundary of the descending channel, this support at 0.00001100.
We have a downtrend on the RSI indicator that is about to break and retest, supporting the upward trend.
We are looking for stability above the 100 moving average.
Entry price: 0.00001224
First target: 0.00001284
Second target: 0.00001344
Third target: 0.00001417

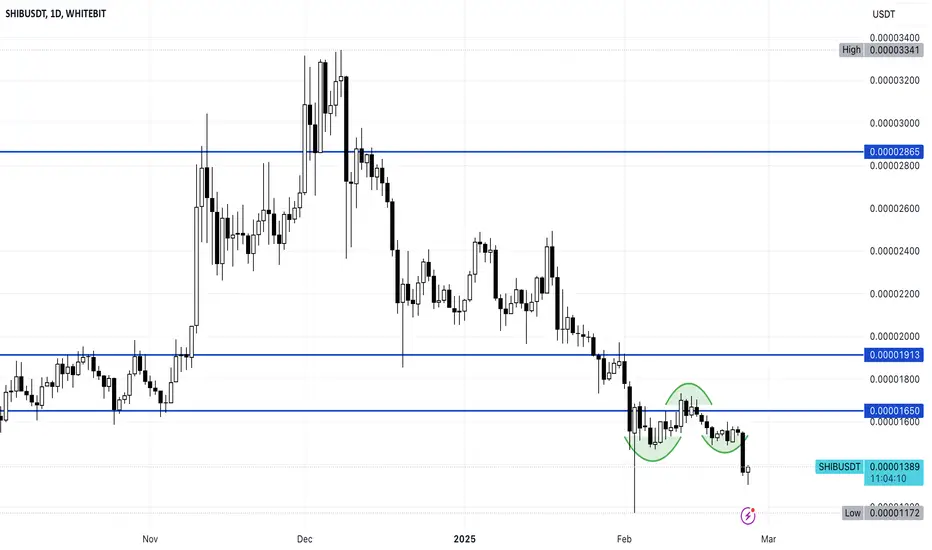
Shiba Inu (SHIB) Shows First Major Bullish Signal Amid Market ReAfter weeks of downward pressure, Shiba Inu (SHIB) (traded on WhiteBIT) has recorded its first notable bullish retrace, hinting at a potential trend reversal. The asset is currently trading near $0.00001337 and has successfully broken above the 26-day EMA—a key technical level that often signals the start of broader upward momentum.
This breakout is significant, marking SHIB’s first major move above resistance since February’s downtrend. The token’s local support now sits at $0.0000122, and if bullish momentum continues, SHIB could target the next major resistance at the 50 EMA ($0.0000145). A further push above this level could solidify the reversal.
Additionally, the Relative Strength Index (RSI) at 50.75 suggests growing buying pressure. A move above the 55-60 zone would reinforce the bullish setup and potentially trigger further gains. With market liquidity also increasing, traders seem to be re-entering SHIB, setting the stage for possible continued upside.

$LEASH Set For A Surge Amidst Breaking Out of a Falling Wedge The Price of Doge Killer ($LEASH) is set for a massive surge amidst breaking out of a falling wedge pattern. A pattern formed on the start of January, 2025 that saw $LEASH lose about 33% of value albeit the general crypto landscape was bearish for over 3 weeks now.
We saw CRYPTOCAP:BTC swinging in the $80,000 - $86,000 axis, with CRYPTOCAP:ETH also swinging in the $1900- $2100 pivot. Additionally, should Doge Killer ($LEASH) token break the 1-month high pivot, a bullish continuation move is inevitable.
What Is Doge Killer (LEASH)?
Doge Killer (LEASH) is a token in the Shiba Inu (SHIB) ecosystem. Shiba Inu is commonly referred to as the “Dogecoin (DOGE) killer” because of its enormous popularity. SHIB grew to become the second-largest canine-inspired coin in the crypto space and aims to be the Ethereum (ETH)-based counterpart to Dogecoin’s Scrypt-based mining algorithm. Besides LEASH, there is also Bone ShibaSwap (BONE), another dog coin that is part of the Shiba universe, which can be traded on its own ShibaSwap decentralized exchange (DEX).
Doge Killer Price Live Data
The live Doge Killer price today is $173.74 USD with a 24-hour trading volume of $1,646,362 USD. Doge Killer is up 12.37% in the last 24 hours, with a live market cap of $18,485,943 USD. It has a circulating supply of 106,399 LEASH coins and the max. supply is not available.

SHIBUSDT ShortSHIB consolidation on H4 chart. Now price at the resistance level and starts downtrend to retest support level.

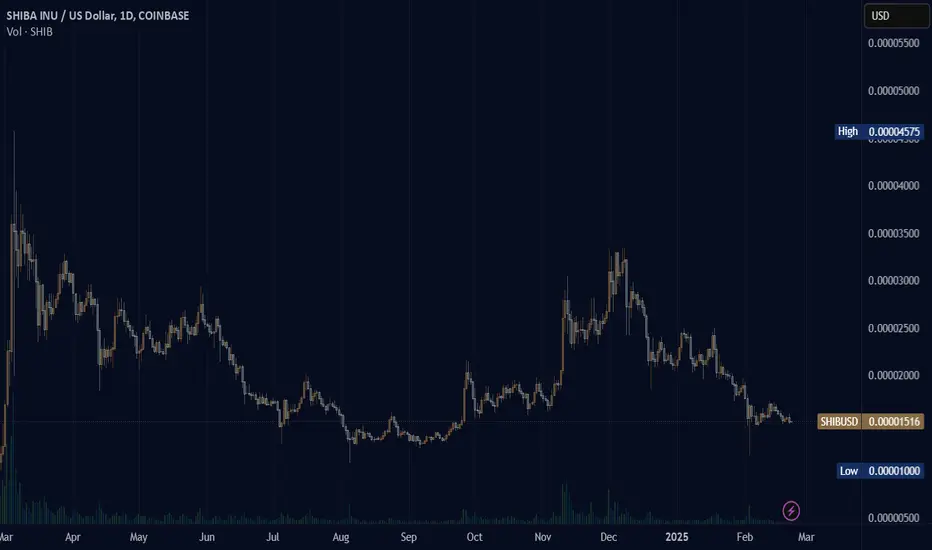
SHIBUSD can go x7 from here.Shiba Inu / SHIBUSD is rebounding at the bottom of the 3.5 year Triangle.
The 1week RSI is on a similar sequence as February-May 2023, which eventually rose aggressively by +661.50%.
Considering that the price made last week a Double Bottom with the August 5th 2024 low, this is a unique long term buy opportunity.
Buy and target 0.00008450
Follow us, like the idea and leave a comment below!!

Will Shiba’s 20% decline reach the crucial 0.0000090 support?Hello and greetings to all the crypto enthusiasts, ✌
All previous targets were nailed ✅! Now, let’s dive into a full analysis of the upcoming price potential for Shiba 🔍📈.
Shiba appears to have become a stagnating asset, resembling a "walking dead" in the market. In my upcoming educational analysis, I will delve deeper into such tokens, providing a more comprehensive understanding. Currently, Shiba is trapped within a descending channel, and I anticipate a further decline of at least 20%. The primary target for this downtrend is 0.0000090, a significant monthly support level that will play a crucial role in determining its future price action.📚🙌
🧨 Our team's main opinion is: 🧨
Shiba is stuck in a downtrend, with a 20% drop likely, targeting the key support at 0.0000090.📚🎇
Give me some energy !!
✨We invest hours crafting valuable ideas, and your support means everything—feel free to ask questions in the comments! 😊💬
Cheers, Mad Whale. 🐋

SHIBUSD - Wild Triangle IdeaDrawing a massive triangle between the previous peak of SHIB
From that peak price has mainly moved horizontally with not many breakouts
Perhaps we will see movement out of this triangle like what was seen in the early bull run for SHIB
Speculative idea
Weekly timeframe

SHIB Experiences Token Burns: What's Next?Shiba Inu (SHIB) is currently trading at $0.00001166. This price reflects a sharp decline from $0.00001541 on March 10, aligning with a broader cryptocurrency market downturn that saw the total market capitalization drop by 4.4% over the past 24 hours. SHIB’s current price sits below its 50-day SMA ($0.00001647) and 200-day SMA ($0.00001939), signaling a bearish trend in the medium to long term. Recent social media posts on X note a significant token burn rate, with over 15 million SHIB burned in the last 24 hours, reducing supply, a factor that could bolster the price over time. However, for the short-term 1-hour timeframe, volatility and market sentiment are driving the action.
Technical Indicators and Key Levels
On the 1-hour chart, SHIB is testing a key support zone around $0.00001100, with additional support levels at $0.00001051 and $0.00001001 if the downward pressure continues. The price is likely below short-term moving averages (e.g., 20-period or 50-period), reinforcing the bearish momentum in this timeframe. The Relative Strength Index (RSI) was recently reported at 31.80, hovering near oversold territory (below 30), which could suggest a potential bounce if buying interest picks up. On the upside, resistance levels to watch include $0.00001278, $0.00001403, and the recent high of $0.00001541. Breaking these levels would require a shift in market dynamics, likely accompanied by a surge in trading volume.
Potential Scenarios and Trading Considerations
Two primary scenarios emerge for SHIB on the 1-hour chart. Bullish Case: If the price holds above $0.00001100 and attracts buyers, it could rally toward $0.00001278 or even $0.00001403, especially if volume increases on upward moves. However, the broader market’s bearish sentiment might limit gains, so any recovery could be short-lived. Bearish Case: If selling pressure breaks $0.00001100, SHIB could slide toward $0.00001051 or $0.00001001, particularly if high volume confirms the downtrend. The recent token burns add a positive long-term narrative, but their impact is unlikely to dominate this short timeframe. Traders should also monitor broader market catalysts—such as shifts in crypto sentiment, that could influence SHIB’s next move.
Final Tips
In this volatile setup, timing is critical. Watch the $0.00001100 support closely, a hold or break here will dictate the short-term direction. Look for volume spikes to confirm any breakout above $0.00001278 or breakdown below $0.00001100. Given the market-wide downturn, risk management is essential, use tight stop-losses and avoid chasing momentum without confirmation. Stay alert for news or whale activity that could jolt the price, and let the chart guide your decisions.
Potential Price Movements
Bullish Scenario: A move above $0.00001278 could target $0.00001403.
Bearish Scenario: A drop below $0.00001100 may test $0.00001051 or lower.
Note: Volume confirmation is key, watch for spikes to validate price action.

Shiba Faces Potential 30% Drop: Set Stop-Loss for SafetyHello and greetings to all the crypto enthusiasts, ✌
In several of my previous analyses, I have accurately identified and hit all of the gain targets. In this analysis, I aim to provide you with a comprehensive overview of the future price potential for Shiba Inu , 📚🎇
While we may observe upward candles as part of completing the current bearish phase, which I have clearly depicted on the chart, the potential for further decline remains. I foresee another drop of at least 30% for Shiba, with a primary target price of 0.00001120. The bearish channel is still active and may extend downward. Given this, it's crucial to implement a stop-loss strategy to mitigate any downside risk. Protect your investment by closely monitoring the market's behavior and adjusting accordingly. 📚✨
🧨 Our team's main opinion is: 🧨
There might be a short-term upward movement, but Shiba could still drop another 30% to around 0.00001120, so make sure to set a stop-loss to protect your investment.
Give me some energy !!
✨We invest countless hours researching opportunities and crafting valuable ideas. Your support means the world to us! If you have any questions, feel free to drop them in the comment box.
Cheers, Mad Whale. 🐋

SHIB/USDT BUYHello friends
Given the price reaching resistance and price correction, there is a good opportunity to buy...
Here we suggest you buy step.
We have also specified price targets for you.
*Trade safely with us*

Shiba Inu 8X Trade-Numbers (3,520% Potential)Is it ok to go over the basics once more? Sell at resistance, buy at support.
The low is in 3-Feb with a long lower wick candle and high buy volume.
Today, we are seeing the establishment of a higher low close to support. This close to support dynamic gives us a great entry zone.
A great entry zone doesn't mean that a trade will necessarily work out, but it means that it has low risk and a high probability to succeed. Think about it, most of the time we tend to rush to buy when the action is already happening. Here, we can clearly see bearish action and a red day, but, we have a higher low and we know that reversals tend to happen at support.
The higher low is the signal. We have good entry timing. We leave the rest to the market.
_____
LONG SHIBUSDT
Leverage: 8X
Entry levels:
1) $0.00001310
2) $0.00001225
3) $0.00001160
Targets:
1) $0.00001681
2) $0.00001997
3) $0.00002253
4) $0.00002509
5) $0.00002873
6) $0.00003337
7) $0.00003849
8) $0.00004165
9) $0.00004677
10) $0.00005505
11) $0.00006095
12) $0.00006845
Stop-loss:
Close weekly below $0.00001100
Potential profits: 3520%
Capital allocation: 5%
_____
Remember that leveraged trading is high risk and for experts only.
There is no advice here, more like technical analysis and numbers.
I appreciate you and your continued support.
Let's make some money and while we make money, let's have some fun.
Follow!
Namaste.

Shiba Inu 2025 Bull-Market Target An Advanced Trading TipsWhere are my Shiba lovers? Did you miss me?
Certainly, I did miss you. If you noticed that I've been away from this pair, it is because the chart wasn't looking any good.
I am back now, which means the chart looks great.
Friendly alert, I am going LONG on this pair with high lev.
Let's get started with the technical analysis.
Shiba Inu is in a long-term rising trend. The market bottom was hit in June 2023. After this bottom, we have higher prices, higher highs and higher lows.
The 2024 corrective phase is coming to its end. It produced an intermediate higher low and the action is ready, and about, to turn bullish. Here I am showing a 600% potential for growth.
The same 600% target taken from the June 2023 market bottom would be equal to more than 1,800%. You decide if this is enough for Shiba Inu in 2025 or if prices will go higher. Right now, it is hard to say.
This a simple chart, quite standard. This pair requires nothing more than patience after buy and hold. The bullish wave can take anywhere between 4 to 8 months to fully develop. Allow for a big correction in-between the first and last peak. This correction will be a period of major doubt for many participants. By now, everybody is used to bearish action and all bullish waves ending after a couple of months. When the bull-market is on, the dynamics will be much different but since it only happens once every four years, nobody remembers that the halftime correction will result in a new and strong bullish impulse.
Anyway, even knowing this it would be wise to sell at the peak of the first wave to buy back lower when prices move down, why? Because the correction can last anywhere between 1-3 months. While you will be happy saying I can wait long-term, when prices move lower and it takes so long to recover, you will wonder why you didn't sell when it was obvious that bullish momentum was dying down.
Actually, it will be hard to know the top because of the energy when it happens, everybody is happy and euphoric. But you can tell when a top is in because that's exactly when you become greedy. You will be thinking, "I can wait. I want higher. Give me more." The moment these thoughts start to happen, RUN! Secure profits on the way up. It is the only way to win. In order to win, you have to sell when prices are up. Right now is the time to buy, to buy and hold. But later, you have to produce a winning trade and that only happens when you decide to take money home.
It is healthy to withdraw. It is healthy to secure profits when your capital grows.
You don't have to be 100% right. If uncertain, sell a portion and then continue to hold.
Namaste.

SHIBUSDT 6DSHIB ~ 6D Analysis
#SHIB Support that you might be able to consider to start buying back from here.
Reason, So far it still maintains this block of support.

Shiba Inu Burns 2532% More Tokens. Is It Enough For Rally?Shiba Inu has once again caught the crypto world’s attention. A staggering 2532.14% surge in token burns over the last 24 hours signals an aggressive push to reduce supply, which in theory, should drive up prices. Yet, SHIB has fallen 6.16% in the same period, trading at $0.00001469.
So, what’s really going on? If burns are skyrocketing, why isn’t SHIB’s price following suit?
Key Technical Signals: Bullish Reversal or Further Decline?
Despite the promising burn numbers, SHIB is hovering at a critical support level ($0.0000147). If this level fails, a drop toward $0.00001261 is likely. However, a strong hold here could spark a rebound toward $0.00001718.
🔹 Classic Head & Shoulders Pattern – Typically a bearish signal unless a breakout negates it.
🔹 Weak Network Growth – Adoption is up just 0.27%, signaling low demand.
🔹 Institutional Interest Dropping – Large transactions are down 9.95%, reducing bullish momentum.
🔹 Holders Underwater – "In the money" metric down 1.06%, suggesting more SHIB holders are at a loss.
Will SHIB Recover?
📌 Bullish Case – If $0.0000147 holds, a relief bounce to $0.00001718 is possible.
📌 Bearish Case – A break below $0.0000147 could lead to further losses toward $0.00001261.
Despite an impressive burn rate, SHIB is still struggling under bearish sentiment. For any meaningful rally, stronger catalysts—such as increased adoption or market-wide bullish sentiment—will be needed.
BTC/USD: From $95K Surge to Critical $89K Support – What’s Next?Bitcoin's 6-hour chart shows that after our last analysis, the price successfully rallied from $95,000, reaching all three targets: $96,200, $97,600, and $101,700, yielding over 8% return.
Today, Bitcoin finally broke the $90,000 support after holding for several days, dropping to $86,000 before recovering to the $89,000 range. If the price stabilizes above $89,000 in the next two days, we could expect an upward move towards the next targets at $90,800, $93,800, and $98,000.
Please support me with your likes and comments to motivate me to share more analysis with you and share your opinion about the possible trend of this chart with me !
Best Regards , Arman Shaban

Meme King or Fluke?SHIB’s staging a meme comeback on the 4H at $0.00001564, bouncing from $0.00001400 in early February after a drop from $0.00002000 in January. I’m bullish. SHIB’s massive community, 120% YTD rally, and Shibaswap/staking hype make it the meme king in 2025. But is this the start of a $0.00002 moonshot, or another fluke?
Technically, we’re consolidating in a tight range near $0.00001500-$0.00001600, forming a bullish flag or triangle... breakout potential to $0.00002000 if we flip $0.00001780 (200 EMA). RSI’s at 54.38 and rising, showing buyers piling in, while Stochastic’s overbought (70.80/61.36) but not extreme, hinting at upside. Volume’s steady at 86.91B, suggesting accumulation, and MACD’s flattening from bearish, signaling a potential reversal. The 50/200 EMAs are diverging (50 at $0.00001563, 200 at $0.00001780)... watch for a Golden Cross above $0.00001780 if price holds. Trump’s pro-crypto push and SHIB’s Robinhood buzz could pump us to $0.00002500, but bears argue $0.00001400’s the floor if support fails. I’ve seen SHIB pull 50%+ pumps from similar setups in 2021... history repeating?
What’s your take?
SHIB to $0.00002000 by March or back to $0.00001400—where’s the target?
Is SHIB the meme king, or just fading hype from Shibaswap?
RSI, Stochastic, or EMAs—Which signals the breakout? Bullish or bearish?
Trump’s policies + Robinhood rumors—pump to $0.00002500, or noise leading to a crash?
Drop your targets, indicators, or contrarian views. I’ll reply to every comment and debate!

(SHIB) shiba inuThere is no cup and handle coming. The activity online by community programmer Kusama and other people seem to have led to a disgracing of the SHIB token and all that has happened is losing. Too much talk, not enough action. Silence is golden inu. There is still hope for Shiba Inu on the likes the acceptance of Shiba came far before many other meme tokens. Right now the Solana craze is being phased out in favor of Base chain memes. Base seems to be countering the popularity of Ethereum. Shiba Inu on Ethereum is not seen as trending the same way Solana memes and now Base memes are trending.
Shiro Neko – From the Same Creators as Shiba InuPeople ask me to analyze $Shiro, and my response is: calm down, stay cool. After all, nothing can go wrong, right? At least, that's what they say on Twitter and well-known YouTube channels: "Invest without fear, it's going to hit 2B, 5B, 10B market cap!"
But the reality is that no prediction actually works. And that’s a big problem. I've been analyzing $Shiro, and honestly, I don't see any signs. BINANCE:SHIBUSDT
