SHIBUSDTWe are in correction at big short but should failed short and continue move price to high levels.
I wait for take trade with breakout 0.0000900 for buy and breakout 0.0000810 for short position.
CRYPTOCAP:PEPE KRAKEN:PEPEUSD BINANCE:PEPEUSDT
Shibausdt

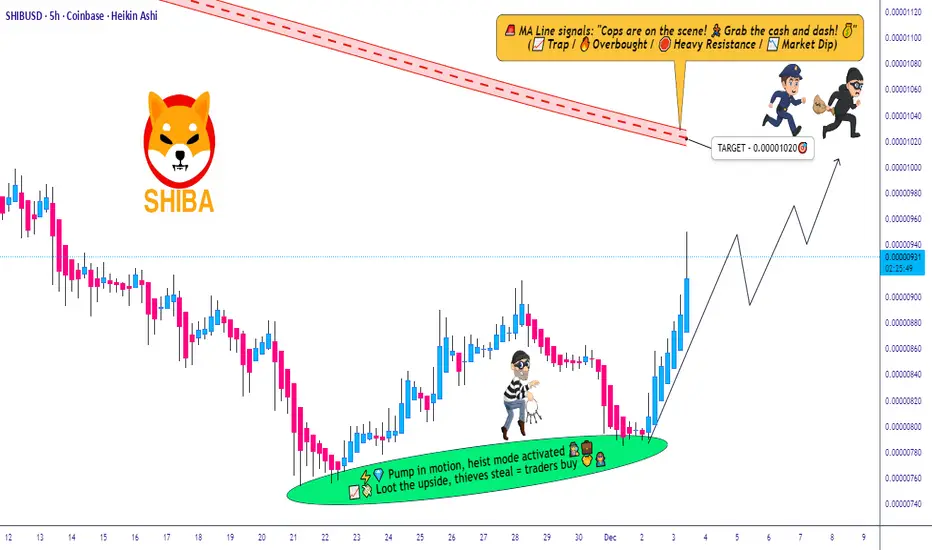
SHIB/USD Momentum Building — Is a Upside Expansion Coming?SHIB/USD Breakout Blueprint — Bullish Run Loading…? 🚀📈
📌 Asset Overview
SHIB/USD — “SHIBA INU VS U.S DOLLAR”
Crypto Market Opportunity Blueprint (DAY Trade)
🧭 Trading Plan
Plan: Bullish plan
Entry: YOU CAN ENTRY ANY PRICE LEVEL
🛡️ Stop Loss Guidance
Stop loss: This is thief SL @ 0.00000840, Dear Ladies & Gentleman (Thief OG's) Adjust your SL based on your startergy & own risk.
Note: Dear Ladies & Gentleman (Thief OG's) iam not recommended to set only my SL. its your own choice you can make money then take money at your own risk.
🎯 Take-Profit Outlook
Target: TRIANGULAR Moving average act as a strong resistance + overbought + trap is there so kindly escape with profits.
OUR target @ 0.00001020
Note: Dear Ladies & Gentleman (Thief OG's) iam not recommended to set only my TP. its your own choice you can make money then take money at your own risk.
📡 Market Context & Key Technical Insight
SHIB is now reacting strongly to triangular MA compression, signaling momentum buildup.
Overbought conditions create potential trap-zones, so profit-taking discipline is important.
Market structure remains bullish, buyers stepping in consistently on dips.
🔗 Related Pairs to Watch (Correlation + Key Points)
1️⃣ COINBASE:DOGEUSD — Dogecoin
Often moves in parallel with SHIB because both are meme-driven assets.
DOGE liquidity spikes usually lead SHIB volatility by a few minutes.
Strong DOGE breakouts can indicate SHIB momentum continuation.
2️⃣ BITSTAMP:BTCUSD — Bitcoin
BTC controls entire crypto risk sentiment.
If BTC holds above intraday EMA clusters and trends bullish, SHIB gets risk-on support.
Sharp BTC pullbacks may cause SHIB short-term weakness.
3️⃣ BITSTAMP:ETHUSD — Ethereum
SHIB is built on Ethereum, so gas fees + network congestion can influence SHIB’s intraday ranges.
ETH bullish breakouts often open liquidity for altcoins like SHIB.
4️⃣ COINBASE:SOLUSD — Solana
Not directly correlated but competes for retail meme attention.
If SOL rallies aggressively, retail flows may shift between meme-coins and high-beta L1 assets.
5️⃣ BINANCE:SHIBUSDT (Spot)
Tracks most liquid version of SHIB trading.
If SHIB/USD and SHIB/USDT diverge, it signals USD-index impact or exchange-based liquidity imbalances.
🧭 Summary
This SHIB setup is a momentum-driven bullish opportunity, but smart exits are key due to resistance and overbought traps. Watch DOGE and BTC closely—they are the primary flow leaders determining SHIB’s intraday aggression.
"SHIB Short Opportunity – Quick Heist, Faster Exit!"🔥🦊 SHIB/USD CRYPTO HEIST PLAN – THIEF TRADER STYLE 🚨💰
🔥 Thief OG’s Assemble – Tonight we Rob the SHIBA Vaults 🔥
👑 Dear Ladies & Gentlemen, Fellow Money Thieves, & OG Robbers 🏴☠️💸
Welcome to the Bearish Robbery Plan for SHIB/USD. Strap in, we’re going in with Thief Layering Strategy™ – multiple limit orders to maximize the loot.
📉 ENTRY PLAN – LAYERING STYLE
We don’t enter once… we layer the robbery. Multiple sell-limit orders stacked like a real thief’s toolkit:
💎 (0.00001250)
💎 (0.00001260)
💎 (0.00001270)
💎 (0.00001280)
👉 Add more layers if you want to spread your robbery wide. Remember: thieves don’t knock once, they pick every lock. 🔐
🛑 STOP LOSS (SL) – THIEF ESCAPE HATCH
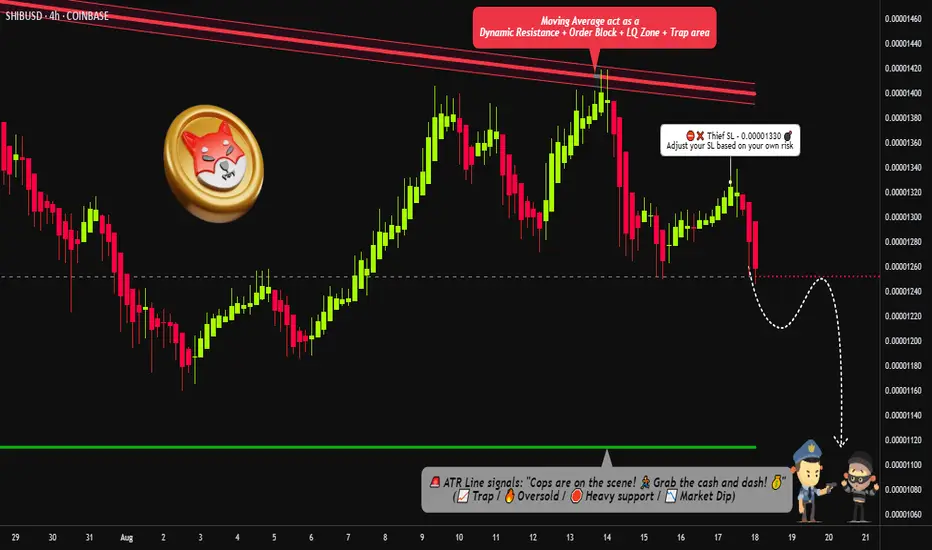
Our Thief SL is parked at 0.00001330 🚨
But hey, every OG knows – adjust your SL based on your risk appetite & robbery style. 🏃♂️💨
🎯 TARGET – POLICE BARRICADE AHEAD 🚔
There’s heavy police resistance around 0.00001400… so don’t get greedy!
🎯 Our loot target is 0.00001120 💰 – grab it, stash it, and disappear before the cops surround the vault.
📜 MASTER HEIST PLAN
❌ Trend: Bearish (Shiba vault is weak & exposed)
🧨 Method: Layered Sell Orders (Limit Entries)
🏴☠️ Risk: Controlled by Thief SL
💰 Reward: Escape with stolen profit @0.00001120
⚠️ Trading Alert: Police patrol = market volatility (news, events). Avoid fresh robberies during major announcements. Use trailing SL to protect your stash.
💖 If you vibe with this Thief Trading Style™, hit that BOOST 🚀 & LIKE ❤️ to power up the robbery crew.
Together, we rob the market, escape clean, and celebrate with champagne & profits. 🥂💵
📌 Disclaimer: This is a Thief-Style Robbery Plan, not financial advice. Rob responsibly.
SHIBUSDT — A Major Move Will Be Decided From This Critical Zone!Overview
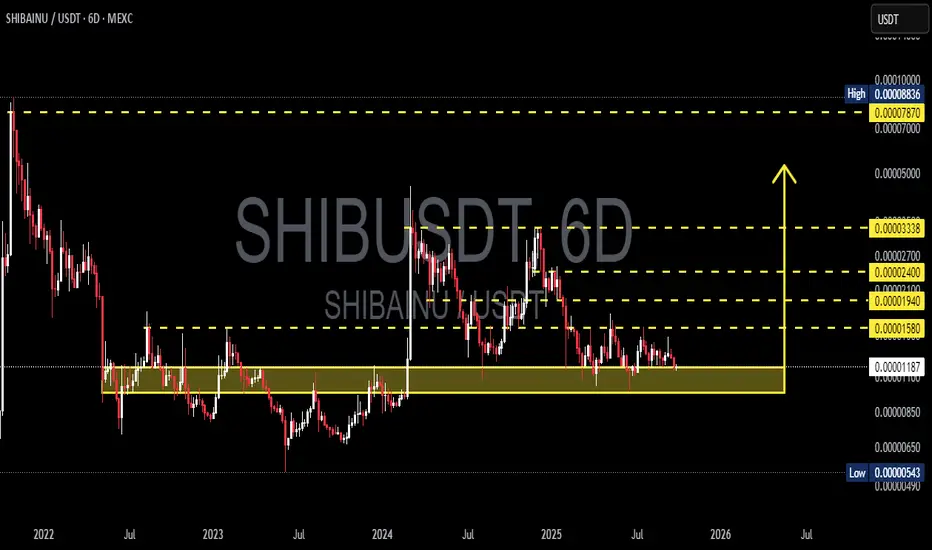
The 6D chart of SHIB/USDT shows a long-term consolidation that has been developing since 2022. Price is once again testing the key demand zone (0.00000850 – 0.00001183), an area that has acted as a strong support multiple times.
This zone is now a true “make or break level” — either SHIB rebounds for a major bullish wave, or it breaks down to much lower levels.
---
Structure & Price Pattern
1. Macro Downtrend
Since the ATH, SHIB has been printing lower highs, showing long-term seller dominance.
Yet, despite selling pressure, the demand zone has held — a sign that large buyers still exist here.
2. Extended Accumulation Zone
The yellow area (0.00000850 – 0.00001183) has acted as a base of accumulation since 2022.
Such prolonged consolidation often precedes explosive moves.
3. Clear Supply Levels
Resistance levels above price:
0.00001580 (initial breakout trigger)
0.00001940 → 0.00002400 → 0.00003338 (progressive bullish targets)
Major supply cluster at 0.00007870 – 0.00008836, which could be a magnet in case of a macro bullish reversal.
4. Volatility Contraction → Imminent Big Move
The 6D candles show a tightening range.
Classic signal of volatility compression, usually followed by a strong breakout or breakdown.
---
Bullish Scenario
Confirmation:
A breakout and 6D close above 0.00001580 with strong volume.
Targets:
0.00001940 → 0.00002400 → 0.00003338.
Ideal sequence:
Accumulation at support → breakout above resistance → retest as new support → rally continuation.
Reward potential: High risk-to-reward setup if the demand zone holds.
---
Bearish Scenario
Confirmation:
A breakdown below 0.00000850 with high volume.
Targets:
First: 0.00000543,
Then: potential new lows if liquidity is drained.
Risk:
If support fails, SHIB could enter a capitulation phase with accelerated downside.
---
Market Interpretation
Optimistic Buyers: See this as a long-term accumulation opportunity.
Cautious Sellers: A breakdown could trigger a steep sell-off.
Neutral Traders: Waiting for confirmed breakout/breakdown before committing larger positions.
---
Conclusion
SHIB is sitting at a critical zone that will define its macro direction into 2025–2026.
Holding support → opens path for multi-level rally.
Losing support → risk of deeper correction.
For long-term investors, this is the area to watch closely.
For swing traders, waiting for clear confirmation is the safer strategy.
---
#SHIB #SHIBUSDT #CryptoAnalysis #TechnicalAnalysis #SupportResistance #CryptoTrading #PriceAction #Accumulation #BreakoutSetup
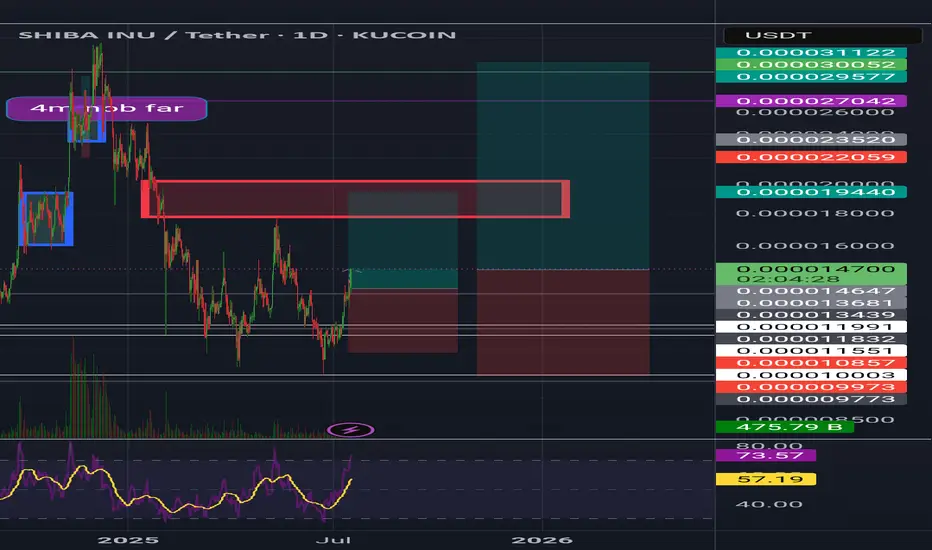
SHIB Sell to BUYBINANCE:SHIBUSDT Market Update:
After a significant downtrend and following a descending trendline on the daily timeframe, SHIB finally broke out and saw an impressive pump.
However, I now anticipate a potential correction from the current level (the red box) down towards the green box. I expect to see strong support in that area, which could then lead to the next bullish leg higher.

SHIB/USDT – Scaling Into a Bullish Breakout with Layered Entries🚀 SHIB/USDT (Shiba Inu) – Day Trade Setup 🐕🔥
📊 Trade Plan: Bullish Momentum
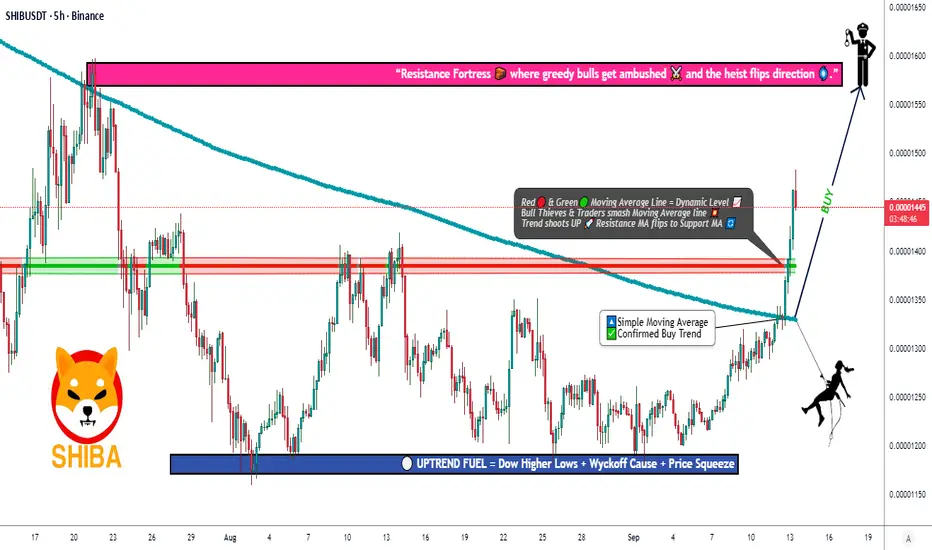
We’re spotting a Simple Moving Average breakout + Ichimoku Kijun confirmation, signaling that Shiba Inu might be gearing up for a bullish push. Momentum traders, this is where the action gets exciting. ⚡
🛠 Entry Plan
Using a layered limit order strategy (stacked entries), which allows better scaling in. Suggested layers below 👇:
0.00001400
0.00001420
0.00001440
0.00001460
(💡 You can increase or adjust the layers based on your own strategy.)
🛡 Stop Loss (Risk Guard)
A potential SL can be placed around 0.00001350, right after the breakout zone.
⚠️ Note: Adjust your SL according to your risk tolerance and personal trading style.
🎯 Target (Exit Strategy)
Upside target is placed at 0.00001580, where strong resistance and possible overbought conditions may appear. This is the "take profit & step out gracefully" zone.
⚠️ Reminder: This is not a fixed TP suggestion—manage your exits based on your own plan.
🔗 Related Pairs to Watch
Shiba Inu often correlates with other meme coins and ETH-related flows:
BINANCE:DOGEUSDT 🐶 (moves in tandem with SHIB sentiment)
BINANCE:PEPEUSDT 🐸 (new-gen meme coin hype correlations)
BINANCE:ETHUSDT 🔑 (Ethereum gas activity impacts SHIB ecosystem)
BINANCE:BTCUSDT 💰 (macro driver of overall crypto risk-on/off)
Watching these pairs together can give more conviction on momentum shifts.
✨ “If you find value in my analysis, a 👍 and 🚀 boost is much appreciated — it helps me share more setups with the community!”
#SHIB #SHIBA #CryptoTrading #Altcoins #MemeCoins #DayTrading #TradingView #Ichimoku #MovingAverage #SHIBUSDT
SHIBUSDTThe BINANCE:SHIBUSDT is moving in a trading range, but it could break either 0.00001300 or 0.00001190 and continue the trend after the breakout. I think it will be bullish because the larger time frame shows an uptrend.

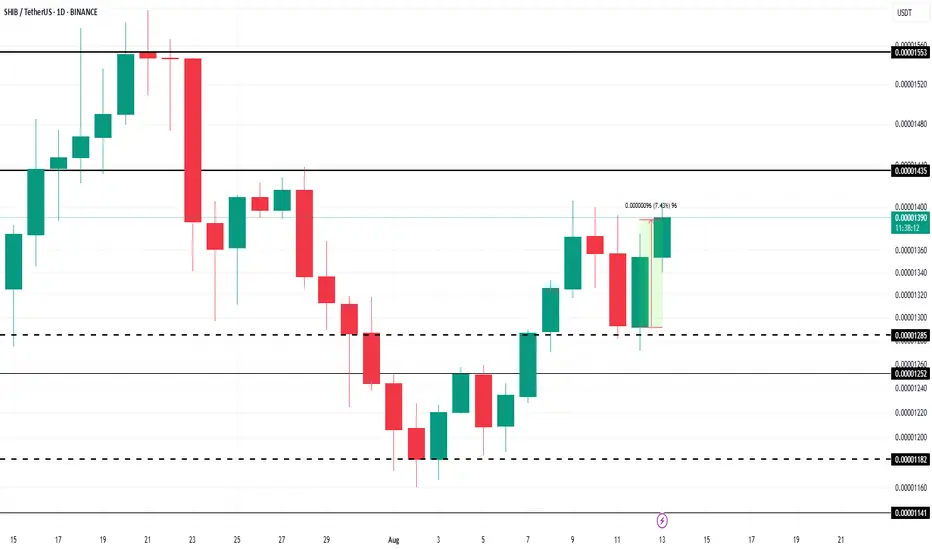
Shiba Inu Sees Heavy Selling at 3-Week Price PeakShiba Inu is up 6.69% in the past week, with the token trading at $0.00001291. The meme coin is attempting to establish $0.00001285 as a support level, holding near its recent peak.
However, maintaining this momentum appears difficult without strong investor conviction. If selling continues, SHIB could drop toward $0.00001252 or even lower to $0.00001182, erasing recent gains.
On the flip side, if Shiba Inu price successfully defends the $0.00001285 support, a rebound may follow. In that case, SHIB could push toward $0.00001391, which would invalidate the bearish outlook and signal renewed strength.

SHIBA +100%?? | BEST Buy OPPORTUNITYSHIBA has been in a downtrend for many weeks.
From here, upside is likely - especially if we look at the consecutive amount of "red" weekly candles (blue on this chart).
A 40% bounce zone is easily possible from this zone. Even at modest, 20% would be ideal:
____________
BYBIT:SHIBUSDT

SHIBUSDT (Daily)🔎 Chart Context
• Pair: SHIB/USDT
• Exchange: MEXC
• Timeframe: 1D (Daily)
• Date: 21 August 2025
This chart shows SHIB trading within a large consolidation range after a significant bearish move earlier in 2025.
📊 Key Observations
1. Macro Structure
• SHIB has been in a sideways range between 0.00001000 (support) and 0.00001597 (resistance) since March 2025.
• The chart highlights this rectangular range, showing repeated liquidity sweeps on both sides.
• Current price: ~0.00001283, sitting in the lower half of the range.
2. Support Zones
• 0.00001160 – 0.00001080 zone: Main demand block, tested multiple times (April, July).
• 0.00001004 – 0.00001028: Deeper liquidity sweep levels; losing this zone risks breakdown.
• These zones are critical for SHIB’s bullish survival.
3. Resistance Zones
• 0.00001362 – 0.00001597 zone: Upper supply boundary of the consolidation.
• 0.00001765 (FVG): Marked upside liquidity gap; a breakout from range would likely target this.
• Beyond that, 0.00001853 – 0.00002000 is the next strong supply zone.
4. Liquidity Behavior
• Below: resting liquidity around 0.00001160 and 0.00001004.
• Above: liquidity pools at 0.00001597 and 0.00001765, making these the primary bullish targets.
• The chart projects both scenarios:
• Bullish breakout above the range toward 0.00001765.
• Bearish breakdown below 0.00001160 toward 0.00001004 or lower.
📈 Bullish Scenario (Higher Probability if 0.00001160 holds)
• SHIB defends 0.00001160 demand and reclaims 0.00001362 mid-range resistance.
• Momentum carries price to:
• TP1: 0.00001597 (range high)
• TP2: 0.00001765 (FVG fill / liquidity sweep)
• TP3 (extension): 0.00001850 – 0.00002000 major supply zone.
• This requires holding above 0.00001160 and rejecting downside liquidity sweeps.
📉 Bearish Scenario (Lower Probability but Risk)
• Price loses 0.00001160 demand with strong volume.
• Next targets:
• 0.00001080 → 0.00001028 (short-term supports)
• 0.00001004 liquidity sweep (major downside magnet)
• A daily close below 0.00001000 confirms a macro bearish breakdown, exposing 0.00000900 and below.
⚡ Trading Plan
• Long Setup (Preferred if support holds):
• Entry: 0.00001160 – 0.00001230 demand zone.
• TP1: 0.00001362
• TP2: 0.00001597
• TP3: 0.00001765
• Stop: Below 0.00001080 or conservative below 0.00001000.
• Short Setup (Only if breakdown confirmed):
• Entry: Retest of 0.00001160 from below.
• TP: 0.00001004 liquidity sweep.
• Stop: Above 0.00001260.
✅ Conclusion
SHIB/USDT Daily is in a consolidation phase between 0.00001000 – 0.00001597.
The most probable scenario is a range-bound accumulation, with bias turning bullish if 0.00001160 holds and price reclaims 0.00001362, targeting 0.00001597 → 0.00001765.
A breakdown below 0.00001160 shifts focus to 0.00001004 liquidity sweep, which would threaten the bullish structure.

How Are Shiba Inu’s Most Profitable Holders Acting Right Now?At the time of writing, BINANCE:SHIBUSDT is trading at $0.00001366 , holding above the local support of $0.00001285. The altcoin has yet to reach the crucial resistance level of $0.00001435, which marks a significant hurdle for its recovery.
The HODL Cave analysis reveals that BINANCE:SHIBUSDT holders who have held their tokens for 18 to 20 months are currently the most profitable, second only to the all-time low (ATL) buyers. These long-term investors are seeing median profits ranging from 1.54x to 1.57x .
The 2-Year Mean Coin Age indicator, which tracks the movement of tokens over the past two years, is currently showing an uptick. Over the past two months, only one instance of selling has been recorded, highlighting the ongoing resilience of BINANCE:SHIBUSDT long-term holders .
Breaking through $0.00001435 is essential for BINANCE:SHIBUSDT to make its way to $0.00001553. Reaching this level would signal the recovery of July's losses and indicate that SHIB is back on track for further gains. The support from the most profitable holders is likely to play a pivotal role in helping SHIB break through this resistance.
However, if BINANCE:SHIBUSDT faces heavy selling pressure from skeptical holders or retail investors, the price could fall below the support of $0.00001252 . This would likely trigger a decline towards $0.00001182 or lower, invalidating the bullish thesis and signaling further downside for the altcoin.
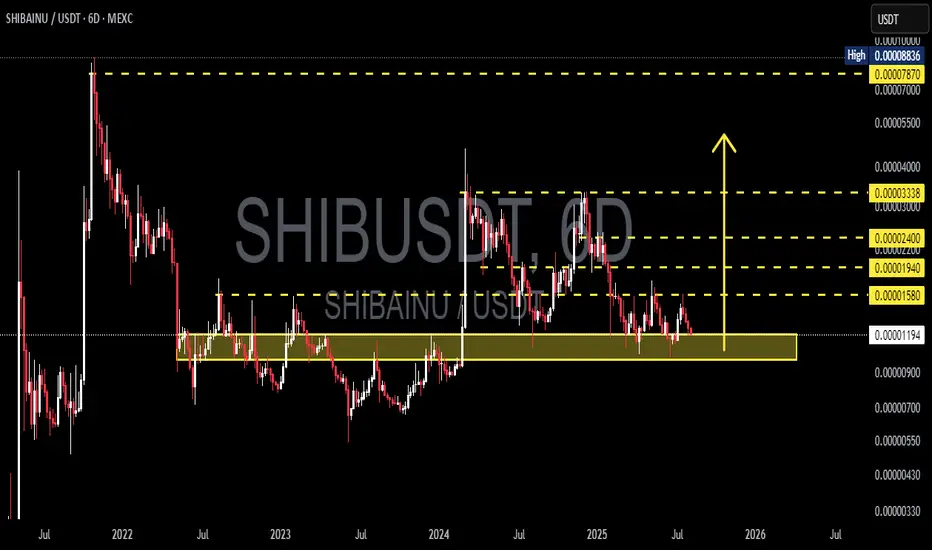
Shiba inuShib usdt Daily analysis
Time frame daily
First target = 0 00001944$
Risk rewards ratio =2 👈👌
Second target = 0.00003
Risk rewards ratio >3.5 👈 👌
The red box that you can see on the screen is very important resistance area.
If Shiba breaks it strongly, second target will be reach
SHIBA/USDT Testing the Make-or-Break Zone — End of Accumulation?🧠 Overview:
SHIBA/USDT is once again testing a critical support zone that has held strong since early 2022. This area isn’t just a technical level — it represents a long-term accumulation zone where buyers have consistently stepped in.
What happens next could define SHIB's mid to long-term trend. Will we see a major bullish reversal, or is a breakdown and deeper correction looming?
---
📊 Technical Breakdown:
Key Demand Zone (Major Support):
🔸 0.00001090 – 0.00001190 USDT
This zone has been tested multiple times over the past two years. It remains the last major stronghold for bulls. A breakdown here could trigger panic selling.
Important Resistance Levels (Bullish Targets):
🔹 0.00001580 → Initial resistance
🔹 0.00001940 → Previous distribution area
🔹 0.00002400 → Strong psychological level
🔹 0.00003338 → Mid-term bullish target
🔹 0.00007870 – 0.00008836 → High timeframe supply zone and potential long-term profit-taking area
Market Structure:
🔸 Price remains inside a long-term horizontal consolidation range
🔸 No clear breakout yet, but early signs of buyer interest are forming
🔸 Possibility of forming a double bottom or accumulation breakout if bullish momentum strengthens
---
📈 Bullish Scenario:
✅ Price holds above 0.00001190 support
✅ Breakout above 0.00001580 = early trend reversal signal
✅ Bullish confirmation with volume increase
✅ Mid-term targets: 0.00001940 → 0.00002400 → 0.00003338
✅ Long-term potential: Retest of 0.00007870 – 0.00008836 (key supply zone)
---
📉 Bearish Scenario:
❌ Breakdown below 0.00001090 = major bearish signal
❌ Potential drop toward lower zones:
▪️ 0.00000900
▪️ 0.00000700
▪️ 0.00000550 (next key support zone)
❌ Price structure shifts to lower lows, indicating trend weakness and potential distribution phase
---
🧩 Pattern Insights:
📌 Market showing signs of Sideways Accumulation for over 1.5 years
📌 Could be a Re-Accumulation Phase before a major breakout
📌 Current movement resembles a Wyckoff-style Spring, which often precedes an upward expansion
---
📌 Conclusion:
SHIB is standing at a major inflection point. If buyers continue to defend this support zone, it could mark the beginning of a new bullish cycle. However, if this level breaks, further downside is highly likely.
This is a moment of calm before potential volatility — stay alert and watch volume + price action closely.
#SHIB #SHIBUSDT #CryptoBreakout #SupportZone #AltcoinAnalysis #SHIBAInu #TechnicalAnalysis #AccumulationPhase #WyckoffMethod #CryptoBullish #CryptoBearish
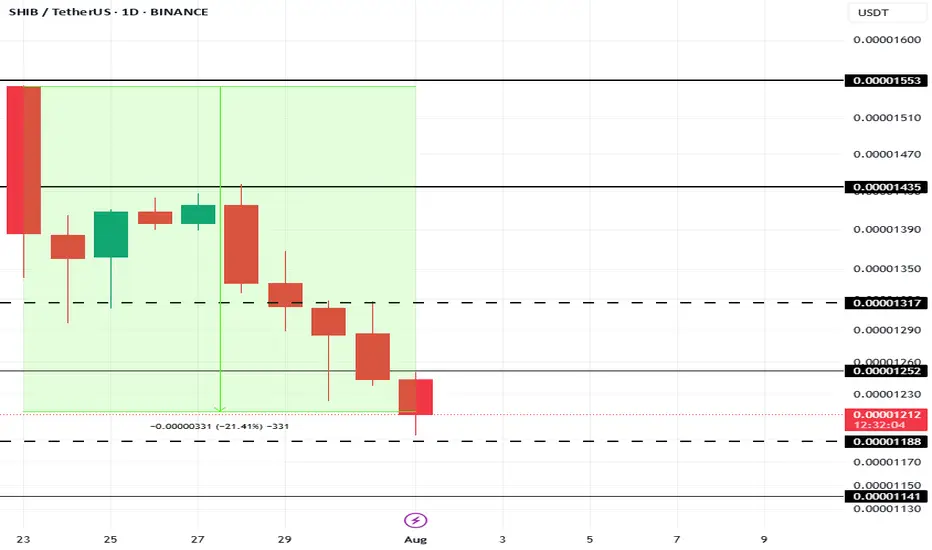
This Is The Cause Of Shiba Inu Price’s 21% Fall In 10 DaysAt present, BINANCE:SHIBUSDT price is sitting at $0.00001210, down 21% over the last 10 days . The drop in Shiba Inu's price can be traced to a sharp decline in the number of new addresses interacting with the token.
In the last 10 days, the number of new addresses has decreased by nearly 40% . This sudden exit of new investors indicates waning confidence in BINANCE:SHIBUSDT price potential, particularly after an extended rally earlier in the year.
If this trend continues, BINANCE:SHIBUSDT could lose the critical support level of $0.00001188, pushing the price down to $0.00001141 or potentially lower. However, if SHIB manages to hold onto its $0.00001188 support level, there is a possibility of recovery.
A bounce from this level could push BINANCE:SHIBUSDT price up to $0.00001317 . Securing this level as support would create a bullish scenario, invalidating the bearish thesis and offering hope for further price growth in the near future.
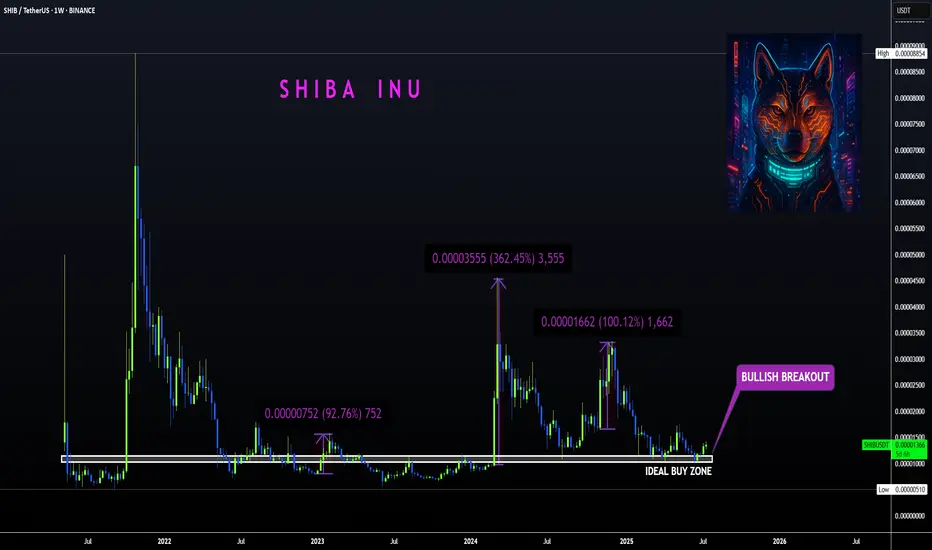
SHIBA | Bullish Breakout ABOVE Ideal Buy ZoneBINANCE:SHIBUSDT
Shiba is know to make big increases in short periods of time... that's why we love it!
The tricky thing about SHIBA is that the pumps can be unpredictable so the best way to ensure a position is to buy as low as possible to the ideal buy zone.
In the weekly timeframe, the technical indicators are not quite bullish yet. The moving averages is still above the price, meaning the bulls have yet to take full control of the price in lower timeframes.
The same can be said for the daily, although we are seeing progress as the 200d moving averages have been reclaimed:
Here’s Why Shiba Inu Price’s 10% Rise Entails $50 Million LossesAt the time of writing, BINANCE:SHIBUSDT price is $0.00001407, sitting just below the resistance level of $0.00001435. The altcoin has been facing mixed signals, with both bearish and bullish factors playing a role in its price action. The key resistance level of $0.00001435 needs to be broken for a potential recovery.
The liquidation map shows a fascinating development: if BINANCE:SHIBUSDT recovers the 10% losses it has sustained by reaching $0.00001553, it could trigger over $52 million worth of short liquidations . Short sellers have been betting on a decline, but if SHIB rebounds, these traders will face considerable losses.
If BINANCE:SHIBUSDT continues to hover within the consolidation range of $0.00001435 and $0.00001317 , traders will remain safe from liquidation risks. This sideways movement will keep the altcoin within a neutral zone, avoiding drastic price changes in the immediate term.
However, if BINANCE:SHIBUSDT price manages to break the resistance at $0.00001435 and flips it into support, SHIB could potentially climb back to $0.00001553. This would mark a 10% recovery , invalidating the current bearish sentiment and shifting the outlook to a more optimistic tone.

Shiba Inu Whales Amass 4.66 Trillion SHIB As Price Falls 12%BINANCE:SHIBUSDT price is currently trading at $0.00001353, down 11.5% over the past 24 hours . The altcoin is holding above the support level of $0.00001368.
The large holders' netflow for BINANCE:SHIBUSDT has recently spiked, reaching a two-month high. In the last 24 hours, 4.66 trillion SHIB were accumulated by addresses holding at least 0.1% of the circulating supply. These whales, who have collectively invested $63.7 million , are betting on a price rebound.
A successful bounce off $0.00001317 would likely pave the way for further price appreciation, potentially pushing BINANCE:SHIBUSDT to $0.00001553 . Securing this level as support could mark a recovery of today’s losses and initiate a new uptrend, provided the broader market conditions remain favorable.
On the other hand, if BINANCE:SHIBUSDT falls below the support of $0.00001317 due to profit-taking, the meme coin could slip to $0.00001188 . This would invalidate the bullish thesis and further reduce investor confidence. The next few days will be crucial in determining if SHIB can maintain its current support levels .

SHIBA INU Heist Plan: Rob the Market, Ride the Bull!💎🚨 "SHIBA INU Crypto Heist Plan: Rob the Market or Get Robbed!" 🚨💎
Thief Trading Style | SHIBA/USD | Bullish Analysis | DCA Heist Strategy | Swing & Scalping Masterplan
🌍 Hey World! 👋 Hola, Ola, Bonjour, Hallo, Marhaba! 🌟
To all the Market Robbers, Bulls in Disguise, and Silent Money Movers — welcome to Thief Trading’s Heist Blueprint 💼🔫 for SHIBA INU vs. USD!
📊 Chart Analysis Breakdown:
Based on my Thief Trading™ Style – a fusion of technical setups, fundamentals, and macro crime-scene evaluations – we’re executing a bold LONG setup targeting a bullish breakout. 🕵️♂️💥
This heist involves breaking past the Police Resistance Checkpoint (moving average red zone), where bearish forces and retail roadblocks stack up.
💹 Heist Entry Strategy:
📍Entry Idea: “The vault's cracked open!”
Longs can be triggered at market price – but wise robbers use precision:
⏱ Place Buy Limit Orders near 15min or 30min swing low pullbacks.
💼 DCA / Layered Entry Method is advised – the more stealthy the approach, the bigger the bag.
🛑 Risk Management:
📌Stop Loss (SL):
Set near recent swing highs/lows on the 1D candle wick zone.
🔒 Example SL: 0.00001300
Remember, SL should scale with your risk appetite, lot size, and number of entries.
🎯 Thief Target:
📍 Target: 0.00001770 or jump off early if the cops (market sellers) start closing in.
You don’t need to wait for the vault to be empty — grab what you can and exit clean.
🔍 Scalper's Shortcut:
Only long-side scalps are valid here.
💰 Big pockets = Fast Entry
💼 Small pockets = Join the Swing Gang
Use Trailing SL to guard your loot and stay agile in the escape.
🧠 Why This Heist? (Fundamentals Insight):
SHIBA/USD is heating up 🔥 due to:
Bullish sentiment in crypto
On-chain activity uptick
Retail momentum shifts
Intermarket cues lining up
📚 Dive deeper into:
📰 News Impact
📊 COT Reports
🔗 On-chain metrics
🧭 Sentiment & Intermarket Guidance
⚠️ Risk Zone Alert:
🚨 News events = Market Chaos
➡️ Avoid fresh entries near news drops
➡️ Use Trailing SLs to lock profits & manage active positions wisely
🙌 Support the Heist Movement:
🔥 Hit the BOOST button if you vibe with the Thief Trading style!
Every boost helps power the team to deliver more precision setups, market heists, and easy-to-follow strategies daily. 💸💎💪
📌 Important Disclaimers:
This is a general market outlook and not financial advice. Always analyze based on your own system and risk tolerance. Markets shift fast — stay updated and adapt.
💬 Comment below if you're on the crew. Let's rob the market together — one chart at a time.
🚀 See you in the next heist, Money Makers! Stay silent, move smart, and steal success! 🤑🐱👤🏆
SHIBUSDT🕯 The key resistance level, identified as the best resistance for a break and pump, stands at 0.0000135, with a potential price increase to 0.00001567 if breached, serving as the next target (Pullback level). On the support side, the main level is observed at 0.0000115, and should the price fall below this, it may decline further to the lower Major Level of 0.0000100.
🔽 Resistances:
Main resistance level: 0.0000135 (potential break for pump)
Next target (Pullback level): 0.00001567
🔼 Supports:
Main support level: 0.0000115
Lower level (Major Level): 0.0000100
⚠️Contorl Risk management for trades.

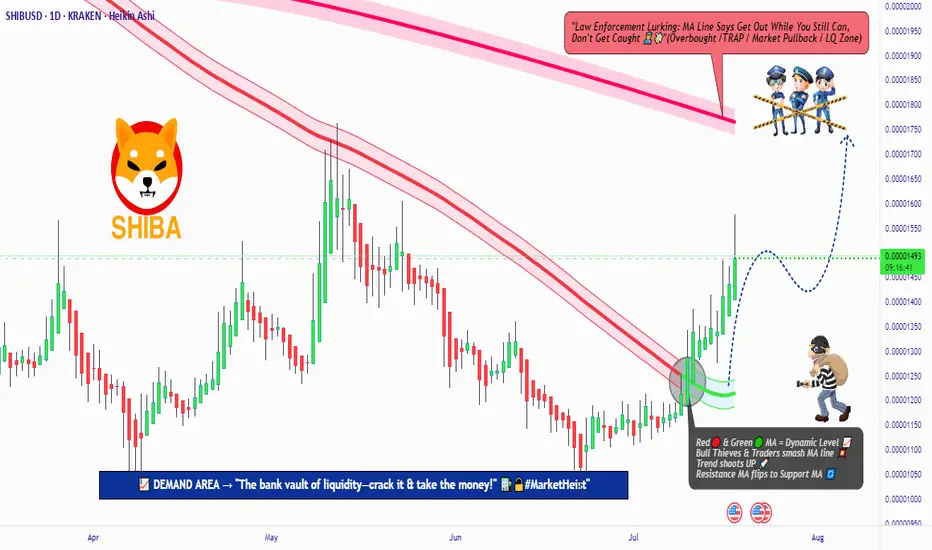
SHIB Long Entry Heist Plan – Bullish Setup in Trap Zone🦹♂️💸 SHIB INU Market: The Silent Heist Plan Is Live! 🚨💰
Thief Trading Style | Swing & Scalping Blueprint | High-Risk Zone Masterplan
🌍 Hello Global Robbers & Market Raiders! 🤑💥
Welcome to another secret mission straight from the vault of Thief Trading Style. We're eyeing the SHIB INU Crypto Market, and the time has come for a stealthy bullish strike!
🧠 The Blueprint – Operation SHIB-INU Break-In
We’re executing a bullish move towards the Yellow MA Zone, a high-risk territory filled with consolidations, trap setups, and a potential reversal. The battlefield is tight, but the rewards are sweet for those who play it smart. 🎯💸
🔑 ENTRY STRATEGY – “Vault Access Granted” 🚪📈
💥 Entry Type: Buy/swing
💡 Zone: Pullback entries near swing lows (within 15–30m timeframes)
🕵️♂️ Stealth Entry – Wait for candle signals or limit orders near key liquidity zones.
🛡️ STOP LOSS – “Secure the Exit” 🛑🔐
📌 Placed just below recent swing low at 0.00001050 (30m TF)
🎯 SL adapts to your lot size, trade size, and number of entries.
🏴☠️ TARGET – “Escape Before Alarms Go Off” 🎯💨
💰 Target: 0.00001350
⏳ Optional: Trail your SL and exit on signs of exhaustion.
💼 Scalpers’ Side Mission – “Quick Loot Runs” 🧲⚡
Scalp only on the Long side; use trailing SLs and follow the robbers’ path.
Big wallets? Enter now. Small bags? Wait and follow the swing wave. 🕶️🚀
🧠 Strategic View
Market sentiment remains bullish, but the zone is volatile.
Use macro analysis, COT data, on-chain insights, and sentimental clues for confirmation. 🧠📊
⚠️ Important Notice – Market Hazards Ahead 📉📰
🔔 Watch out for major news releases!
✔️ Avoid new trades during high-impact events.
✔️ Use trailing SLs to guard profits.
✔️ Monitor market developments regularly – stay one step ahead.
💖 Support the Mission
If you love this robbery blueprint, 💥Hit the Boost Button💥 and join the Thief Trading crew for more profitable adventures! Every click fuels our next plan. 🏆💪❤️
📢 See You in the Next Raid!
Stay tuned for more high-stakes missions and daily loot setups!
📲 Follow for the next crypto break-in.
🐱👤🚨 Thief Traders never sleep... we scan, we strike, we secure the bag.

SHIBUSDT Bounces Strongly from Wedge SupportSHIBUSDT is forming a bullish falling wedge on the weekly chart, showing signs of reversal after bouncing from key support at 0.00001000. A breakout above the wedge resistance could trigger strong upside momentum in the coming weeks.
Entry at current price
Stop Loss: .00000890 (Below the Wedge Support)
TP1: 0.00001700
TP2: 0.00003100
TP3: 0.00007000
$1000SHIBUSDT CRYPTOCAP:SHIB

SHIBUSDT: Price Weakness & Your Next Short OpportunityMy focus is on SHIBUSDT, and the picture is clear: price is weak. This isn't a market where buyers are proving their strength; in fact, the opposite is true.
Most traders are confused by volatility. But you need to see the real opportunity. My analysis points to this: both red boxes I've marked on the chart are prime zones for short opportunities. They represent powerful selling regions.
Here's why, and your plan for action:
Red Box Power: These zones are where sellers are truly in control. I'm actively looking for price to engage with these areas.
Green Box Uncertainty: As for the green box, its strength is questionable. I'm not confident it will hold as reliable support for a bullish move, reinforcing my overall bearish view.
Confirm the Downside: Your decisive move comes with confirmation:
Volume Footprint: I'll be scrutinizing the volume footprint to see clear distribution from sellers.
CDV (Cumulative Delta Volume): Look for CDV to turn deeply negative, affirming seller dominance.
LTF Breakdowns: On the low timeframes (LTF), demand concrete breakdowns. Price must fail, retest the red boxes as resistance, and then continue lower. This is your undeniable signal.
My general bias remains bearish. I only trade assets showing a sudden increase in volume, and while this is a short setup, the volume dynamics confirming weakness are what I'm seeking.
Keep a sharp eye on those red boxes. If these confirmations line up, you'll uncover precise, high-probability short entries. This is where smart, confirmed decisions are made.
📌I keep my charts clean and simple because I believe clarity leads to better decisions.
📌My approach is built on years of experience and a solid track record. I don’t claim to know it all but I’m confident in my ability to spot high-probability setups.
📌If you would like to learn how to use the heatmap, cumulative volume delta and volume footprint techniques that I use below to determine very accurate demand regions, you can send me a private message. I help anyone who wants it completely free of charge.
🔑I have a long list of my proven technique below:
🎯 ZENUSDT.P: Patience & Profitability | %230 Reaction from the Sniper Entry
🐶 DOGEUSDT.P: Next Move
🎨 RENDERUSDT.P: Opportunity of the Month
💎 ETHUSDT.P: Where to Retrace
🟢 BNBUSDT.P: Potential Surge
📊 BTC Dominance: Reaction Zone
🌊 WAVESUSDT.P: Demand Zone Potential
🟣 UNIUSDT.P: Long-Term Trade
🔵 XRPUSDT.P: Entry Zones
🔗 LINKUSDT.P: Follow The River
📈 BTCUSDT.P: Two Key Demand Zones
🟩 POLUSDT: Bullish Momentum
🌟 PENDLEUSDT.P: Where Opportunity Meets Precision
🔥 BTCUSDT.P: Liquidation of Highly Leveraged Longs
🌊 SOLUSDT.P: SOL's Dip - Your Opportunity
🐸 1000PEPEUSDT.P: Prime Bounce Zone Unlocked
🚀 ETHUSDT.P: Set to Explode - Don't Miss This Game Changer
🤖 IQUSDT: Smart Plan
⚡️ PONDUSDT: A Trade Not Taken Is Better Than a Losing One
💼 STMXUSDT: 2 Buying Areas
🐢 TURBOUSDT: Buy Zones and Buyer Presence
🌍 ICPUSDT.P: Massive Upside Potential | Check the Trade Update For Seeing Results
🟠 IDEXUSDT: Spot Buy Area | %26 Profit if You Trade with MSB
📌 USUALUSDT: Buyers Are Active + %70 Profit in Total
🌟 FORTHUSDT: Sniper Entry +%26 Reaction
🐳 QKCUSDT: Sniper Entry +%57 Reaction
📊 BTC.D: Retest of Key Area Highly Likely
📊 XNOUSDT %80 Reaction with a Simple Blue Box!
📊 BELUSDT Amazing %120 Reaction!
📊 Simple Red Box, Extraordinary Results
📊 TIAUSDT | Still No Buyers—Maintaining a Bearish Outlook
📊 OGNUSDT | One of Today’s Highest Volume Gainers – +32.44%
📊 TRXUSDT - I Do My Thing Again
📊 FLOKIUSDT - +%100 From Blue Box!
📊 SFP/USDT - Perfect Entry %80 Profit!
📊 AAVEUSDT - WE DID IT AGAIN!
I stopped adding to the list because it's kinda tiring to add 5-10 charts in every move but you can check my profile and see that it goes on..

Shiba Inu Crypto: A Useless Coin That Can Still Make You RichHey everyone, welcome back to a new supply and demand crypto analysis. Today, I will analyse one of the most unexpected — but potentially lucrative — investment opportunities in the crypto space right now: Shiba Inu Metaverse crypto.
Yeah, I know what you’re thinking… “Isn’t Shiba Inu just another meme coin?”
And yes, fundamentally, it’s not trying to solve world hunger or revolutionise finance. But guess what? You don’t need a coin to be helpful to make money from it.
All you need is to understand price action and supply and demand. That’s it.
What is Shiba Inu?
So let’s break it down. Shiba Inu started as a meme — a direct competitor to Dogecoin. It’s an ERC-20 token on the Ethereum network with a massive circulating supply and a huge following. Over time, it has evolved and launched its own ecosystem — including Shibarium, SHIB: The Metaverse, and other utilities.
But let’s be real: Shiba Inu is not about real-world utility. It’s about speculation, community hype, and timing the market right based on simple but powerful trading concepts.
Daily Timeframe is Trending UP
Right now, things are shifting in our favour on the daily timeframe. We’ve just entered an uptrend — a key change in market structure — and more importantly, we’ve got a new imbalance forming around $0.00001320. This is the next key level where we’re waiting to re-enter the market.
Why wait? Because smart investors don’t chase candles. They wait for the price to return, where demand will likely kick in again. That level is $0.00001320. Once price returns there and confirms demand, we buy — and we ride the next wave.
