SHIB/USDT - Critical Support Zone - Reversal or Breakdown?SHIB/USDT on the 3-Day (3D) timeframe remains in a medium-to-long-term bearish structure. Since the previous peak, price has consistently formed lower highs and lower lows, confirming strong seller dominance. Currently, price is trading near a major historical support zone, making this area crucial for determining the next directional move.
---
Pattern Explanation
Descending Trendline (Bearish Trendline)
The yellow diagonal line represents a well-respected descending trendline, connecting multiple lower highs. As long as price remains below this trendline, the overall market structure stays bearish.
Bearish Continuation Structure
Price action shows weak corrective rebounds, suggesting that every upside move is still being used as a selling opportunity.
Horizontal Key Levels (Supply & Demand Zones)
The horizontal yellow levels mark important historical supply and demand zones, where previous supports have now turned into resistances.
---
Key Levels
Resistance Zones:
0.00001120
0.00001400
0.00001550
0.00002100
0.00002430
0.00003300 (Major Resistance / Previous High)
Support Zones:
0.00000840 (Current Minor Support)
0.00000678 (Major Low / Strong Demand Area)
---
Bullish Scenario
Price holds firmly above the 0.00000678 – 0.00000840 support zone
Formation of a higher low on the 3D timeframe
A confirmed breakout and close above the descending trendline
Additional bullish confirmation if price reclaims 0.00001120
Bullish Targets (Step-by-Step):
0.00001120
0.00001400
0.00001550
0.00002100
This scenario would indicate a medium-term trend reversal, but strong volume confirmation is still required.
---
Bearish Scenario
Price fails to hold above 0.00000678
Strong breakdown and candle close below the major support
Continuation of the lower-low structure
Bearish Targets:
0.00000510
0.00000425 (Extreme demand zone / potential capitulation area)
If this scenario plays out, SHIB may enter a bearish extension phase with sustained selling pressure.
---
Conclusion
SHIB/USDT is currently trading at a critical decision zone.
As long as price remains below the descending trendline, the primary bias stays bearish.
However, this lower support region could also act as a long-term accumulation base if a valid structural breakout occurs.
Waiting for clear price action confirmation is highly recommended, especially on higher timeframes like 3D.
#SHIB #SHIBUSDT #CryptoAnalysis #TechnicalAnalysis #Downtrend #Altcoin #MarketStructure #SupportResistance #BearishTrend #PotentialReversal
Shibusd

SHIBUSD Bullish Structure Aligning With Market Flow🚀 SHIBA INU (SHIB/USD) - Swing Trade Profit Pathway Setup 🎯
Current Market Data ✅
Real-Time Price: $0.00000827 USD (+14.85% 7-day momentum)
Market Cap: $4.87B (Ranking #25)
24h Volume: $133.6M USD
Status: Bullish momentum breakout zone 📈
🎯 TRADE SETUP OVERVIEW
Asset: SHIBA INU vs U.S DOLLAR (SHIB/USD)
Strategy: Swing Trade - Simple Moving Average Breakout
Trade Type: BULLISH CONTINUATION 🔝
Timeframe: Multi-day swing setup
📍 ENTRY STRATEGY
Entry Approach: Flexible zone entry
✅ ANY PRICE LEVEL ENTRY - Multiple entry opportunities on breakout confirmation
Primary Entry: Above Hull MA (HMA) breakout zone
Secondary Entry: Dips into support after initial breakout
Optimal Entry: Confirmed 4H HMA golden cross + volume surge
Entry Signal Confirmation:
Hull Moving Average (HMA) slope turns bullish ✓
Volume increases above 20-day average ✓
Price breaks & holds above key resistance levels ✓
⛔ STOP LOSS (SL) - RISK MANAGEMENT
SL Placement: $0.00000750
Placement Rule: AFTER Hull MA breakout confirmation
Reasoning: Thief SL = Security line against false breakouts
⚠️ Important: Your stop loss placement is YOUR OWN CHOICE & RESPONSIBILITY. This is not financial advice. Adjust SL based on your personal risk tolerance and trading account size. Many traders adjust SL to 2-3% below entry after confirmation.
🎁 PROFIT TARGET (TP) - EXIT STRATEGY
Primary Target: $0.00000900
Secondary Target: $0.00001019 (Technical golden cross)
Tertiary Target: $0.00001280 (6-month upside potential)
Why These Levels?
Hull MA = POLICE BARRICADE - Acts as dynamic support/resistance barrier
$0.00000900 zone = Oversold trap recovery + strong correlation support
Previous resistance = Future support principle applies here
Risk/Reward Ratio = 1:2+ (Excellent for swing traders)
⚠️ Important: TP selection is YOUR OWN CHOICE & RESPONSIBILITY. Lock in profits at levels that align with YOUR trading strategy. Consider taking partial profits (25-50%) at primary target, then trailing SL on remainder.
📊 TECHNICAL ANALYSIS FACTORS
Bullish Indicators ✅
RSI Momentum: Currently 57.05 (Neutral-Bullish zone)
Moving Averages: HMA slope turning positive
Volume Profile: Exchange inflows declining = Accumulation phase
7-Day Performance: +14.20% outperforming crypto market (+4.50%)
24-Hour Action: Strong buying pressure above support levels
Whale Activity: 167.99B SHIB ($1.18M) exited exchanges on Dec 31 = Institutional accumulation signal
Risk Factors ⚠️
Large circulating supply (589.24 trillion SHIB) = Price scaling challenges
Daily burn rate slowing = Deflationary pressure reduced
September Shibarium bridge exploit = Some ecosystem trust issues
Anonymous development team = Leadership transparency concerns
🔗 RELATED PAIRS TO WATCH (Correlation Analysis)
Positive Correlations - Follow SHIB Moves:
1. DOGE/USD (Dogecoin) 🐕
Correlation Index: +0.85
Reason: Meme coin ecosystem + retail sentiment driver
Action: If DOGE breaks $0.20, expect SHIB breakout confirmation
Watch Level: $0.20-$0.22 resistance zone
2. ETH/USD (Ethereum) ⛓️
Correlation Index: +0.70
Reason: SHIB runs on Ethereum layer-2 (Shibarium) - Direct network dependency
Action: ETH strength = Shibarium efficiency = SHIB upside
Watch Level: ETH above $3,500 = Bullish for SHIB ecosystem
Current ETH Price: $3,123.74 (+4.06% momentum)
3. BTC/USD (Bitcoin Dominance) 👑
Correlation Index: +0.69
Reason: Alt-season driver - When BTC rallies, alts follow
Action: BTC above $90k = Alt coin money rotation confirmed
Watch Level: Bitcoin dominance below 55% = Altcoin strength signal
Current BTC Price: $89,904.63 (+1.45%)
4. SOL/USD (Solana) 🚀
Correlation Index: +0.65
Reason: Layer-2 network competition + ecosystem adoption race
Action: SOL weakness = Potential SHIB strength divergence
Watch Level: SOL support at $130-$135 zone
Current SOL Price: $132.51 (+4.57%)
5. SHIBARIUM (BONE/USD) 🦴
Correlation Index: +0.95 (Highest correlation - Direct ecosystem token)
Reason: Governance token + network utility token for Layer-2
Action: BONE strength = Shibarium adoption = SHIB ecosystem health
Watch Level: BONE above $0.85 = Strong ecosystem signal
Action: Track Shibarium RPC migration completion (Q1 2026)
6. Total Cryptocurrency Market Cap
Correlation Index: +0.63
Reason: Risk-on/risk-off sentiment across all alts
Action: Total crypto market cap above $2.5T = Favorable SHIB trading
Watch Level: Watch for macro capitulation/recovery phases
📰 FUNDAMENTAL & ECONOMIC FACTORS (Real-Time Data - Jan 4, 2026)
BULLISH CATALYSTS FOR 2026:
🔧 Shibarium L2 Technical Upgrades (Upcoming Q1-Q2 2026)
Zama FHE Privacy Integration: Q2 2026 launch confirmed
Brings on-chain privacy & confidential smart contracts
Makes Shibarium competitive with privacy-focused chains
Estimated Impact: +15-25% ecosystem value growth if executed
RPC Network Migration: Early 2026 (post-security audit)
Decentralizes network (removes single point of failure)
Increases trust post-September bridge exploit
Improves transaction reliability & developer confidence
AI Technical Paper Release: Q1 2026
Partnership announcements with NVIDIA & Alibaba Cloud
Positions SHIB in AI + blockchain convergence trend
Enterprise adoption narrative strengthens
Shibarium Layer-3 Rollout: Mid-2026
Faster transactions, multi-currency gas fees
Improves UX for retail traders & developers
Adoption potential + volume increase expected
💰 Market Sentiment Shifts (Early 2026 Data)
Meme Season Starting: SHIB +17.95% since Jan 1, 2026
First green weekly candle in 2026
Retail FOMO entering the space = Volatility opportunity
Momentum traders accumulating positions
Whale Accumulation Signals:
Exchange outflows: 167.99B SHIB ($1.18M) on Dec 31
Institutional buyers repositioning
Futures open interest +9.39% = Leveraged long positioning
Derivatives Market Heating:
Open interest: +20% surge in early 2026
Indicates trader positioning for breakout
Volume concentration = Price move likely
⚖️ Regulatory & Macroeconomic Factors:
Positive Developments:
CLARITY Act Potential: Crypto regulatory framework clarity could unlock institutional capital
Coinbase Regulated SHIB Futures: Launched - Legitimacy + retail access
Crypto Market Recovery: Bitcoin +1.45%, Ethereum +4.06% - Broad-based strength
Lower Fed Rate Expectations: 17.7% odds of January rate cut = Liquidity increase favors risk-on assets like SHIB
Risk Factors to Monitor:
SEC Scrutiny: 60% of altcoins under review globally for potential restrictions
September Shibarium Exploit: K9 Finance issued Jan 6, 2026 deadline for full restitution
If not resolved: May trigger ecosystem departures
If resolved: Major bullish catalyst + confidence restoration
Anonymous Leadership: Shytoshi Kusama silent since early December
Communication concerns post-exploit
2026 focus on "repair, focus & building to last" (per dev Kaal Dhairya)
Less hype marketing = More serious infrastructure focus (Could be Bullish long-term)
Supply Inflation Risk:
589.24 trillion tokens in circulation
Daily burns slowed to ~3.2M SHIB (from billions earlier)
Price scaling challenges without massive adoption
🎯 TRADE PROBABILITY FACTORS
Bullish Case: 65% Probability
✅ Momentum breakout confirmed (7-day +14.20%)
✅ Whale accumulation signals strong
✅ Multiple 2026 technical upgrades lined up
✅ Broader crypto market recovery supporting altcoins
✅ Meme season retail FOMO entering
Bearish Case: 35% Probability
⚠️ Large circulating supply limits upside scaling
⚠️ Regulatory headwinds could cause delisting risk
⚠️ Ecosystem restitution deadline (Jan 6) = Event risk
⚠️ Leadership transparency issues post-exploit
⚠️ Failed to rally with Bitcoin's 2025 surge = Relative weakness
💡 TRADER NOTES & STRATEGY TIPS
For Swing Traders (3-14 days holding):
Enter zones: First breakout above HMA + confirmed volume
Scale in: Use 3 equal entries on dips within the trend
Take profits: 50% at $0.00000900 (secure gains), 30% at $0.00001019, hold 20% for trend extension
Use alerts: Set price alerts at key technical levels to avoid emotional decisions
Risk/Reward: Maintain 1:2+ ratio minimum before entering
Risk Management Checklist:
Position size: Only risk 1-2% of account per trade
SL placement: Confirmed after breakout (NOT before)
TP scaling: Don't try to catch "the top" - take profits systematically
Market context: Check Bitcoin dominance + overall crypto sentiment before entry
Stop loss trails: Move SL to breakeven after +50% gain minimum
Event Calendar for SHIB Traders (Q1 2026):
Jan 6, 2026: K9 Finance ecosystem restitution deadline (Event risk)
Q1 2026: Shibarium RPC migration completion expected
Q1 2026: AI technical paper release with NVIDIA/Alibaba details
Q2 2026: Zama FHE privacy upgrade rollout begins
Mid-2026: Shibarium Layer-3 Alpha launch
⚠️ DISCLAIMER & RISK ACKNOWLEDGMENT
IMPORTANT - READ CAREFULLY:
This analysis is based on technical setups and market data AS OF JANUARY 4, 2026. This is NOT financial or investment advice. SHIB is a highly volatile cryptocurrency with meme-coin origins.
🚨 Risks involved:
Cryptocurrency markets operate 24/7 with extreme volatility
SHIB's large circulating supply presents scaling challenges
Regulatory decisions could impact value substantially
Past performance does not guarantee future results
You can lose your entire investment
🎬 ACTION CHECKLIST FOR TRADERS
Confirm Hull MA breakout on 4-hour timeframe
Wait for volume surge above 20-day average
Enter on breakout confirmation + hold above HMA
Place SL at $0.00000750 (AFTER breakout)
Set TP alerts at $0.00000900, $0.00001019, $0.00001280
Monitor Bitcoin dominance & Ethereum strength daily
Watch Jan 6 K9 Finance restitution deadline
Track Shibarium development milestone announcements
Scale out profits (don't be greedy - secure gains!)
Maintain proper position sizing & risk management
Good luck, traders! May your profits be realistic & your losses minimal. 🚀💰

SHIBUSDTWe are in correction at big short but should failed short and continue move price to high levels.
I wait for take trade with breakout 0.0000900 for buy and breakout 0.0000810 for short position.
CRYPTOCAP:PEPE KRAKEN:PEPEUSD BINANCE:PEPEUSDT

SHIBA Its first 1W Death Cross ever has been formed.Shiba Inu (SHIBUSD) has been trading within a Channel Down since the March 2024 High, which was the former Bull Cycle's Top. 4 weeks ago it completed its first ever 1W Death Cross, potentially signaling a strong bearish extension for the current Bear Cycle.
Until that happens, we have a short-term Buy Signal at our hands as not only did the Channel Down price a new Lower Low, thus technically granting the start of a new Bullish Leg, but this also took place on the 4-year Support Zone, which has been unbroken since May 2021.
As you can see, this Zone has offered numerous long-term buy opportunities. As in 2022 and 2023, every such rebound though is limited/ restricted by the presence of the 1W MA50 (blue trend-line), which has been rejecting every test since January 20 2025 (almost 1 year).
Based on that, unless we break the recent low, we expect SHIB to rally on the short-term and peak near the 1W MA50 at 0.0000115.
---
** Please LIKE 👍, FOLLOW ✅, SHARE 🙌 and COMMENT ✍ if you enjoy this idea! Also share your ideas and charts in the comments section below! This is best way to keep it relevant, support us, keep the content here free and allow the idea to reach as many people as possible. **
---
💸💸💸💸💸💸
👇 👇 👇 👇 👇 👇

SHIB fighting EMAHey guys, SHIB is setting up for a potential breakdown on the 1H timeframe, and the risk-reward is looking pretty clean for short positions right now.
Price is trading at $0.00000853, sandwiched between EMA20/50 resistance at $0.00000857-858 and the make-or-break EMA200 support at $0.00000852. The ADX reading of 56.0 confirms we're in a strong trending environment, and that trend is decidedly bearish. RSI at 30.8 is approaching oversold, but without bullish divergence and with volume running 77% below average, there's no conviction for a reversal yet.
The setup: short entries around $0.00000855 with a tight stop above $0.00000865 (invalidation if we reclaim the EMA cluster). First target sits at the Bollinger Band lower support at $0.00000844, with an extended target at $0.00000838 if the EMA200 breaks. That gives us roughly 1:2.5 risk-reward on the conservative target and 1:4+ if we get the full move. The MACD remains bearish, MFI shows weak money flow at 36.5, and the internal market state is reading choppy with only 17% directional confidence, but the sell signals are stacking up.
Key risk: if price reclaims $0.00000859 (BB middle band) with volume, this whole setup gets invalidated and we could see a squeeze back toward $0.00000874. But until that happens, the path of least resistance is down, especially with such weak participation on bounces.
How are you playing this move? Waiting for the EMA200 break or already positioned short?

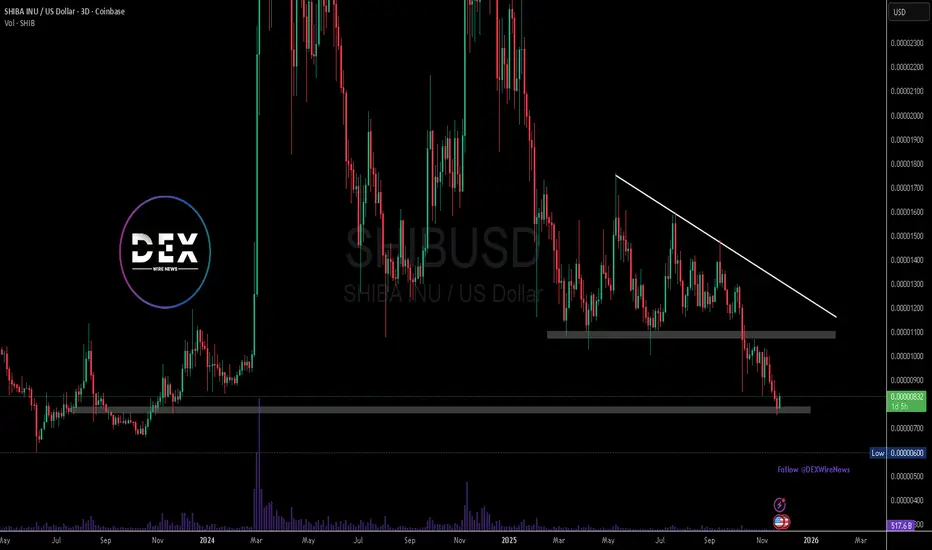
SHIB ($SHIB) Approaches a Critical Market Turning Point Shiba Inu ( CRYPTOCAP:SHIB ) trades near $0.0000082, hovering at the lower boundary of its long-term descending channel. This area has triggered strong rebounds in previous cycles, and traders now watch closely to see if the pattern repeats. Weeks of selling pressure pushed SHIB into a critical zone, but derivatives shifts suggest a potential turning point. Open interest flipped sharply after billions in short positions were liquidated, creating a cleaner foundation for any bullish attempt.
Global Derivatives Upgrades Strengthen SHIB’s Market Reach
Coinbase’s December expansion plays a major role in the latest sentiment spike. Starting December 5, Coinbase Derivatives activates 24/7 altcoin monthly futures, allowing SHIB to trade without old hour-based restrictions. This introduces constant volatility and increases liquidity in a way SHIB has not experienced before.
The exchange will also introduce perpetual-style futures for U.S. traders on December 12, placing SHIB alongside Bitcoin Cash and Avalanche. Perpetual futures typically attract speculative demand, and this could boost intraday momentum during key events.
Regulatory progress adds another bullish layer. Japan now classifies SHIB under the same flat crypto tax structure used for BTC and ETH. Meanwhile, Gemini enabled SHIB perpetual contracts for European traders. These steps mark a growing acceptance of SHIB within regulated frameworks.
Technical Outlook: Can SHIB Hold and Reverse?
SHIB sits at a major decision zone. Buyers defended support near the channel floor, triggering an open interest recovery that signals renewed confidence. If SHIB bounces, the roadmap points toward $0.00000840, $0.00001030, $0.00001160, $0.00001480, and $0.00001670.
Failure to hold support may send price toward $0.0000071 before forming a new base. Sentiment appears weak, but SHIB historically begins major breakouts from similar conditions. If futures inflows strengthen, the market could prepare for another sharp move.
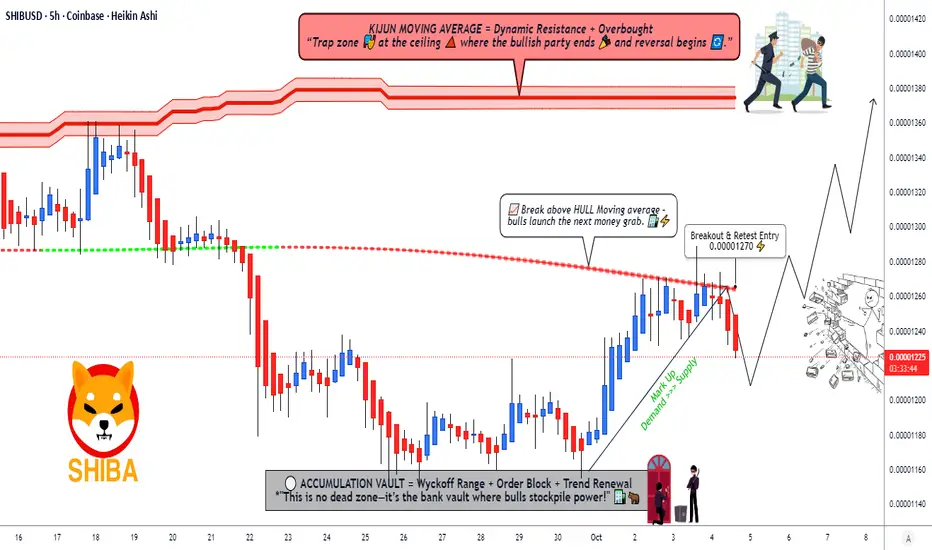
SHIBA INU Strategy Plan | Breakout Entry & Profit Zone🚀 SHIB/USD: Shiba Inu’s Moon Mission! 🌙 Swing/Day Trade Wealth Map 🗺️
🔥 Asset: SHIB/USD (Shiba Inu vs. U.S. Dollar)
🎯 Strategy: Bullish Pending Order – Ready to Ride the Crypto Rocket! 🚀
💡 Vibe: Thief-style, high-energy, fun, and professional – let’s steal some profits (legally, of course)! 😎
📈 Trade Setup: Shiba’s Breakout Bonanza! 🐶💥
Plan: Bullish Pending Order 📡We’re waiting for Shiba Inu to break out like a dog off the leash! 🐕 Once the price smashes through our key level, it’s time to pounce!
Entry: 🏁 0.00001270Set your traps after the breakout at 0.00001270. This is where the Shiba rocket ignites! 🚀 Enter at any price post-breakout, but confirm the move with volume and momentum to avoid fakeouts.
Stop Loss: 🛡️ 0.00001220The "Thief’s SL" is your safety net! Place it below key support to dodge those sneaky market traps. ⚠️ Note: Dear OG Thieves, this SL is my suggestion, but it’s your heist! Adjust based on your risk tolerance and don’t let the market pickpocket you! 💸
Target: 🎯 0.00001370–0.00001380The "Police Barricade" at 0.00001380 is a strong resistance zone, with overbought signals and potential traps waiting! 🛑 Lock in profits around 0.00001370 to stay one step ahead of the market cops. Note: OG Thieves, this TP is my call, but you decide when to cash out! Take profits at your own risk and keep those bags secure! 💰
🔍 Key Points & Correlations
Why SHIB/USD? Shiba Inu is the meme coin with a cult following, driven by community hype and crypto market sentiment. 📣 Breakouts in SHIB often align with broader altcoin pumps, so keep an eye on Bitcoin (BTC/USD) and Ethereum (ETH/USD) for market direction.
Related Pairs to Watch (in USD):
COINBASE:DOGEUSD (Dogecoin): The OG meme coin often moves in tandem with SHIB. If Doge is barking, Shiba might howl! 🐶
BITSTAMP:BTCUSD (Bitcoin): The crypto king sets the tone. A bullish BTC often lifts altcoins like SHIB. 👑
BITSTAMP:ETHUSD (Ethereum): As the backbone of DeFi, ETH’s strength can fuel meme coin rallies. 🛠️
Correlation Note: SHIB tends to follow DOGE’s momentum with a slight lag. Watch DOGE/USD for early signals, and confirm with BTC/USD’s trend to avoid chasing false breakouts.
Technical Nuggets:
The breakout at 0.00001270 is backed by a key support/resistance flip zone. 📊
RSI is nearing overbought at the target zone (0.00001380), signaling a potential pullback. Watch for divergence! ⚡
Volume spikes post-breakout will confirm the move. No volume, no party! 🎉
🕵️♂️ Thief-Style Notes for the Crew
Dear Ladies & Gentlemen (Thief OG’s), this is a high-risk, high-reward heist! 🕵️♂️ I’m sharing my setup, but the market is a wild beast. My SL and TP are suggestions – you’re the master of your own vault! 💼 Trade at your own risk, and always protect your capital like it’s the crown jewels. 👑
✨ “If you find value in my analysis, a 👍 and 🚀 boost is much appreciated — it helps me share more setups with the community!”
Disclaimer: This is a thief-style trading strategy just for fun. Trading involves risks, and past performance is not indicative of future results. Always conduct your own research and trade responsibly. 🕵️♂️
#SHIBUSD #CryptoTrading #ShibaInu #SwingTrading #DayTrading #MemeCoins #BullishBreakout #ThiefStyle #TradingView
$SHIB the calm before the explode.Shiba Inu momentum is at historic lows.
The price is quietly gathering strength in a major demand zone.
This silence could be the sound of accumulation.
And every accumulation has its breakout.
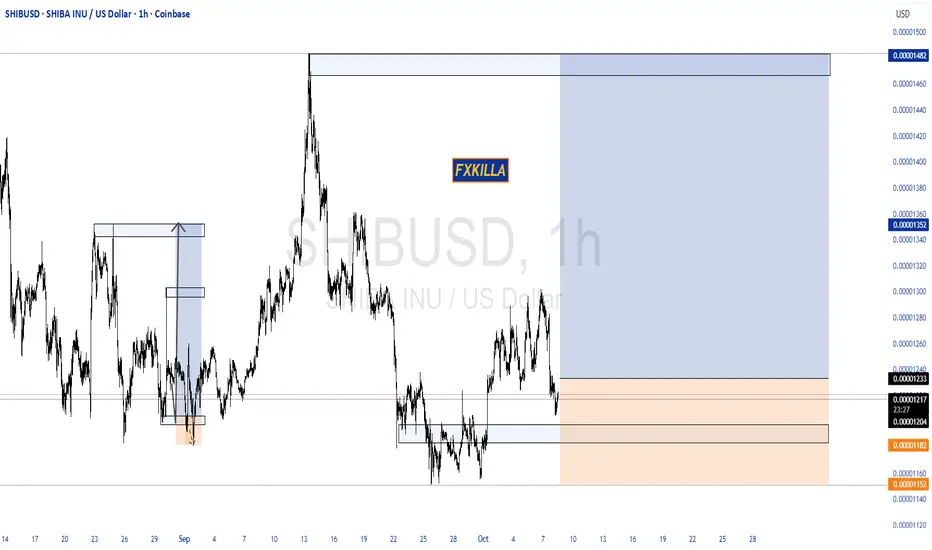
SHIBA INU HIGH PROBABILITY SETUP SOON!!!🚨 SHIBUSD HIGH PROBABILITY BUY SETUP 🚨
* Here We Can See Clearly The Next Potential Move For SHIBA Coming Hours/Days.
* Keep Your Eyes Close On Your Trading Positions.
* Happy PIP Hunting Traders.
FXKILLA.
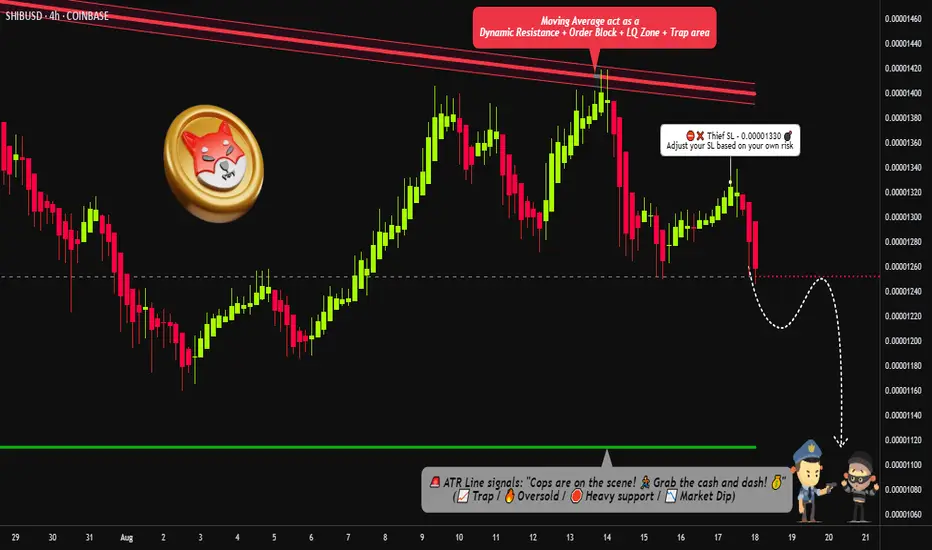
"SHIB Short Opportunity – Quick Heist, Faster Exit!"🔥🦊 SHIB/USD CRYPTO HEIST PLAN – THIEF TRADER STYLE 🚨💰
🔥 Thief OG’s Assemble – Tonight we Rob the SHIBA Vaults 🔥
👑 Dear Ladies & Gentlemen, Fellow Money Thieves, & OG Robbers 🏴☠️💸
Welcome to the Bearish Robbery Plan for SHIB/USD. Strap in, we’re going in with Thief Layering Strategy™ – multiple limit orders to maximize the loot.
📉 ENTRY PLAN – LAYERING STYLE
We don’t enter once… we layer the robbery. Multiple sell-limit orders stacked like a real thief’s toolkit:
💎 (0.00001250)
💎 (0.00001260)
💎 (0.00001270)
💎 (0.00001280)
👉 Add more layers if you want to spread your robbery wide. Remember: thieves don’t knock once, they pick every lock. 🔐
🛑 STOP LOSS (SL) – THIEF ESCAPE HATCH
Our Thief SL is parked at 0.00001330 🚨
But hey, every OG knows – adjust your SL based on your risk appetite & robbery style. 🏃♂️💨
🎯 TARGET – POLICE BARRICADE AHEAD 🚔
There’s heavy police resistance around 0.00001400… so don’t get greedy!
🎯 Our loot target is 0.00001120 💰 – grab it, stash it, and disappear before the cops surround the vault.
📜 MASTER HEIST PLAN
❌ Trend: Bearish (Shiba vault is weak & exposed)
🧨 Method: Layered Sell Orders (Limit Entries)
🏴☠️ Risk: Controlled by Thief SL
💰 Reward: Escape with stolen profit @0.00001120
⚠️ Trading Alert: Police patrol = market volatility (news, events). Avoid fresh robberies during major announcements. Use trailing SL to protect your stash.
💖 If you vibe with this Thief Trading Style™, hit that BOOST 🚀 & LIKE ❤️ to power up the robbery crew.
Together, we rob the market, escape clean, and celebrate with champagne & profits. 🥂💵
📌 Disclaimer: This is a Thief-Style Robbery Plan, not financial advice. Rob responsibly.

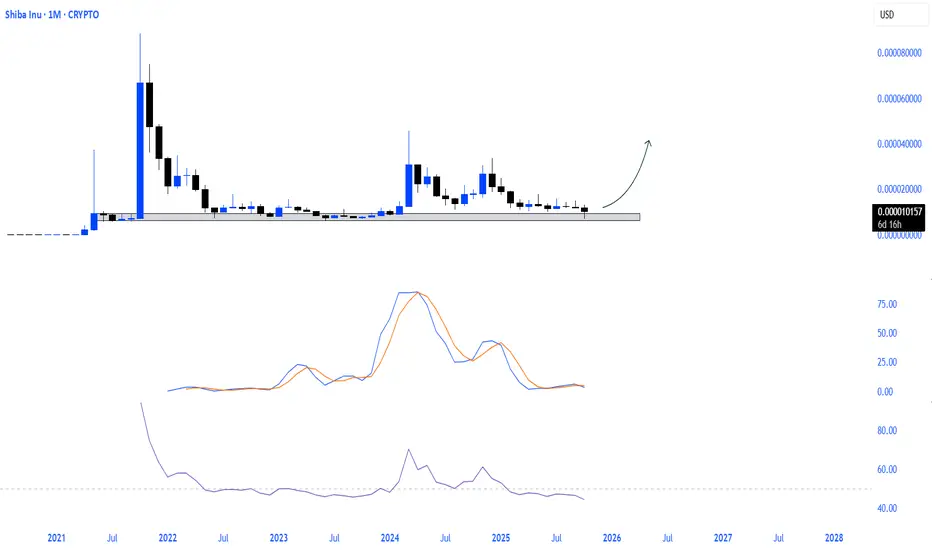
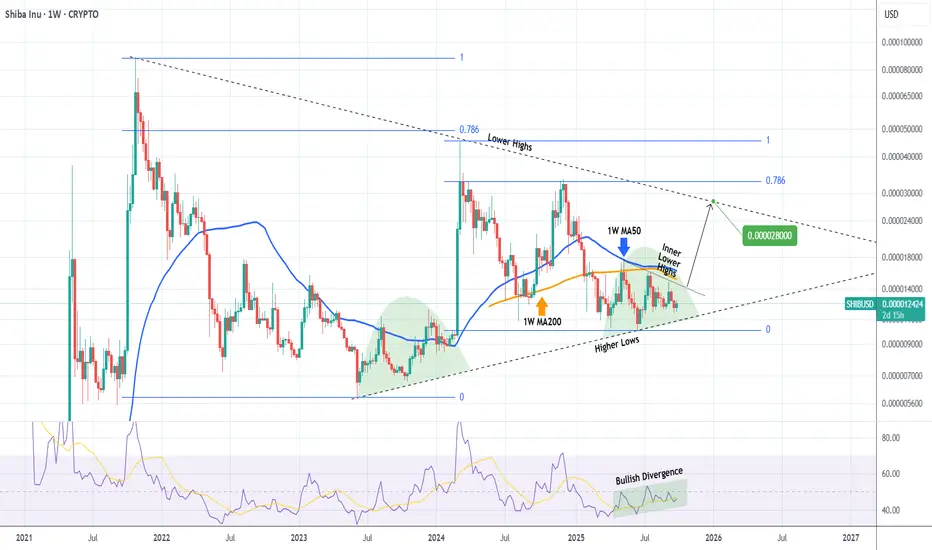
SHIBA Strong break-out expected, targeting 0.000028!Shiba Inu (SHIBUSD) has been trading within a Triangle pattern since the October 25 2021 Top of its previous Bull Cycle. The successive Lower Highs of the current Cycle have failed to make a new All Time High (ATH) and have 'trapped' the price action below its 1W MA50 (blue trend-line), is a similar Accumulation Phase on the Higher Lows like June 2023 - January 2024.
However, the 1W RSI has been rising within a Channel Up, showcasing a technical Bullish Divergence. If the price breaks above the Inner Lower Highs trend-line, it will be a first Buy Signal with confirmation coming above the 1W MA50. In that case, we expect at least a 0.000028 test of the Triangle's top (Lower Highs), still a conservative target given that the 2024 rally almost hit its 0.786 Fibonacci retracement level.
-------------------------------------------------------------------------------
** Please LIKE 👍, FOLLOW ✅, SHARE 🙌 and COMMENT ✍ if you enjoy this idea! Also share your ideas and charts in the comments section below! This is best way to keep it relevant, support us, keep the content here free and allow the idea to reach as many people as possible. **
-------------------------------------------------------------------------------
💸💸💸💸💸💸
👇 👇 👇 👇 👇 👇
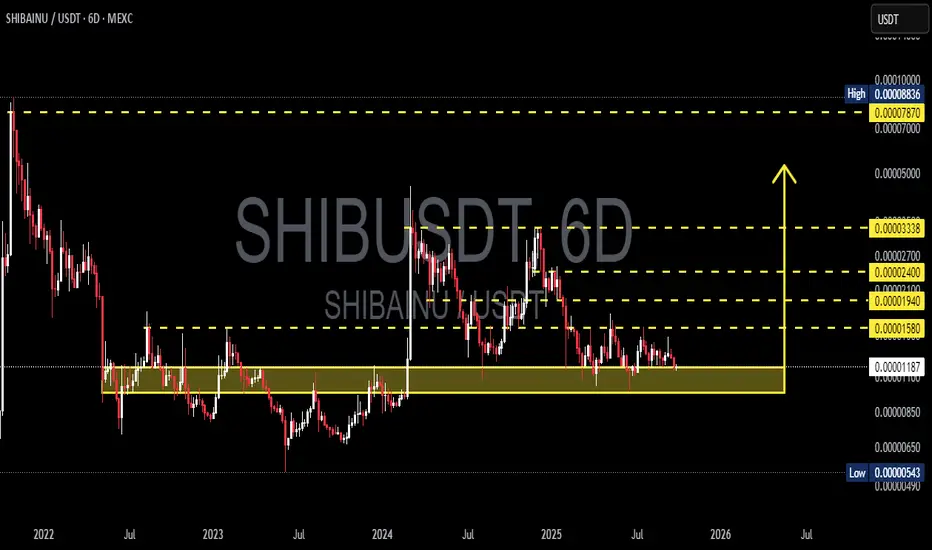
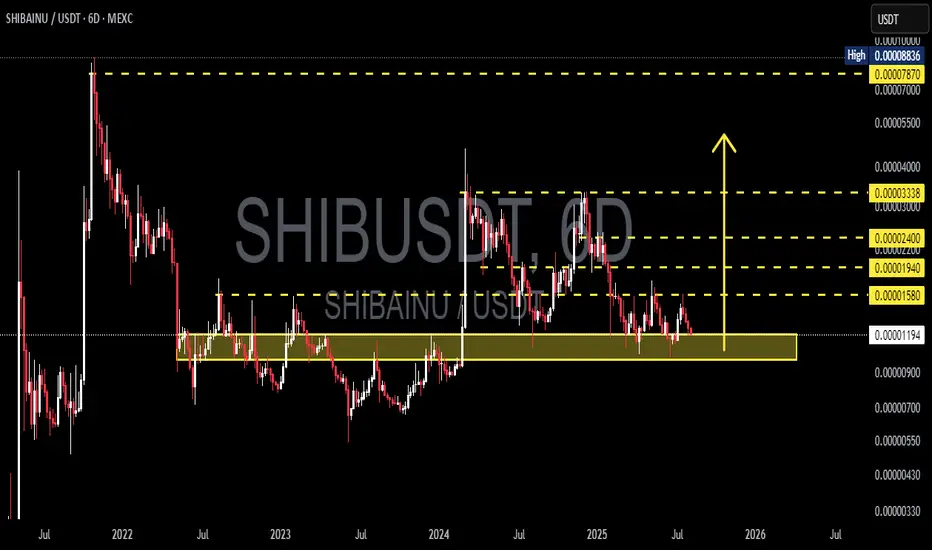
SHIBUSDT — A Major Move Will Be Decided From This Critical Zone!Overview
The 6D chart of SHIB/USDT shows a long-term consolidation that has been developing since 2022. Price is once again testing the key demand zone (0.00000850 – 0.00001183), an area that has acted as a strong support multiple times.
This zone is now a true “make or break level” — either SHIB rebounds for a major bullish wave, or it breaks down to much lower levels.
---
Structure & Price Pattern
1. Macro Downtrend
Since the ATH, SHIB has been printing lower highs, showing long-term seller dominance.
Yet, despite selling pressure, the demand zone has held — a sign that large buyers still exist here.
2. Extended Accumulation Zone
The yellow area (0.00000850 – 0.00001183) has acted as a base of accumulation since 2022.
Such prolonged consolidation often precedes explosive moves.
3. Clear Supply Levels
Resistance levels above price:
0.00001580 (initial breakout trigger)
0.00001940 → 0.00002400 → 0.00003338 (progressive bullish targets)
Major supply cluster at 0.00007870 – 0.00008836, which could be a magnet in case of a macro bullish reversal.
4. Volatility Contraction → Imminent Big Move
The 6D candles show a tightening range.
Classic signal of volatility compression, usually followed by a strong breakout or breakdown.
---
Bullish Scenario
Confirmation:
A breakout and 6D close above 0.00001580 with strong volume.
Targets:
0.00001940 → 0.00002400 → 0.00003338.
Ideal sequence:
Accumulation at support → breakout above resistance → retest as new support → rally continuation.
Reward potential: High risk-to-reward setup if the demand zone holds.
---
Bearish Scenario
Confirmation:
A breakdown below 0.00000850 with high volume.
Targets:
First: 0.00000543,
Then: potential new lows if liquidity is drained.
Risk:
If support fails, SHIB could enter a capitulation phase with accelerated downside.
---
Market Interpretation
Optimistic Buyers: See this as a long-term accumulation opportunity.
Cautious Sellers: A breakdown could trigger a steep sell-off.
Neutral Traders: Waiting for confirmed breakout/breakdown before committing larger positions.
---
Conclusion
SHIB is sitting at a critical zone that will define its macro direction into 2025–2026.
Holding support → opens path for multi-level rally.
Losing support → risk of deeper correction.
For long-term investors, this is the area to watch closely.
For swing traders, waiting for clear confirmation is the safer strategy.
---
#SHIB #SHIBUSDT #CryptoAnalysis #TechnicalAnalysis #SupportResistance #CryptoTrading #PriceAction #Accumulation #BreakoutSetup
SHIB Breakout Incoming or Another Trap?Yello Paradisers, have you noticed how #SHIBUSDT has been quietly coiling at its demand zone while retail traders are completely distracted elsewhere? What looks like silence right now could easily turn into a violent move, and the next few candles will decide everything.
💎Price has been stuck inside a descending channel, repeatedly testing both support and resistance levels. Most recently, we’ve seen a classic double bottom formation at the demand zone, a structure that often signals the beginning of a larger bullish reversal if momentum follows through. As long as SHIB holds above this critical green zone, bulls have the upper hand.
💎The first confirmation would come with a clean breakout above the descending resistance, opening the road toward the minor resistance around $0.00001345. But the real target that could bring back FOMO is the resistance zone between $0.00001428 – $0.00001445. This area is packed with liquidity, and if taken out with strength, SHIB could trigger a sharp rally that leaves latecomers chasing.
💎On the flip side, the risk remains clear: if a daily close slips below the major demand zone, the bullish scenario gets invalidated, and SHIB could tumble toward fresh lows inside the channel. This is where inexperienced traders usually get trapped, overleveraged, and liquidated, while disciplined players quietly wait for the highest probability setups.
Stick to your plan, manage your risk, and don’t let emotions guide your entries. The market is designed to shake out the weak before rewarding the patient and prepared.
MyCryptoParadise
iFeel the success🌴

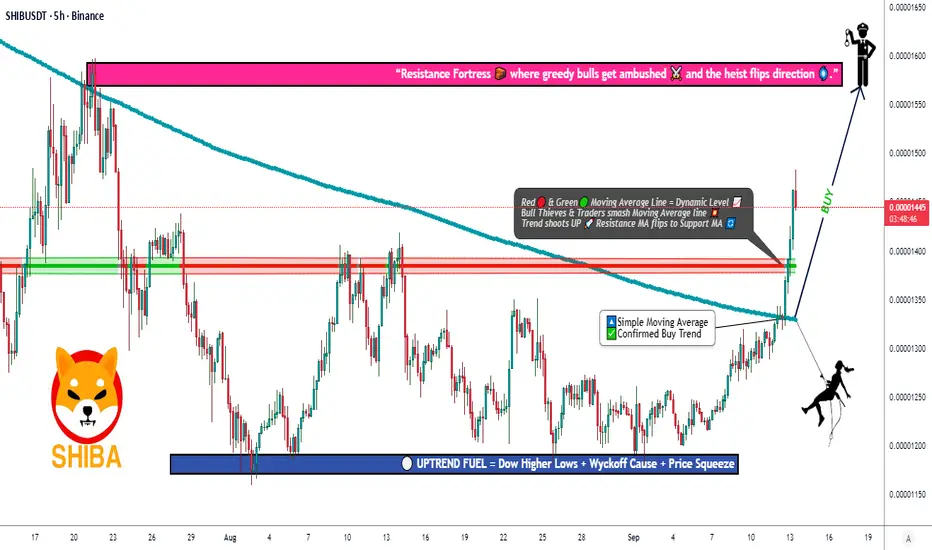
SHIB/USDT – Scaling Into a Bullish Breakout with Layered Entries🚀 SHIB/USDT (Shiba Inu) – Day Trade Setup 🐕🔥
📊 Trade Plan: Bullish Momentum
We’re spotting a Simple Moving Average breakout + Ichimoku Kijun confirmation, signaling that Shiba Inu might be gearing up for a bullish push. Momentum traders, this is where the action gets exciting. ⚡
🛠 Entry Plan
Using a layered limit order strategy (stacked entries), which allows better scaling in. Suggested layers below 👇:
0.00001400
0.00001420
0.00001440
0.00001460
(💡 You can increase or adjust the layers based on your own strategy.)
🛡 Stop Loss (Risk Guard)
A potential SL can be placed around 0.00001350, right after the breakout zone.
⚠️ Note: Adjust your SL according to your risk tolerance and personal trading style.
🎯 Target (Exit Strategy)
Upside target is placed at 0.00001580, where strong resistance and possible overbought conditions may appear. This is the "take profit & step out gracefully" zone.
⚠️ Reminder: This is not a fixed TP suggestion—manage your exits based on your own plan.
🔗 Related Pairs to Watch
Shiba Inu often correlates with other meme coins and ETH-related flows:
BINANCE:DOGEUSDT 🐶 (moves in tandem with SHIB sentiment)
BINANCE:PEPEUSDT 🐸 (new-gen meme coin hype correlations)
BINANCE:ETHUSDT 🔑 (Ethereum gas activity impacts SHIB ecosystem)
BINANCE:BTCUSDT 💰 (macro driver of overall crypto risk-on/off)
Watching these pairs together can give more conviction on momentum shifts.
✨ “If you find value in my analysis, a 👍 and 🚀 boost is much appreciated — it helps me share more setups with the community!”
#SHIB #SHIBA #CryptoTrading #Altcoins #MemeCoins #DayTrading #TradingView #Ichimoku #MovingAverage #SHIBUSDT
SHIBUSDTThe BINANCE:SHIBUSDT is moving in a trading range, but it could break either 0.00001300 or 0.00001190 and continue the trend after the breakout. I think it will be bullish because the larger time frame shows an uptrend.

SHIBA +100%?? | BEST Buy OPPORTUNITYSHIBA has been in a downtrend for many weeks.
From here, upside is likely - especially if we look at the consecutive amount of "red" weekly candles (blue on this chart).
A 40% bounce zone is easily possible from this zone. Even at modest, 20% would be ideal:
____________
BYBIT:SHIBUSDT

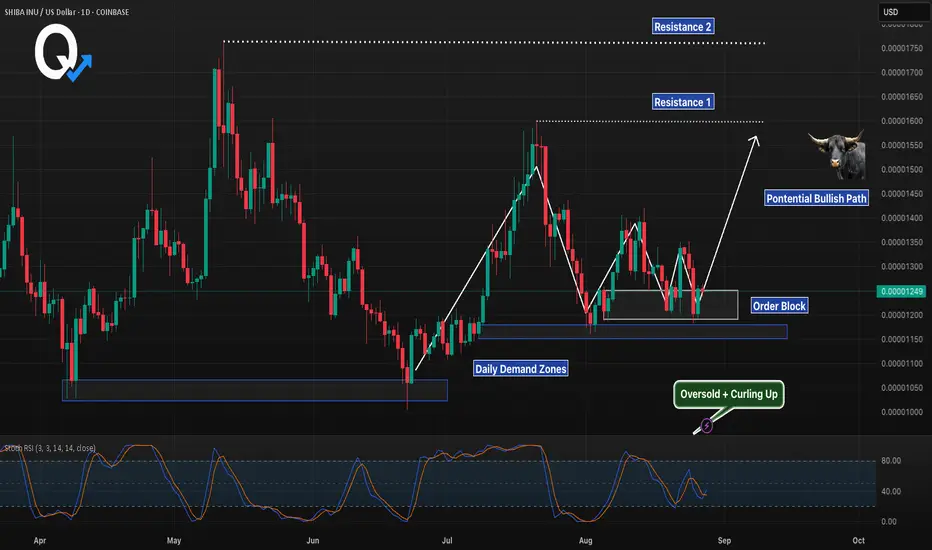
SHIB 1D – Demand Zone + Order Block SupportSHIB is consolidating around a key daily order block, sitting just above prior demand zones. This area has acted as a strong base for previous rallies, making it a critical support to watch.
Stoch RSI is oversold and beginning to curl upward, hinting at possible bullish momentum if buyers step in here. The immediate upside levels are marked by Resistance 1 and Resistance 2 — a breakout could open the path for continuation higher.
Key Levels:
Support: 0.00001200 (Order Block / Daily Demand)
Resistance 1: ~0.00001600
Resistance 2: ~0.00001750
The path is clear: hold demand and the order block for a potential bullish move, or lose it and risk another leg down.
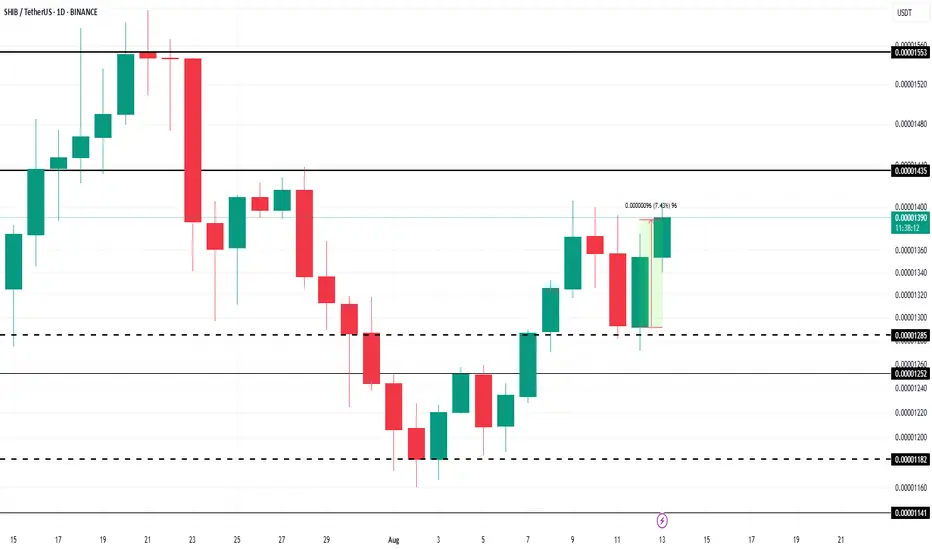
How Are Shiba Inu’s Most Profitable Holders Acting Right Now?At the time of writing, BINANCE:SHIBUSDT is trading at $0.00001366 , holding above the local support of $0.00001285. The altcoin has yet to reach the crucial resistance level of $0.00001435, which marks a significant hurdle for its recovery.
The HODL Cave analysis reveals that BINANCE:SHIBUSDT holders who have held their tokens for 18 to 20 months are currently the most profitable, second only to the all-time low (ATL) buyers. These long-term investors are seeing median profits ranging from 1.54x to 1.57x .
The 2-Year Mean Coin Age indicator, which tracks the movement of tokens over the past two years, is currently showing an uptick. Over the past two months, only one instance of selling has been recorded, highlighting the ongoing resilience of BINANCE:SHIBUSDT long-term holders .
Breaking through $0.00001435 is essential for BINANCE:SHIBUSDT to make its way to $0.00001553. Reaching this level would signal the recovery of July's losses and indicate that SHIB is back on track for further gains. The support from the most profitable holders is likely to play a pivotal role in helping SHIB break through this resistance.
However, if BINANCE:SHIBUSDT faces heavy selling pressure from skeptical holders or retail investors, the price could fall below the support of $0.00001252 . This would likely trigger a decline towards $0.00001182 or lower, invalidating the bullish thesis and signaling further downside for the altcoin.
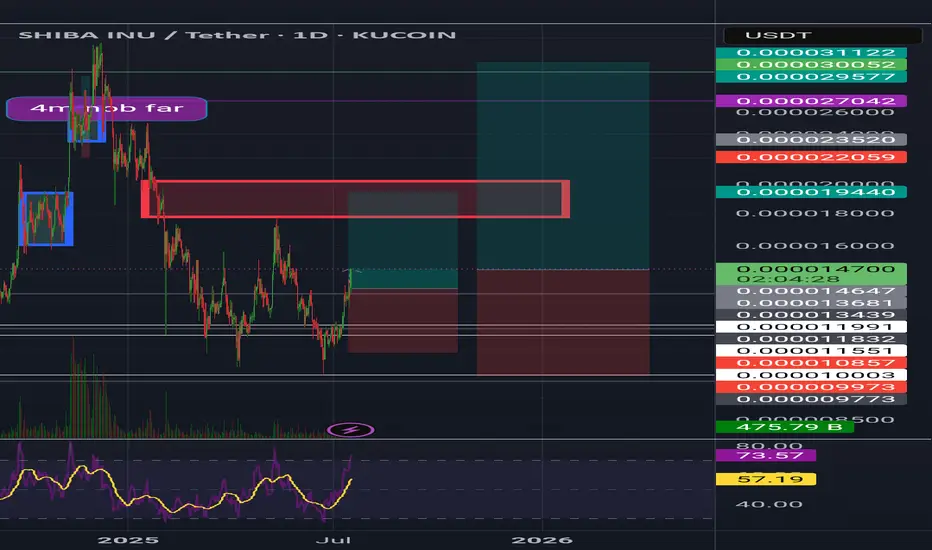
Shiba inuShib usdt Daily analysis
Time frame daily
First target = 0 00001944$
Risk rewards ratio =2 👈👌
Second target = 0.00003
Risk rewards ratio >3.5 👈 👌
The red box that you can see on the screen is very important resistance area.
If Shiba breaks it strongly, second target will be reach
SHIBA/USDT Testing the Make-or-Break Zone — End of Accumulation?🧠 Overview:
SHIBA/USDT is once again testing a critical support zone that has held strong since early 2022. This area isn’t just a technical level — it represents a long-term accumulation zone where buyers have consistently stepped in.
What happens next could define SHIB's mid to long-term trend. Will we see a major bullish reversal, or is a breakdown and deeper correction looming?
---
📊 Technical Breakdown:
Key Demand Zone (Major Support):
🔸 0.00001090 – 0.00001190 USDT
This zone has been tested multiple times over the past two years. It remains the last major stronghold for bulls. A breakdown here could trigger panic selling.
Important Resistance Levels (Bullish Targets):
🔹 0.00001580 → Initial resistance
🔹 0.00001940 → Previous distribution area
🔹 0.00002400 → Strong psychological level
🔹 0.00003338 → Mid-term bullish target
🔹 0.00007870 – 0.00008836 → High timeframe supply zone and potential long-term profit-taking area
Market Structure:
🔸 Price remains inside a long-term horizontal consolidation range
🔸 No clear breakout yet, but early signs of buyer interest are forming
🔸 Possibility of forming a double bottom or accumulation breakout if bullish momentum strengthens
---
📈 Bullish Scenario:
✅ Price holds above 0.00001190 support
✅ Breakout above 0.00001580 = early trend reversal signal
✅ Bullish confirmation with volume increase
✅ Mid-term targets: 0.00001940 → 0.00002400 → 0.00003338
✅ Long-term potential: Retest of 0.00007870 – 0.00008836 (key supply zone)
---
📉 Bearish Scenario:
❌ Breakdown below 0.00001090 = major bearish signal
❌ Potential drop toward lower zones:
▪️ 0.00000900
▪️ 0.00000700
▪️ 0.00000550 (next key support zone)
❌ Price structure shifts to lower lows, indicating trend weakness and potential distribution phase
---
🧩 Pattern Insights:
📌 Market showing signs of Sideways Accumulation for over 1.5 years
📌 Could be a Re-Accumulation Phase before a major breakout
📌 Current movement resembles a Wyckoff-style Spring, which often precedes an upward expansion
---
📌 Conclusion:
SHIB is standing at a major inflection point. If buyers continue to defend this support zone, it could mark the beginning of a new bullish cycle. However, if this level breaks, further downside is highly likely.
This is a moment of calm before potential volatility — stay alert and watch volume + price action closely.
#SHIB #SHIBUSDT #CryptoBreakout #SupportZone #AltcoinAnalysis #SHIBAInu #TechnicalAnalysis #AccumulationPhase #WyckoffMethod #CryptoBullish #CryptoBearish
Shib pump incomingIt can go a bit lower but the option to start building a position is looking great!!!
Could take some time for an 40x
NOT FIANNCIAL ADVICE!!

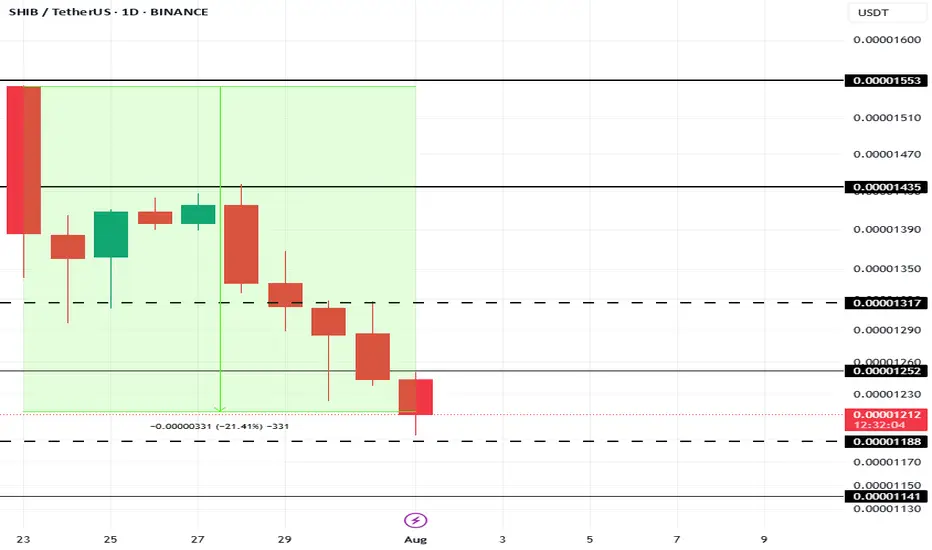
This Is The Cause Of Shiba Inu Price’s 21% Fall In 10 DaysAt present, BINANCE:SHIBUSDT price is sitting at $0.00001210, down 21% over the last 10 days . The drop in Shiba Inu's price can be traced to a sharp decline in the number of new addresses interacting with the token.
In the last 10 days, the number of new addresses has decreased by nearly 40% . This sudden exit of new investors indicates waning confidence in BINANCE:SHIBUSDT price potential, particularly after an extended rally earlier in the year.
If this trend continues, BINANCE:SHIBUSDT could lose the critical support level of $0.00001188, pushing the price down to $0.00001141 or potentially lower. However, if SHIB manages to hold onto its $0.00001188 support level, there is a possibility of recovery.
A bounce from this level could push BINANCE:SHIBUSDT price up to $0.00001317 . Securing this level as support would create a bullish scenario, invalidating the bearish thesis and offering hope for further price growth in the near future.