Shiba Inu, possibilities...Check this out. This is what is possible.
Six bars = six weeks. 42 days.
In 2021: 13-September 2021 through 25-October 2021, Shiba Inu grew 1,332%.
The first week was the all-time low and then this bull run phase.
In 2026... Get it?
In 2026: 2-February 2026 through...
It is possible. Shiba Inu can grow in unexpected ways.
Now, don't get me wrong. It might happen or it might not happen, a bull run phase, but it is possible.
What we know for certain is that the unexpected is what always tends to happen. Also, strong bullish action can start anytime after a new all-time low.
The ATL came in last week after SHIBUSDT closed five consecutive weeks red and also a major downtrend since March 2024. Almost two years of bearish action.
Long-term bearish action can be followed by long-term growth.
Another scenario; possibilities.
Shiba Inu starts moving within a rising trend, higher highs and higher lows, long-term. Different but still positive.
The less likely scenario is a forever downtrend. This is not likely. This isn't wishful thinking it is only common sense.
The Cryptocurrency market is not shrinking or dying. It is growing and evolving. The market capitalization is in a long-term uptrend. Bitcoin has been growing forever as well as the top projects. The market is young, growing and evolving.
We know why the last few years were bad and there is no need to blame anybody. What happened is already in the past. We survived and will thrive, we are blessed.
A long-term bear market, what to do about it?
Hold strong. Stay strong, never give up.
We tend to want to give up when everything is about to change. Right at the moment when everything is about to get better we feel the impulse to throw the towel. What happens if we never give up?
A moment comes when we reach our goals. We can enjoy the fruit of our labor. The only way to lose is by giving up.
The way to win is to continue forward regardless of the challenge. Can be life or death. Can be disease, can be suffering or pain. There is no other choice but to keep on fighting. It will get better. The bottom is already in.
The worse it gets, the stronger we become. Through pain and hardship we continue to grow.
Shiba Inu will recover.
Namaste.
SHIBUSDT

SHIBA: Testing the Final Line of Defense
Major Support Zone (The "Floor"): The price is currently hovering right above the critical historic support level at $0.00000549. This zone acts as the "last line of defense."
Bullish Scenario: If this level holds, it presents a high Risk/Reward (R/R) long opportunity, as it has historically been a strong accumulation zone for Smart Money.
Bearish Risk: A weekly close below this level could trigger a free fall towards the $0.00000415 region (dashed line).
Descending Resistance The asset has been strictly respecting a multi-year bearish trendline. The price is being squeezed between this dynamic resistance and the horizontal support. A breakout above this diagonal trendline is the primary validation required for a trend reversal.
RSI Divergence & Compression: The Weekly RSI is currently at 31, sitting in the oversold territory. More importantly, the RSI indicator itself is showing a breakout from its own downtrend structure. Momentum often precedes price; this suggests that the selling pressure is exhausted.
Market Psychology: We are in the "Boredom" and "Disbelief" phase. Volume is low, and retail interest has faded. Historically, these periods of maximum compression and low volatility are where cycles bottom out before the next expansion phase.
Conclusion: This is a "Do or Die" moment for SHIB. Watch for a high-volume breakout above the descending trendline to confirm the reversal. Until then, patience is key.

SHIBUSDT 1,045% profits potential with 5X leverage —LONG tradeBeyond any type of bullish signals and technical analysis, this is a 100% timing based chart setup. Shiba Inu is set to grow next, within days at max.
Here we have a double-bottom, late December vs the market flush. This double-bottom is a higher low compared to June 2023.
Shiba Inu has been bearish since March 2024. Now starts either a very strong bullish wave or an entire bullish cycle.
This bullish cycle, long-term growth, will still come with retraces and corrections, these are inevitable. But it grows long-term. This means that no new lows are possible... This is just speculation. The chart simply points higher short- to mid-term. Long-term, anything goes.
Shiba Inu is set to produce massive growth.
Full leveraged trade-numbers below:
_____
LONG SHIBUSDT
Leverage: 5X
Potential: 1045%
Allocation: 5%
Entry zone: $0.00000736 - $0.00000808
Targets:
1) $0.00000843
2) $0.00000938
3) $0.00001096
4) $0.00001351
5) $0.00001533
6) $0.00001765
7) $0.00002020
8) $0.00002434
Stop: Close weekly below $0.00000735
_____
Thanks a lot for your continued support.
Namaste.

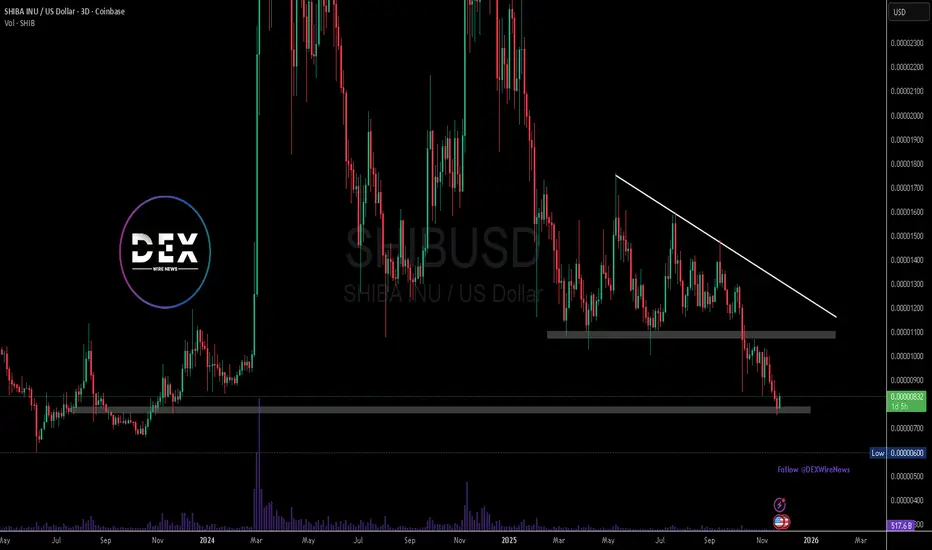
SHIB/USDT - Critical Support Zone - Reversal or Breakdown?SHIB/USDT on the 3-Day (3D) timeframe remains in a medium-to-long-term bearish structure. Since the previous peak, price has consistently formed lower highs and lower lows, confirming strong seller dominance. Currently, price is trading near a major historical support zone, making this area crucial for determining the next directional move.
---
Pattern Explanation
Descending Trendline (Bearish Trendline)
The yellow diagonal line represents a well-respected descending trendline, connecting multiple lower highs. As long as price remains below this trendline, the overall market structure stays bearish.
Bearish Continuation Structure
Price action shows weak corrective rebounds, suggesting that every upside move is still being used as a selling opportunity.
Horizontal Key Levels (Supply & Demand Zones)
The horizontal yellow levels mark important historical supply and demand zones, where previous supports have now turned into resistances.
---
Key Levels
Resistance Zones:
0.00001120
0.00001400
0.00001550
0.00002100
0.00002430
0.00003300 (Major Resistance / Previous High)
Support Zones:
0.00000840 (Current Minor Support)
0.00000678 (Major Low / Strong Demand Area)
---
Bullish Scenario
Price holds firmly above the 0.00000678 – 0.00000840 support zone
Formation of a higher low on the 3D timeframe
A confirmed breakout and close above the descending trendline
Additional bullish confirmation if price reclaims 0.00001120
Bullish Targets (Step-by-Step):
0.00001120
0.00001400
0.00001550
0.00002100
This scenario would indicate a medium-term trend reversal, but strong volume confirmation is still required.
---
Bearish Scenario
Price fails to hold above 0.00000678
Strong breakdown and candle close below the major support
Continuation of the lower-low structure
Bearish Targets:
0.00000510
0.00000425 (Extreme demand zone / potential capitulation area)
If this scenario plays out, SHIB may enter a bearish extension phase with sustained selling pressure.
---
Conclusion
SHIB/USDT is currently trading at a critical decision zone.
As long as price remains below the descending trendline, the primary bias stays bearish.
However, this lower support region could also act as a long-term accumulation base if a valid structural breakout occurs.
Waiting for clear price action confirmation is highly recommended, especially on higher timeframes like 3D.
#SHIB #SHIBUSDT #CryptoAnalysis #TechnicalAnalysis #Downtrend #Altcoin #MarketStructure #SupportResistance #BearishTrend #PotentialReversal

SHIBUSDT Forming Falling WedgeSHIBUSDT is forming a clear falling wedge pattern, a classic bullish reversal signal that often indicates an upcoming breakout. The price has been consolidating within a narrowing range, suggesting that selling pressure is weakening while buyers are beginning to regain control. With consistent volume confirming accumulation at lower levels, the setup hints at a potential bullish breakout soon. The projected move could lead to an impressive gain of around 60% to 70% once the price breaks above the wedge resistance.
This falling wedge pattern is typically seen at the end of downtrends or corrective phases, and it represents a potential shift in market sentiment from bearish to bullish. Traders closely watching SHIBUSDT are noting the strengthening momentum as it nears a breakout zone. The good trading volume adds confidence to this pattern, showing that market participants are positioning early in anticipation of a reversal.
Investors’ growing interest in SHIBUSDT reflects rising confidence in the project’s long-term fundamentals and current technical strength. If the breakout confirms with sustained volume, this could mark the start of a fresh bullish leg. Traders might find this a valuable setup for medium-term gains, especially as the wedge pattern completes and buying momentum accelerates.
✅ Show your support by hitting the like button and
✅ Leaving a comment below! (What is your opinion about this Coin?)
Your feedback and engagement keep me inspired to share more insightful market analysis with you!

SHIBUSD Bullish Structure Aligning With Market Flow🚀 SHIBA INU (SHIB/USD) - Swing Trade Profit Pathway Setup 🎯
Current Market Data ✅
Real-Time Price: $0.00000827 USD (+14.85% 7-day momentum)
Market Cap: $4.87B (Ranking #25)
24h Volume: $133.6M USD
Status: Bullish momentum breakout zone 📈
🎯 TRADE SETUP OVERVIEW
Asset: SHIBA INU vs U.S DOLLAR (SHIB/USD)
Strategy: Swing Trade - Simple Moving Average Breakout
Trade Type: BULLISH CONTINUATION 🔝
Timeframe: Multi-day swing setup
📍 ENTRY STRATEGY
Entry Approach: Flexible zone entry
✅ ANY PRICE LEVEL ENTRY - Multiple entry opportunities on breakout confirmation
Primary Entry: Above Hull MA (HMA) breakout zone
Secondary Entry: Dips into support after initial breakout
Optimal Entry: Confirmed 4H HMA golden cross + volume surge
Entry Signal Confirmation:
Hull Moving Average (HMA) slope turns bullish ✓
Volume increases above 20-day average ✓
Price breaks & holds above key resistance levels ✓
⛔ STOP LOSS (SL) - RISK MANAGEMENT
SL Placement: $0.00000750
Placement Rule: AFTER Hull MA breakout confirmation
Reasoning: Thief SL = Security line against false breakouts
⚠️ Important: Your stop loss placement is YOUR OWN CHOICE & RESPONSIBILITY. This is not financial advice. Adjust SL based on your personal risk tolerance and trading account size. Many traders adjust SL to 2-3% below entry after confirmation.
🎁 PROFIT TARGET (TP) - EXIT STRATEGY
Primary Target: $0.00000900
Secondary Target: $0.00001019 (Technical golden cross)
Tertiary Target: $0.00001280 (6-month upside potential)
Why These Levels?
Hull MA = POLICE BARRICADE - Acts as dynamic support/resistance barrier
$0.00000900 zone = Oversold trap recovery + strong correlation support
Previous resistance = Future support principle applies here
Risk/Reward Ratio = 1:2+ (Excellent for swing traders)
⚠️ Important: TP selection is YOUR OWN CHOICE & RESPONSIBILITY. Lock in profits at levels that align with YOUR trading strategy. Consider taking partial profits (25-50%) at primary target, then trailing SL on remainder.
📊 TECHNICAL ANALYSIS FACTORS
Bullish Indicators ✅
RSI Momentum: Currently 57.05 (Neutral-Bullish zone)
Moving Averages: HMA slope turning positive
Volume Profile: Exchange inflows declining = Accumulation phase
7-Day Performance: +14.20% outperforming crypto market (+4.50%)
24-Hour Action: Strong buying pressure above support levels
Whale Activity: 167.99B SHIB ($1.18M) exited exchanges on Dec 31 = Institutional accumulation signal
Risk Factors ⚠️
Large circulating supply (589.24 trillion SHIB) = Price scaling challenges
Daily burn rate slowing = Deflationary pressure reduced
September Shibarium bridge exploit = Some ecosystem trust issues
Anonymous development team = Leadership transparency concerns
🔗 RELATED PAIRS TO WATCH (Correlation Analysis)
Positive Correlations - Follow SHIB Moves:
1. DOGE/USD (Dogecoin) 🐕
Correlation Index: +0.85
Reason: Meme coin ecosystem + retail sentiment driver
Action: If DOGE breaks $0.20, expect SHIB breakout confirmation
Watch Level: $0.20-$0.22 resistance zone
2. ETH/USD (Ethereum) ⛓️
Correlation Index: +0.70
Reason: SHIB runs on Ethereum layer-2 (Shibarium) - Direct network dependency
Action: ETH strength = Shibarium efficiency = SHIB upside
Watch Level: ETH above $3,500 = Bullish for SHIB ecosystem
Current ETH Price: $3,123.74 (+4.06% momentum)
3. BTC/USD (Bitcoin Dominance) 👑
Correlation Index: +0.69
Reason: Alt-season driver - When BTC rallies, alts follow
Action: BTC above $90k = Alt coin money rotation confirmed
Watch Level: Bitcoin dominance below 55% = Altcoin strength signal
Current BTC Price: $89,904.63 (+1.45%)
4. SOL/USD (Solana) 🚀
Correlation Index: +0.65
Reason: Layer-2 network competition + ecosystem adoption race
Action: SOL weakness = Potential SHIB strength divergence
Watch Level: SOL support at $130-$135 zone
Current SOL Price: $132.51 (+4.57%)
5. SHIBARIUM (BONE/USD) 🦴
Correlation Index: +0.95 (Highest correlation - Direct ecosystem token)
Reason: Governance token + network utility token for Layer-2
Action: BONE strength = Shibarium adoption = SHIB ecosystem health
Watch Level: BONE above $0.85 = Strong ecosystem signal
Action: Track Shibarium RPC migration completion (Q1 2026)
6. Total Cryptocurrency Market Cap
Correlation Index: +0.63
Reason: Risk-on/risk-off sentiment across all alts
Action: Total crypto market cap above $2.5T = Favorable SHIB trading
Watch Level: Watch for macro capitulation/recovery phases
📰 FUNDAMENTAL & ECONOMIC FACTORS (Real-Time Data - Jan 4, 2026)
BULLISH CATALYSTS FOR 2026:
🔧 Shibarium L2 Technical Upgrades (Upcoming Q1-Q2 2026)
Zama FHE Privacy Integration: Q2 2026 launch confirmed
Brings on-chain privacy & confidential smart contracts
Makes Shibarium competitive with privacy-focused chains
Estimated Impact: +15-25% ecosystem value growth if executed
RPC Network Migration: Early 2026 (post-security audit)
Decentralizes network (removes single point of failure)
Increases trust post-September bridge exploit
Improves transaction reliability & developer confidence
AI Technical Paper Release: Q1 2026
Partnership announcements with NVIDIA & Alibaba Cloud
Positions SHIB in AI + blockchain convergence trend
Enterprise adoption narrative strengthens
Shibarium Layer-3 Rollout: Mid-2026
Faster transactions, multi-currency gas fees
Improves UX for retail traders & developers
Adoption potential + volume increase expected
💰 Market Sentiment Shifts (Early 2026 Data)
Meme Season Starting: SHIB +17.95% since Jan 1, 2026
First green weekly candle in 2026
Retail FOMO entering the space = Volatility opportunity
Momentum traders accumulating positions
Whale Accumulation Signals:
Exchange outflows: 167.99B SHIB ($1.18M) on Dec 31
Institutional buyers repositioning
Futures open interest +9.39% = Leveraged long positioning
Derivatives Market Heating:
Open interest: +20% surge in early 2026
Indicates trader positioning for breakout
Volume concentration = Price move likely
⚖️ Regulatory & Macroeconomic Factors:
Positive Developments:
CLARITY Act Potential: Crypto regulatory framework clarity could unlock institutional capital
Coinbase Regulated SHIB Futures: Launched - Legitimacy + retail access
Crypto Market Recovery: Bitcoin +1.45%, Ethereum +4.06% - Broad-based strength
Lower Fed Rate Expectations: 17.7% odds of January rate cut = Liquidity increase favors risk-on assets like SHIB
Risk Factors to Monitor:
SEC Scrutiny: 60% of altcoins under review globally for potential restrictions
September Shibarium Exploit: K9 Finance issued Jan 6, 2026 deadline for full restitution
If not resolved: May trigger ecosystem departures
If resolved: Major bullish catalyst + confidence restoration
Anonymous Leadership: Shytoshi Kusama silent since early December
Communication concerns post-exploit
2026 focus on "repair, focus & building to last" (per dev Kaal Dhairya)
Less hype marketing = More serious infrastructure focus (Could be Bullish long-term)
Supply Inflation Risk:
589.24 trillion tokens in circulation
Daily burns slowed to ~3.2M SHIB (from billions earlier)
Price scaling challenges without massive adoption
🎯 TRADE PROBABILITY FACTORS
Bullish Case: 65% Probability
✅ Momentum breakout confirmed (7-day +14.20%)
✅ Whale accumulation signals strong
✅ Multiple 2026 technical upgrades lined up
✅ Broader crypto market recovery supporting altcoins
✅ Meme season retail FOMO entering
Bearish Case: 35% Probability
⚠️ Large circulating supply limits upside scaling
⚠️ Regulatory headwinds could cause delisting risk
⚠️ Ecosystem restitution deadline (Jan 6) = Event risk
⚠️ Leadership transparency issues post-exploit
⚠️ Failed to rally with Bitcoin's 2025 surge = Relative weakness
💡 TRADER NOTES & STRATEGY TIPS
For Swing Traders (3-14 days holding):
Enter zones: First breakout above HMA + confirmed volume
Scale in: Use 3 equal entries on dips within the trend
Take profits: 50% at $0.00000900 (secure gains), 30% at $0.00001019, hold 20% for trend extension
Use alerts: Set price alerts at key technical levels to avoid emotional decisions
Risk/Reward: Maintain 1:2+ ratio minimum before entering
Risk Management Checklist:
Position size: Only risk 1-2% of account per trade
SL placement: Confirmed after breakout (NOT before)
TP scaling: Don't try to catch "the top" - take profits systematically
Market context: Check Bitcoin dominance + overall crypto sentiment before entry
Stop loss trails: Move SL to breakeven after +50% gain minimum
Event Calendar for SHIB Traders (Q1 2026):
Jan 6, 2026: K9 Finance ecosystem restitution deadline (Event risk)
Q1 2026: Shibarium RPC migration completion expected
Q1 2026: AI technical paper release with NVIDIA/Alibaba details
Q2 2026: Zama FHE privacy upgrade rollout begins
Mid-2026: Shibarium Layer-3 Alpha launch
⚠️ DISCLAIMER & RISK ACKNOWLEDGMENT
IMPORTANT - READ CAREFULLY:
This analysis is based on technical setups and market data AS OF JANUARY 4, 2026. This is NOT financial or investment advice. SHIB is a highly volatile cryptocurrency with meme-coin origins.
🚨 Risks involved:
Cryptocurrency markets operate 24/7 with extreme volatility
SHIB's large circulating supply presents scaling challenges
Regulatory decisions could impact value substantially
Past performance does not guarantee future results
You can lose your entire investment
🎬 ACTION CHECKLIST FOR TRADERS
Confirm Hull MA breakout on 4-hour timeframe
Wait for volume surge above 20-day average
Enter on breakout confirmation + hold above HMA
Place SL at $0.00000750 (AFTER breakout)
Set TP alerts at $0.00000900, $0.00001019, $0.00001280
Monitor Bitcoin dominance & Ethereum strength daily
Watch Jan 6 K9 Finance restitution deadline
Track Shibarium development milestone announcements
Scale out profits (don't be greedy - secure gains!)
Maintain proper position sizing & risk management
Good luck, traders! May your profits be realistic & your losses minimal. 🚀💰

SHIBUSDTWe are in correction at big short but should failed short and continue move price to high levels.
I wait for take trade with breakout 0.0000900 for buy and breakout 0.0000810 for short position.
CRYPTOCAP:PEPE KRAKEN:PEPEUSD BINANCE:PEPEUSDT

SHIB fighting EMAHey guys, SHIB is setting up for a potential breakdown on the 1H timeframe, and the risk-reward is looking pretty clean for short positions right now.
Price is trading at $0.00000853, sandwiched between EMA20/50 resistance at $0.00000857-858 and the make-or-break EMA200 support at $0.00000852. The ADX reading of 56.0 confirms we're in a strong trending environment, and that trend is decidedly bearish. RSI at 30.8 is approaching oversold, but without bullish divergence and with volume running 77% below average, there's no conviction for a reversal yet.
The setup: short entries around $0.00000855 with a tight stop above $0.00000865 (invalidation if we reclaim the EMA cluster). First target sits at the Bollinger Band lower support at $0.00000844, with an extended target at $0.00000838 if the EMA200 breaks. That gives us roughly 1:2.5 risk-reward on the conservative target and 1:4+ if we get the full move. The MACD remains bearish, MFI shows weak money flow at 36.5, and the internal market state is reading choppy with only 17% directional confidence, but the sell signals are stacking up.
Key risk: if price reclaims $0.00000859 (BB middle band) with volume, this whole setup gets invalidated and we could see a squeeze back toward $0.00000874. But until that happens, the path of least resistance is down, especially with such weak participation on bounces.
How are you playing this move? Waiting for the EMA200 break or already positioned short?

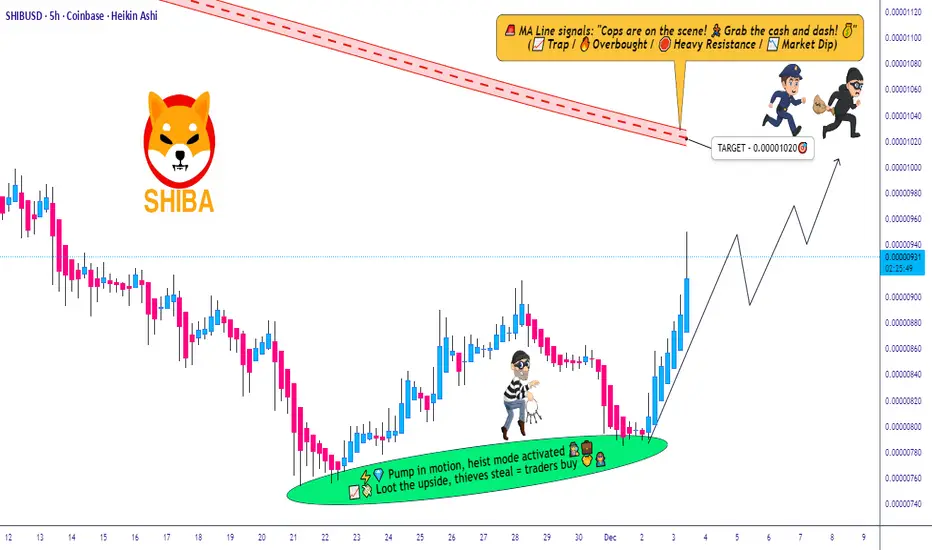
SHIB/USD Momentum Building — Is a Upside Expansion Coming?SHIB/USD Breakout Blueprint — Bullish Run Loading…? 🚀📈
📌 Asset Overview
SHIB/USD — “SHIBA INU VS U.S DOLLAR”
Crypto Market Opportunity Blueprint (DAY Trade)
🧭 Trading Plan
Plan: Bullish plan
Entry: YOU CAN ENTRY ANY PRICE LEVEL
🛡️ Stop Loss Guidance
Stop loss: This is thief SL @ 0.00000840, Dear Ladies & Gentleman (Thief OG's) Adjust your SL based on your startergy & own risk.
Note: Dear Ladies & Gentleman (Thief OG's) iam not recommended to set only my SL. its your own choice you can make money then take money at your own risk.
🎯 Take-Profit Outlook
Target: TRIANGULAR Moving average act as a strong resistance + overbought + trap is there so kindly escape with profits.
OUR target @ 0.00001020
Note: Dear Ladies & Gentleman (Thief OG's) iam not recommended to set only my TP. its your own choice you can make money then take money at your own risk.
📡 Market Context & Key Technical Insight
SHIB is now reacting strongly to triangular MA compression, signaling momentum buildup.
Overbought conditions create potential trap-zones, so profit-taking discipline is important.
Market structure remains bullish, buyers stepping in consistently on dips.
🔗 Related Pairs to Watch (Correlation + Key Points)
1️⃣ COINBASE:DOGEUSD — Dogecoin
Often moves in parallel with SHIB because both are meme-driven assets.
DOGE liquidity spikes usually lead SHIB volatility by a few minutes.
Strong DOGE breakouts can indicate SHIB momentum continuation.
2️⃣ BITSTAMP:BTCUSD — Bitcoin
BTC controls entire crypto risk sentiment.
If BTC holds above intraday EMA clusters and trends bullish, SHIB gets risk-on support.
Sharp BTC pullbacks may cause SHIB short-term weakness.
3️⃣ BITSTAMP:ETHUSD — Ethereum
SHIB is built on Ethereum, so gas fees + network congestion can influence SHIB’s intraday ranges.
ETH bullish breakouts often open liquidity for altcoins like SHIB.
4️⃣ COINBASE:SOLUSD — Solana
Not directly correlated but competes for retail meme attention.
If SOL rallies aggressively, retail flows may shift between meme-coins and high-beta L1 assets.
5️⃣ BINANCE:SHIBUSDT (Spot)
Tracks most liquid version of SHIB trading.
If SHIB/USD and SHIB/USDT diverge, it signals USD-index impact or exchange-based liquidity imbalances.
🧭 Summary
This SHIB setup is a momentum-driven bullish opportunity, but smart exits are key due to resistance and overbought traps. Watch DOGE and BTC closely—they are the primary flow leaders determining SHIB’s intraday aggression.
SHIB ($SHIB) Approaches a Critical Market Turning Point Shiba Inu ( CRYPTOCAP:SHIB ) trades near $0.0000082, hovering at the lower boundary of its long-term descending channel. This area has triggered strong rebounds in previous cycles, and traders now watch closely to see if the pattern repeats. Weeks of selling pressure pushed SHIB into a critical zone, but derivatives shifts suggest a potential turning point. Open interest flipped sharply after billions in short positions were liquidated, creating a cleaner foundation for any bullish attempt.
Global Derivatives Upgrades Strengthen SHIB’s Market Reach
Coinbase’s December expansion plays a major role in the latest sentiment spike. Starting December 5, Coinbase Derivatives activates 24/7 altcoin monthly futures, allowing SHIB to trade without old hour-based restrictions. This introduces constant volatility and increases liquidity in a way SHIB has not experienced before.
The exchange will also introduce perpetual-style futures for U.S. traders on December 12, placing SHIB alongside Bitcoin Cash and Avalanche. Perpetual futures typically attract speculative demand, and this could boost intraday momentum during key events.
Regulatory progress adds another bullish layer. Japan now classifies SHIB under the same flat crypto tax structure used for BTC and ETH. Meanwhile, Gemini enabled SHIB perpetual contracts for European traders. These steps mark a growing acceptance of SHIB within regulated frameworks.
Technical Outlook: Can SHIB Hold and Reverse?
SHIB sits at a major decision zone. Buyers defended support near the channel floor, triggering an open interest recovery that signals renewed confidence. If SHIB bounces, the roadmap points toward $0.00000840, $0.00001030, $0.00001160, $0.00001480, and $0.00001670.
Failure to hold support may send price toward $0.0000071 before forming a new base. Sentiment appears weak, but SHIB historically begins major breakouts from similar conditions. If futures inflows strengthen, the market could prepare for another sharp move.
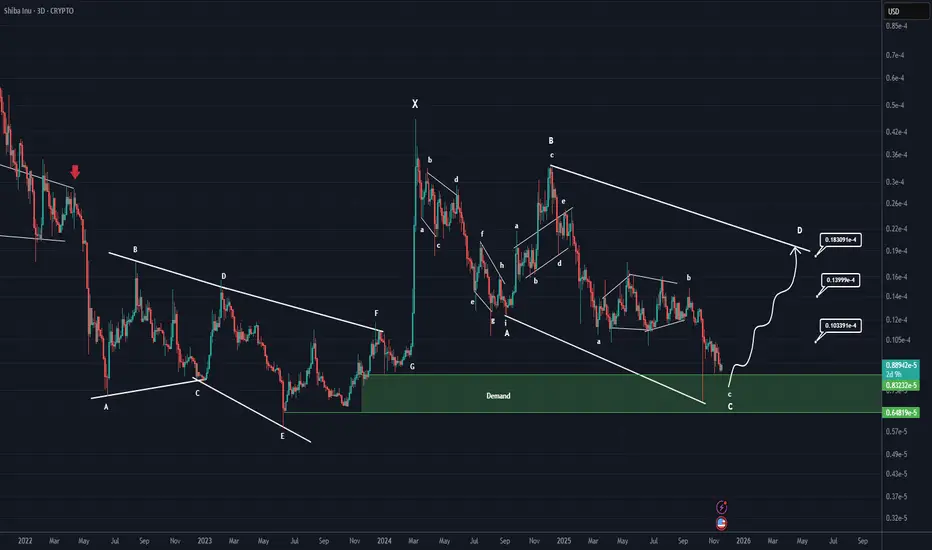
Shiba Inu Will Become Bullish Soon (3D)Shiba Inu is completing a very large correction across higher degrees and larger time frames.
It appears to be in a double or multiple correction, currently in the second phase. This phase itself is a complex correction, and it is now finishing wave C of this complex corrective structure.
The green zone is where Shiba can enter wave D in the higher time frames | a bullish wave.
Remember, we do not make decisions based on emotions; we analyze based on signals and indications.
For risk management, please don't forget stop loss and capital management
When we reach the first target, save some profit and then change the stop to entry
Comment if you have any questions
Thank You

SHIBA Inu Analysis (3D)Shiba Inu is completing a very large correction across higher degrees and larger time frames.
It appears to be in a double or multiple correction, currently in the second phase. This phase itself is a complex correction, and it is now finishing wave C of this complex corrective structure.
The green zone is where Shiba can enter wave D in the higher time frames | a bullish wave.
Remember, we do not make decisions based on emotions; we analyze based on signals and indications.
For risk management, please don't forget stop loss and capital management
When we reach the first target, save some profit and then change the stop to entry
Comment if you have any questions
Thank You
SHIB/USDT — Critical Demand Zone: Reversal or Full Capitulation?SHIB is now revisiting the major demand zone at 0.000007–0.0000055, a level that has acted as the foundation of every major multi-month rally since 2021.
This zone is not just support — it is a psychological pivot that separates long-term accumulation from market capitulation.
Each historical touch of this zone has triggered strong bullish reactions, yet the current structure is different:
Weekly price action continues to print lower highs, signaling that institutional selling pressure remains active while buyer conviction has not yet shown dominance. SHIB is entering a transitional phase, where the next few weekly candles can redefine its macro direction.
---
Price Structure and Market Pattern
1. Descending Structure / Lower Highs
Indicates weakening long-term momentum and the need for strong confirmation before any sustainable bullish reversal.
2. Major Demand Zone (0.000007–0.0000055)
A multi-year accumulation area with repeated deep wicks and strong historical rejections, showing where large players have entered previously.
3. Layered Horizontal Supply Zones
Key resistance levels created by previous distribution phases:
0.0000107
0.0000160
0.0000326
0.0000667
4. Market Compression
The longer price compresses against this demand zone, the larger the eventual breakout impulse — in either direction.
---
Bullish Scenario: A Major Reversal Begins Here
Bullish confirmation requires:
1. A weekly close above 0.000007
2. A strong reversal candle (bullish engulfing, hammer with solid body)
3. Increasing buying volume
4. Early bullish divergence on RSI/MACD (weekly or daily)
If confirmed, upside levels open in stages:
Target 1: 0.0000107
Target 2: 0.0000160
Target 3: 0.0000326
Breaking above Target 3 would signal a potential macro trend shift, turning SHIB from long-term bearish to structurally bullish.
---
Bearish Scenario: Breakdown and Capitulation Phase
Bearish continuation is confirmed if:
1. Weekly close breaks below 0.0000055
2. Retest of 0.000007 fails to reclaim
3. Selling volume accelerates, showing loss of long-term accumulation interest
If this breakdown holds, price opens the door to deeper downside:
0.0000040
0.0000030
These levels represent historical liquidity pockets where capitulation tends to occur before larger players begin accumulating again.
---
Key Takeaway
SHIB is not just sitting at a support — it is testing the macro decision zone that will determine its long-term direction into 2026.
From a probability perspective:
Holding the 0.000007–0.0000055 zone = potential for a major swing rally
Losing it on a weekly close = activation of a deeper bearish leg
The upcoming weekly closures will define whether SHIB resets its long-term trend or enters a prolonged capitulation phase.
---
#SHIB #SHIBUSDT #CryptoAnalysis #MarketStructure #WeeklyChart #SupportZone #DemandZone #PriceAction #AltcoinAnalysis

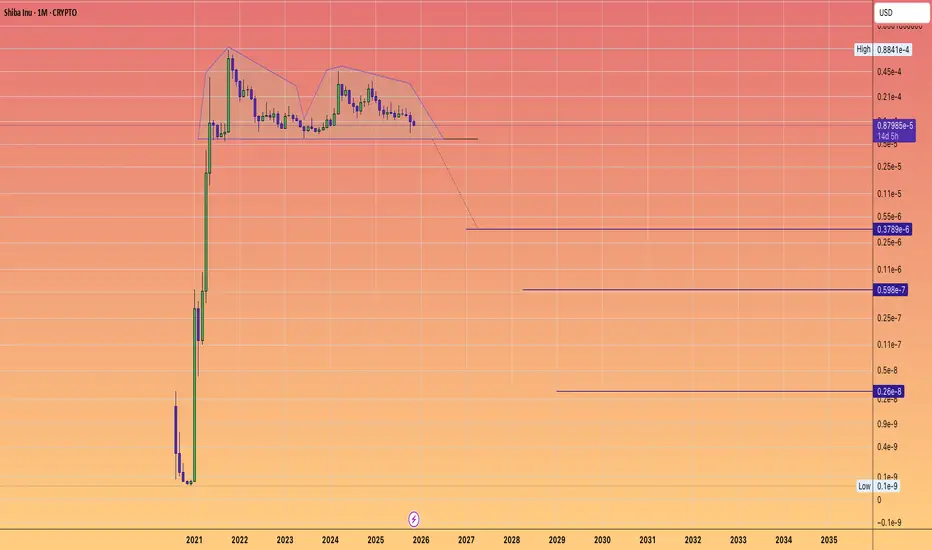
The most significant chart of inefficiency: SHIBA INUCould Shiba have created one of the most significant Double Tops in the history of assets?
Shib, along with a large portion of the Memecoin sector, is currently entering a crypto winter that COULD potentially reset nearly all tokens, coins, and memes lacking inherent utility, broad adoption, or significant social awareness.
Consider the 38 million coins that have been produced.
Which ones are truly necessary to you?
Which ones offer you real value or utility?
Which ones might be able to substitute certain elements of traditional finance?
A casino can certainly be entertaining.
But is living in a casino every day what you really want?
SHIBA's situation+next targets and expected movementsIt seems the price is forming a head and shoulders pattern, which, if correct, suggests a good price increase in the coming days. However, we should wait for the pattern to fully complete.
Best regards CobraVanguard.

Shib(based on NEo wave)this fox make everybody angry or disappointed.
but the story of this cute fox is in long term it can make up to 1000% profit.
for 1000% profit you need to buy it in the deepest price but I prefer to buy it step by step with demand zones and with post pattern confrimation.

100% Win Rate Trade For SHIB Coming Soon!I'm currently observing a potential trading setup in SHIB/USD that mirrors historical patterns we've analyzed. A review of six similar past movements provides us with a data-driven framework for what we might expect.
Historical Performance Snapshot:
• Back testing Win Rate: 100% (6 out of 6 historical setups resulted in upward moves)
• Average Gain: 66.50%
• Average Duration: 46 days
Key Statistical Insights:
• Duration Consistency: The duration of these movements has been moderately consistent, with a standard deviation of just 9.5 days. This suggests a typical timeframe of 36-56 days for a move to play out.
• Gain Variability: It is crucial to note that the gains have been highly variable, with a standard deviation of 30.82%. Past movements have ranged from a 42% gain to as high as 125%.
Back testing Results: It's worth noting that our back testing of this setup shows a 100% win rate across all six historical instances. Every time this pattern has appeared, it has resulted in an upward move. However, while the direction has been consistent, the magnitude of gains has varied significantly.
Interpretation: While the timing of these upward trends has been relatively predictable, the magnitude of the final gain is not. This means that while a move could last approximately a month and a half, the profit potential has a wide range of outcomes.
My Approach: Given the high variability in gains, I'll be watching this setup with a focus on risk management. Setting flexible profit targets and a clear invalidation level is key. This is not financial advice, but an observation based on statistical analysis. Please conduct your own research and manage your risk accordingly.
I will update once the buy signal is in and then once the closing signal appears.
Unfortunately I can not use the other RSI I normally use as its been updated and I am not allowed to upload it due to Trading View rules. The Stochastic RSI is the closest thing I could find to it for now or that allows me to give a visual representation of the trade.
Have a blessed week ahead!
COINBASE:SHIBUSD BINANCE:SHIBUSDT

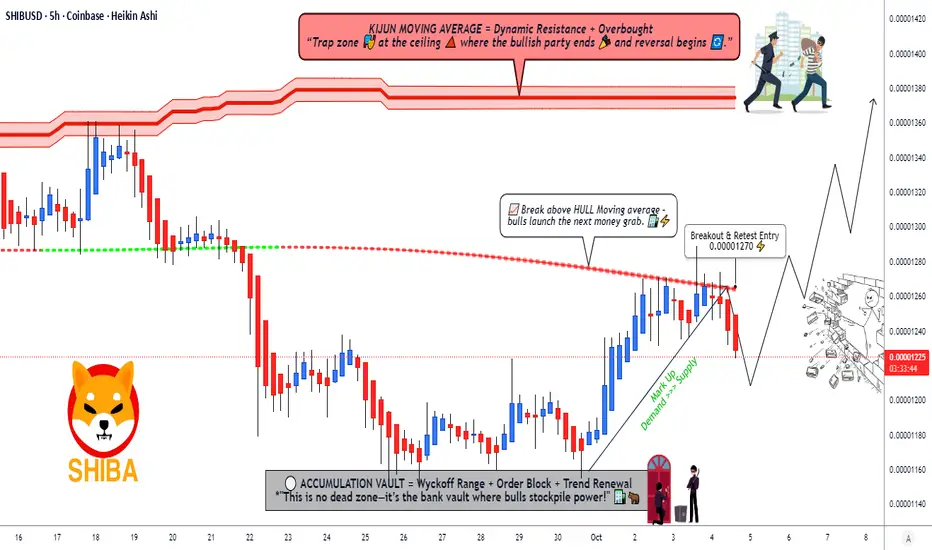
SHIBA INU Strategy Plan | Breakout Entry & Profit Zone🚀 SHIB/USD: Shiba Inu’s Moon Mission! 🌙 Swing/Day Trade Wealth Map 🗺️
🔥 Asset: SHIB/USD (Shiba Inu vs. U.S. Dollar)
🎯 Strategy: Bullish Pending Order – Ready to Ride the Crypto Rocket! 🚀
💡 Vibe: Thief-style, high-energy, fun, and professional – let’s steal some profits (legally, of course)! 😎
📈 Trade Setup: Shiba’s Breakout Bonanza! 🐶💥
Plan: Bullish Pending Order 📡We’re waiting for Shiba Inu to break out like a dog off the leash! 🐕 Once the price smashes through our key level, it’s time to pounce!
Entry: 🏁 0.00001270Set your traps after the breakout at 0.00001270. This is where the Shiba rocket ignites! 🚀 Enter at any price post-breakout, but confirm the move with volume and momentum to avoid fakeouts.
Stop Loss: 🛡️ 0.00001220The "Thief’s SL" is your safety net! Place it below key support to dodge those sneaky market traps. ⚠️ Note: Dear OG Thieves, this SL is my suggestion, but it’s your heist! Adjust based on your risk tolerance and don’t let the market pickpocket you! 💸
Target: 🎯 0.00001370–0.00001380The "Police Barricade" at 0.00001380 is a strong resistance zone, with overbought signals and potential traps waiting! 🛑 Lock in profits around 0.00001370 to stay one step ahead of the market cops. Note: OG Thieves, this TP is my call, but you decide when to cash out! Take profits at your own risk and keep those bags secure! 💰
🔍 Key Points & Correlations
Why SHIB/USD? Shiba Inu is the meme coin with a cult following, driven by community hype and crypto market sentiment. 📣 Breakouts in SHIB often align with broader altcoin pumps, so keep an eye on Bitcoin (BTC/USD) and Ethereum (ETH/USD) for market direction.
Related Pairs to Watch (in USD):
COINBASE:DOGEUSD (Dogecoin): The OG meme coin often moves in tandem with SHIB. If Doge is barking, Shiba might howl! 🐶
BITSTAMP:BTCUSD (Bitcoin): The crypto king sets the tone. A bullish BTC often lifts altcoins like SHIB. 👑
BITSTAMP:ETHUSD (Ethereum): As the backbone of DeFi, ETH’s strength can fuel meme coin rallies. 🛠️
Correlation Note: SHIB tends to follow DOGE’s momentum with a slight lag. Watch DOGE/USD for early signals, and confirm with BTC/USD’s trend to avoid chasing false breakouts.
Technical Nuggets:
The breakout at 0.00001270 is backed by a key support/resistance flip zone. 📊
RSI is nearing overbought at the target zone (0.00001380), signaling a potential pullback. Watch for divergence! ⚡
Volume spikes post-breakout will confirm the move. No volume, no party! 🎉
🕵️♂️ Thief-Style Notes for the Crew
Dear Ladies & Gentlemen (Thief OG’s), this is a high-risk, high-reward heist! 🕵️♂️ I’m sharing my setup, but the market is a wild beast. My SL and TP are suggestions – you’re the master of your own vault! 💼 Trade at your own risk, and always protect your capital like it’s the crown jewels. 👑
✨ “If you find value in my analysis, a 👍 and 🚀 boost is much appreciated — it helps me share more setups with the community!”
Disclaimer: This is a thief-style trading strategy just for fun. Trading involves risks, and past performance is not indicative of future results. Always conduct your own research and trade responsibly. 🕵️♂️
#SHIBUSD #CryptoTrading #ShibaInu #SwingTrading #DayTrading #MemeCoins #BullishBreakout #ThiefStyle #TradingView
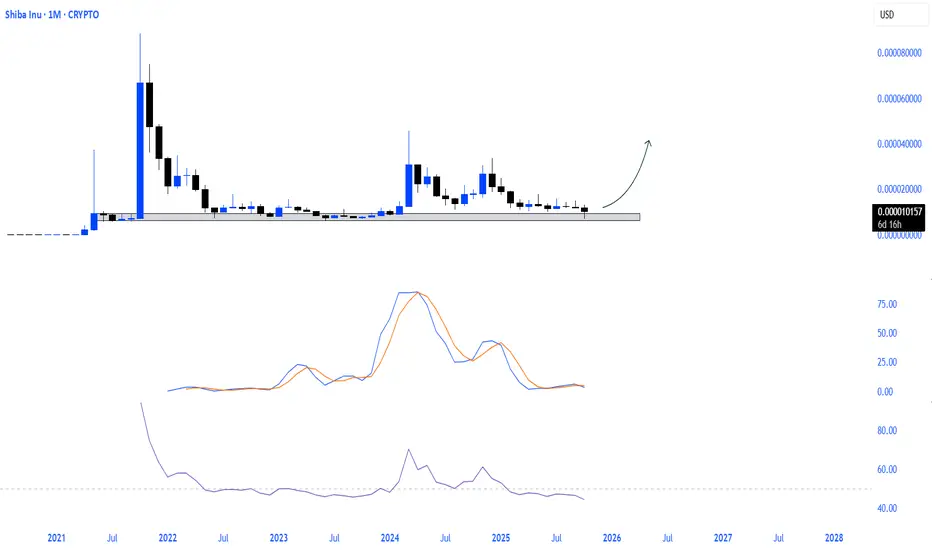
$SHIB the calm before the explode.Shiba Inu momentum is at historic lows.
The price is quietly gathering strength in a major demand zone.
This silence could be the sound of accumulation.
And every accumulation has its breakout.
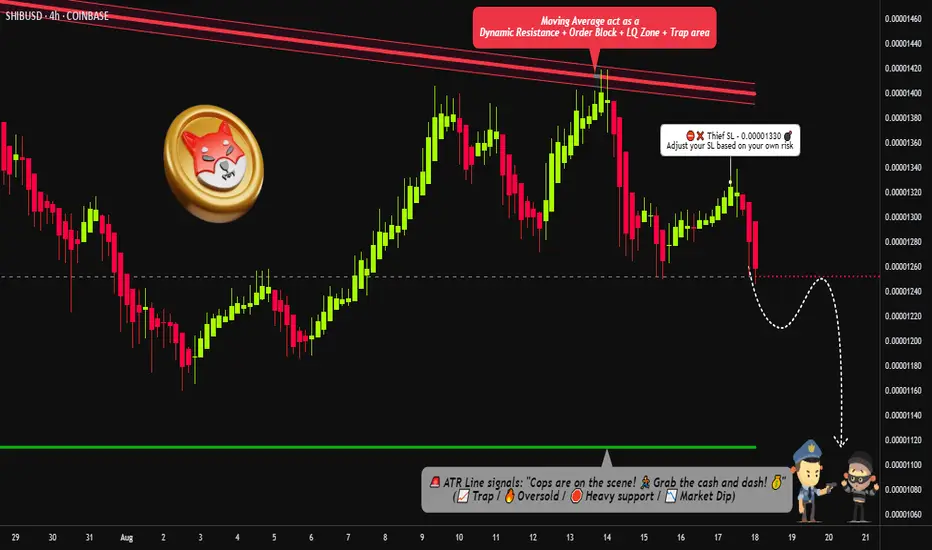
"SHIB Short Opportunity – Quick Heist, Faster Exit!"🔥🦊 SHIB/USD CRYPTO HEIST PLAN – THIEF TRADER STYLE 🚨💰
🔥 Thief OG’s Assemble – Tonight we Rob the SHIBA Vaults 🔥
👑 Dear Ladies & Gentlemen, Fellow Money Thieves, & OG Robbers 🏴☠️💸
Welcome to the Bearish Robbery Plan for SHIB/USD. Strap in, we’re going in with Thief Layering Strategy™ – multiple limit orders to maximize the loot.
📉 ENTRY PLAN – LAYERING STYLE
We don’t enter once… we layer the robbery. Multiple sell-limit orders stacked like a real thief’s toolkit:
💎 (0.00001250)
💎 (0.00001260)
💎 (0.00001270)
💎 (0.00001280)
👉 Add more layers if you want to spread your robbery wide. Remember: thieves don’t knock once, they pick every lock. 🔐
🛑 STOP LOSS (SL) – THIEF ESCAPE HATCH
Our Thief SL is parked at 0.00001330 🚨
But hey, every OG knows – adjust your SL based on your risk appetite & robbery style. 🏃♂️💨
🎯 TARGET – POLICE BARRICADE AHEAD 🚔
There’s heavy police resistance around 0.00001400… so don’t get greedy!
🎯 Our loot target is 0.00001120 💰 – grab it, stash it, and disappear before the cops surround the vault.
📜 MASTER HEIST PLAN
❌ Trend: Bearish (Shiba vault is weak & exposed)
🧨 Method: Layered Sell Orders (Limit Entries)
🏴☠️ Risk: Controlled by Thief SL
💰 Reward: Escape with stolen profit @0.00001120
⚠️ Trading Alert: Police patrol = market volatility (news, events). Avoid fresh robberies during major announcements. Use trailing SL to protect your stash.
💖 If you vibe with this Thief Trading Style™, hit that BOOST 🚀 & LIKE ❤️ to power up the robbery crew.
Together, we rob the market, escape clean, and celebrate with champagne & profits. 🥂💵
📌 Disclaimer: This is a Thief-Style Robbery Plan, not financial advice. Rob responsibly.

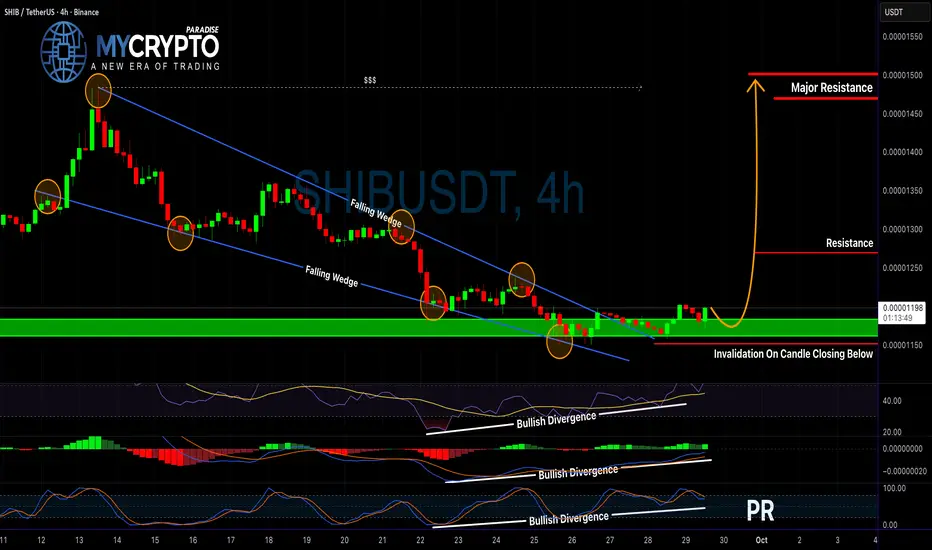
Is SHIB About to Explode or Collapse? Read Before It’s Too LateYello Paradisers! Are you paying attention to SHIB right now? Because this could either be the start of a massive bullish breakout — or the trap that wipes out impatient traders.
💎SHIBUSDT is showing strong potential after breaking out of a falling wedge pattern, which is a classic bullish reversal setup. What makes this move even more convincing is the presence of bullish divergence on the RSI, MACD, and Stochastic RSI — all of which are aligning to support a potential move to the upside.
💎From the current price level, after a proper retest of the support, the setup is still offering a favorable 1:2 risk-to-reward ratio, which is solid for short-term traders.
💎If you’re aiming for even larger risk-to-reward opportunities, you could wait for a more defined retest to enter with tighter risk parameters. However, this comes with the risk of missing the move entirely if the market doesn’t offer that second chance.
💎But here's the key — if the price breaks down and closes below the invalidation level, this entire bullish idea becomes invalid. In that case, it’s much smarter to step back and wait for cleaner price action and a higher-probability setup to form.
💎Discipline always beats impatience.
🎖Strive for consistency, not quick profits. Treat the market as a businessman, not as a gambler. That’s the only way to make it far in your crypto trading journey. Be a PRO.
MyCryptoParadise
iFeel the success🌴
SHIBUSDTBINANCE:SHIBUSDT is now in first reaction to uptrend. I wait for pullback to breakout.
Please control risk management.⚠️
