SHIBA INU Strategy Plan | Breakout Entry & Profit Zone🚀 SHIB/USD: Shiba Inu’s Moon Mission! 🌙 Swing/Day Trade Wealth Map 🗺️
🔥 Asset: SHIB/USD (Shiba Inu vs. U.S. Dollar)
🎯 Strategy: Bullish Pending Order – Ready to Ride the Crypto Rocket! 🚀
💡 Vibe: Thief-style, high-energy, fun, and professional – let’s steal some profits (legally, of course)! 😎
📈 Trade Setup: Shiba’s Breakout Bonanza! 🐶💥
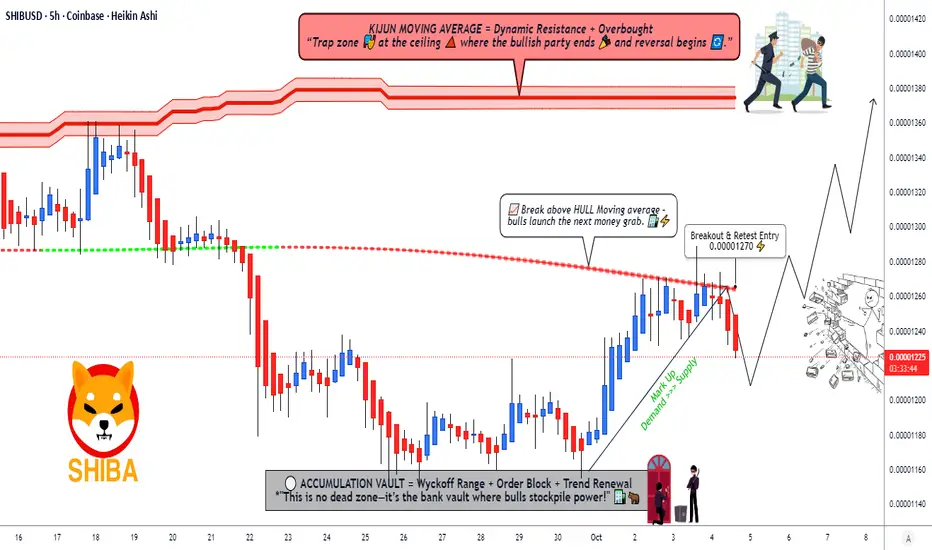
Plan: Bullish Pending Order 📡We’re waiting for Shiba Inu to break out like a dog off the leash! 🐕 Once the price smashes through our key level, it’s time to pounce!
Entry: 🏁 0.00001270Set your traps after the breakout at 0.00001270. This is where the Shiba rocket ignites! 🚀 Enter at any price post-breakout, but confirm the move with volume and momentum to avoid fakeouts.
Stop Loss: 🛡️ 0.00001220The "Thief’s SL" is your safety net! Place it below key support to dodge those sneaky market traps. ⚠️ Note: Dear OG Thieves, this SL is my suggestion, but it’s your heist! Adjust based on your risk tolerance and don’t let the market pickpocket you! 💸
Target: 🎯 0.00001370–0.00001380The "Police Barricade" at 0.00001380 is a strong resistance zone, with overbought signals and potential traps waiting! 🛑 Lock in profits around 0.00001370 to stay one step ahead of the market cops. Note: OG Thieves, this TP is my call, but you decide when to cash out! Take profits at your own risk and keep those bags secure! 💰
🔍 Key Points & Correlations
Why SHIB/USD? Shiba Inu is the meme coin with a cult following, driven by community hype and crypto market sentiment. 📣 Breakouts in SHIB often align with broader altcoin pumps, so keep an eye on Bitcoin (BTC/USD) and Ethereum (ETH/USD) for market direction.
Related Pairs to Watch (in USD):
COINBASE:DOGEUSD (Dogecoin): The OG meme coin often moves in tandem with SHIB. If Doge is barking, Shiba might howl! 🐶
BITSTAMP:BTCUSD (Bitcoin): The crypto king sets the tone. A bullish BTC often lifts altcoins like SHIB. 👑
BITSTAMP:ETHUSD (Ethereum): As the backbone of DeFi, ETH’s strength can fuel meme coin rallies. 🛠️
Correlation Note: SHIB tends to follow DOGE’s momentum with a slight lag. Watch DOGE/USD for early signals, and confirm with BTC/USD’s trend to avoid chasing false breakouts.
Technical Nuggets:
The breakout at 0.00001270 is backed by a key support/resistance flip zone. 📊
RSI is nearing overbought at the target zone (0.00001380), signaling a potential pullback. Watch for divergence! ⚡
Volume spikes post-breakout will confirm the move. No volume, no party! 🎉
🕵️♂️ Thief-Style Notes for the Crew
Dear Ladies & Gentlemen (Thief OG’s), this is a high-risk, high-reward heist! 🕵️♂️ I’m sharing my setup, but the market is a wild beast. My SL and TP are suggestions – you’re the master of your own vault! 💼 Trade at your own risk, and always protect your capital like it’s the crown jewels. 👑
✨ “If you find value in my analysis, a 👍 and 🚀 boost is much appreciated — it helps me share more setups with the community!”
Disclaimer: This is a thief-style trading strategy just for fun. Trading involves risks, and past performance is not indicative of future results. Always conduct your own research and trade responsibly. 🕵️♂️
#SHIBUSD #CryptoTrading #ShibaInu #SwingTrading #DayTrading #MemeCoins #BullishBreakout #ThiefStyle #TradingView
Shibusdtidea
SHIBUSDT — A Major Move Will Be Decided From This Critical Zone!Overview
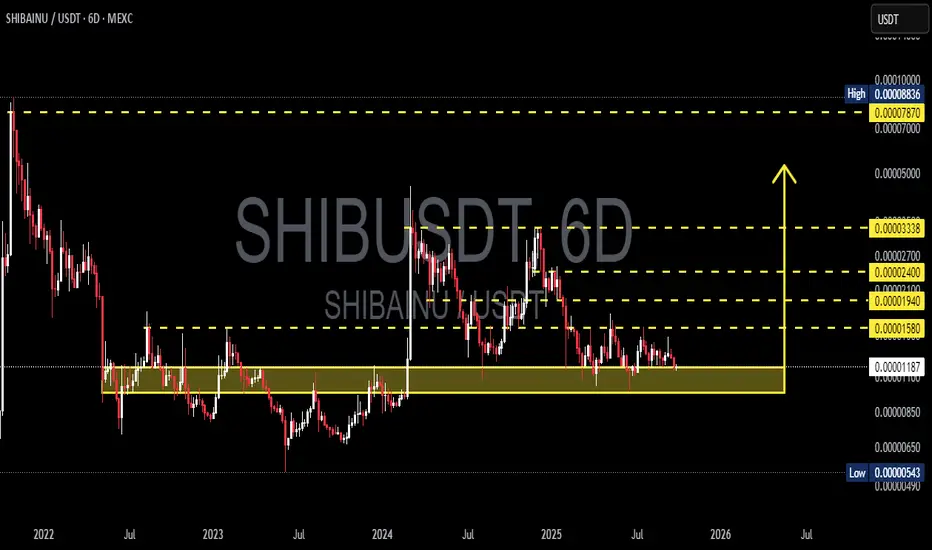
The 6D chart of SHIB/USDT shows a long-term consolidation that has been developing since 2022. Price is once again testing the key demand zone (0.00000850 – 0.00001183), an area that has acted as a strong support multiple times.
This zone is now a true “make or break level” — either SHIB rebounds for a major bullish wave, or it breaks down to much lower levels.
---
Structure & Price Pattern
1. Macro Downtrend
Since the ATH, SHIB has been printing lower highs, showing long-term seller dominance.
Yet, despite selling pressure, the demand zone has held — a sign that large buyers still exist here.
2. Extended Accumulation Zone
The yellow area (0.00000850 – 0.00001183) has acted as a base of accumulation since 2022.
Such prolonged consolidation often precedes explosive moves.
3. Clear Supply Levels
Resistance levels above price:
0.00001580 (initial breakout trigger)
0.00001940 → 0.00002400 → 0.00003338 (progressive bullish targets)
Major supply cluster at 0.00007870 – 0.00008836, which could be a magnet in case of a macro bullish reversal.
4. Volatility Contraction → Imminent Big Move
The 6D candles show a tightening range.
Classic signal of volatility compression, usually followed by a strong breakout or breakdown.
---
Bullish Scenario
Confirmation:
A breakout and 6D close above 0.00001580 with strong volume.
Targets:
0.00001940 → 0.00002400 → 0.00003338.
Ideal sequence:
Accumulation at support → breakout above resistance → retest as new support → rally continuation.
Reward potential: High risk-to-reward setup if the demand zone holds.
---
Bearish Scenario
Confirmation:
A breakdown below 0.00000850 with high volume.
Targets:
First: 0.00000543,
Then: potential new lows if liquidity is drained.
Risk:
If support fails, SHIB could enter a capitulation phase with accelerated downside.
---
Market Interpretation
Optimistic Buyers: See this as a long-term accumulation opportunity.
Cautious Sellers: A breakdown could trigger a steep sell-off.
Neutral Traders: Waiting for confirmed breakout/breakdown before committing larger positions.
---
Conclusion
SHIB is sitting at a critical zone that will define its macro direction into 2025–2026.
Holding support → opens path for multi-level rally.
Losing support → risk of deeper correction.
For long-term investors, this is the area to watch closely.
For swing traders, waiting for clear confirmation is the safer strategy.
---
#SHIB #SHIBUSDT #CryptoAnalysis #TechnicalAnalysis #SupportResistance #CryptoTrading #PriceAction #Accumulation #BreakoutSetup
SHIB/USDT – Scaling Into a Bullish Breakout with Layered Entries🚀 SHIB/USDT (Shiba Inu) – Day Trade Setup 🐕🔥
📊 Trade Plan: Bullish Momentum
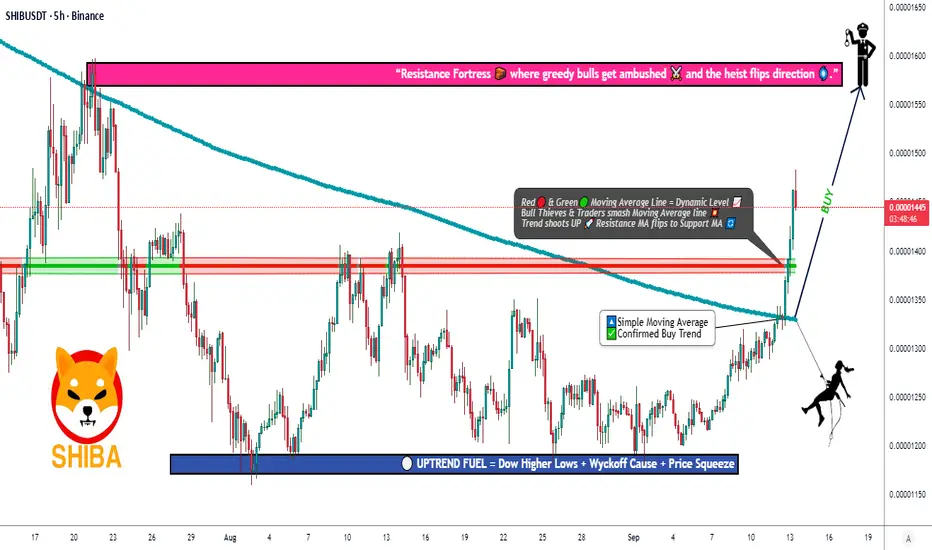
We’re spotting a Simple Moving Average breakout + Ichimoku Kijun confirmation, signaling that Shiba Inu might be gearing up for a bullish push. Momentum traders, this is where the action gets exciting. ⚡
🛠 Entry Plan
Using a layered limit order strategy (stacked entries), which allows better scaling in. Suggested layers below 👇:
0.00001400
0.00001420
0.00001440
0.00001460
(💡 You can increase or adjust the layers based on your own strategy.)
🛡 Stop Loss (Risk Guard)
A potential SL can be placed around 0.00001350, right after the breakout zone.
⚠️ Note: Adjust your SL according to your risk tolerance and personal trading style.
🎯 Target (Exit Strategy)
Upside target is placed at 0.00001580, where strong resistance and possible overbought conditions may appear. This is the "take profit & step out gracefully" zone.
⚠️ Reminder: This is not a fixed TP suggestion—manage your exits based on your own plan.
🔗 Related Pairs to Watch
Shiba Inu often correlates with other meme coins and ETH-related flows:
BINANCE:DOGEUSDT 🐶 (moves in tandem with SHIB sentiment)
BINANCE:PEPEUSDT 🐸 (new-gen meme coin hype correlations)
BINANCE:ETHUSDT 🔑 (Ethereum gas activity impacts SHIB ecosystem)
BINANCE:BTCUSDT 💰 (macro driver of overall crypto risk-on/off)
Watching these pairs together can give more conviction on momentum shifts.
✨ “If you find value in my analysis, a 👍 and 🚀 boost is much appreciated — it helps me share more setups with the community!”
#SHIB #SHIBA #CryptoTrading #Altcoins #MemeCoins #DayTrading #TradingView #Ichimoku #MovingAverage #SHIBUSDT
SHIBA/USDT Testing the Make-or-Break Zone — End of Accumulation?🧠 Overview:
SHIBA/USDT is once again testing a critical support zone that has held strong since early 2022. This area isn’t just a technical level — it represents a long-term accumulation zone where buyers have consistently stepped in.
What happens next could define SHIB's mid to long-term trend. Will we see a major bullish reversal, or is a breakdown and deeper correction looming?
---
📊 Technical Breakdown:
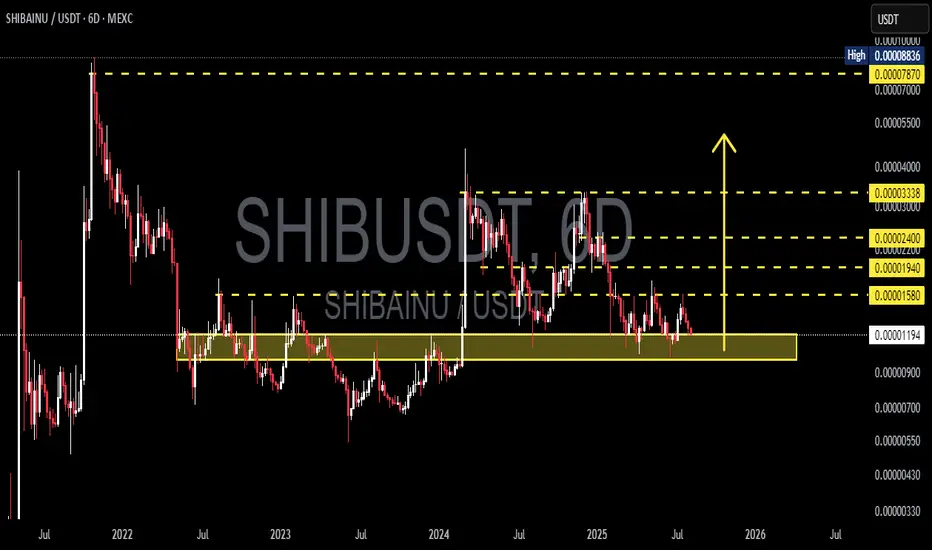
Key Demand Zone (Major Support):
🔸 0.00001090 – 0.00001190 USDT
This zone has been tested multiple times over the past two years. It remains the last major stronghold for bulls. A breakdown here could trigger panic selling.
Important Resistance Levels (Bullish Targets):
🔹 0.00001580 → Initial resistance
🔹 0.00001940 → Previous distribution area
🔹 0.00002400 → Strong psychological level
🔹 0.00003338 → Mid-term bullish target
🔹 0.00007870 – 0.00008836 → High timeframe supply zone and potential long-term profit-taking area
Market Structure:
🔸 Price remains inside a long-term horizontal consolidation range
🔸 No clear breakout yet, but early signs of buyer interest are forming
🔸 Possibility of forming a double bottom or accumulation breakout if bullish momentum strengthens
---
📈 Bullish Scenario:
✅ Price holds above 0.00001190 support
✅ Breakout above 0.00001580 = early trend reversal signal
✅ Bullish confirmation with volume increase
✅ Mid-term targets: 0.00001940 → 0.00002400 → 0.00003338
✅ Long-term potential: Retest of 0.00007870 – 0.00008836 (key supply zone)
---
📉 Bearish Scenario:
❌ Breakdown below 0.00001090 = major bearish signal
❌ Potential drop toward lower zones:
▪️ 0.00000900
▪️ 0.00000700
▪️ 0.00000550 (next key support zone)
❌ Price structure shifts to lower lows, indicating trend weakness and potential distribution phase
---
🧩 Pattern Insights:
📌 Market showing signs of Sideways Accumulation for over 1.5 years
📌 Could be a Re-Accumulation Phase before a major breakout
📌 Current movement resembles a Wyckoff-style Spring, which often precedes an upward expansion
---
📌 Conclusion:
SHIB is standing at a major inflection point. If buyers continue to defend this support zone, it could mark the beginning of a new bullish cycle. However, if this level breaks, further downside is highly likely.
This is a moment of calm before potential volatility — stay alert and watch volume + price action closely.
#SHIB #SHIBUSDT #CryptoBreakout #SupportZone #AltcoinAnalysis #SHIBAInu #TechnicalAnalysis #AccumulationPhase #WyckoffMethod #CryptoBullish #CryptoBearish
SHIBUSDT | Explosive Breakout from Long-Term Downtrend!📊 Overview:
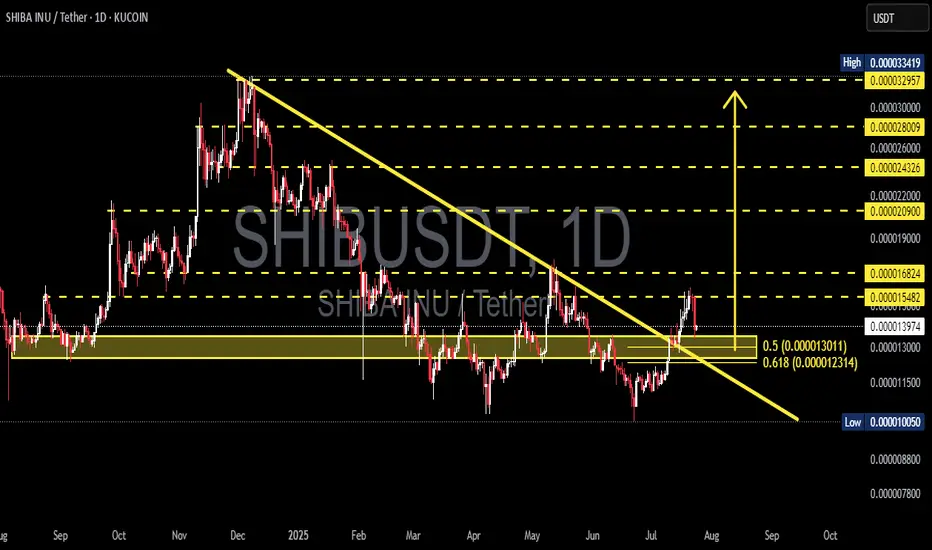
After months of being trapped in a major downtrend, SHIBA INU (SHIBUSDT) has finally broken out of a multi-month descending trendline that has been capping price action since late 2024. But this isn’t just a minor breakout — this could mark a macro trend reversal, with bullish momentum building up fast.
---
📐 Technical Breakdown (Daily Chart – KuCoin):
🟡 Chart Pattern:
A clear Falling Wedge pattern has been forming since December 2024.
The breakout occurred mid-July 2025 with strong price action and early confirmation from volume.
Falling wedge is typically a bullish reversal pattern — and this breakout confirms that narrative.
🟨 Breakout Zone:
Price decisively broke above the descending trendline and is now consolidating just above it.
A successful retest of the breakout level strengthens the bullish case.
🟦 Key Fibonacci Support – “Golden Pocket”:
The zone between 0.000013011 (Fib 0.5) and 0.000012314 (Fib 0.618) is now acting as strong support.
Known as the “Golden Pocket”, this zone is often where high-probability reversals occur.
---
🚀 Bullish Scenario (High Probability):
As long as price stays above the Fibonacci golden pocket, SHIB is well-positioned for a continued rally. Key upside targets include:
1. 📍 Target 1: 0.000016824 → Previous key resistance
2. 📍 Target 2: 0.000022000 → February supply zone
3. 📍 Target 3: 0.000029000 → Major historical resistance
4. 🏁 Target 4 (Full Extension): 0.000033419 → Potential top of the breakout range
If momentum and market sentiment align, SHIB may be entering a new bullish cycle.
---
🔻 Bearish Scenario (Low Probability, but Manage Risk):
If price fails to hold above the golden pocket:
🔽 Support 1: 0.000011500 → Previous consolidation base
🔽 Support 2: 0.000010050 → Historical demand zone
A breakdown below 0.000010050 would invalidate the bullish structure and shift SHIB back into a prolonged accumulation phase.
---
🔍 Conclusion & Market Sentiment:
✅ The trend has flipped! This is one of the most anticipated breakouts for SHIB holders. As long as the structure holds above the golden pocket zone, the bullish outlook remains very strong.
⚠️ However, beware of potential fakeouts if volume drops or Bitcoin triggers broad market weakness.
---
📢 Trading Setup (Not Financial Advice):
For Bulls: Look for entries around 0.00001350–0.00001300
Stop-loss: Below 0.00001220
Take-profits: 0.0000168 → 0.000022 → 0.000029
For Bears: Wait for breakdown below 0.00001200 to consider short positions
---
🧠 Final Notes:
> SHIB remains a high-volatility microcap token. It's a prime pick for swing traders and momentum hunters — but risk management is key. Keep an eye on BTC for confirmation or invalidation.
#SHIBUSDT #SHIBA #SHIBBreakout #AltcoinSeason #BullishSetup #GoldenPocket #FallingWedge #CryptoSignals #TechnicalAnalysis #BreakoutPlay
SHIBA INU Heist Plan: Rob the Market, Ride the Bull!💎🚨 "SHIBA INU Crypto Heist Plan: Rob the Market or Get Robbed!" 🚨💎
Thief Trading Style | SHIBA/USD | Bullish Analysis | DCA Heist Strategy | Swing & Scalping Masterplan
🌍 Hey World! 👋 Hola, Ola, Bonjour, Hallo, Marhaba! 🌟
To all the Market Robbers, Bulls in Disguise, and Silent Money Movers — welcome to Thief Trading’s Heist Blueprint 💼🔫 for SHIBA INU vs. USD!
📊 Chart Analysis Breakdown:
Based on my Thief Trading™ Style – a fusion of technical setups, fundamentals, and macro crime-scene evaluations – we’re executing a bold LONG setup targeting a bullish breakout. 🕵️♂️💥
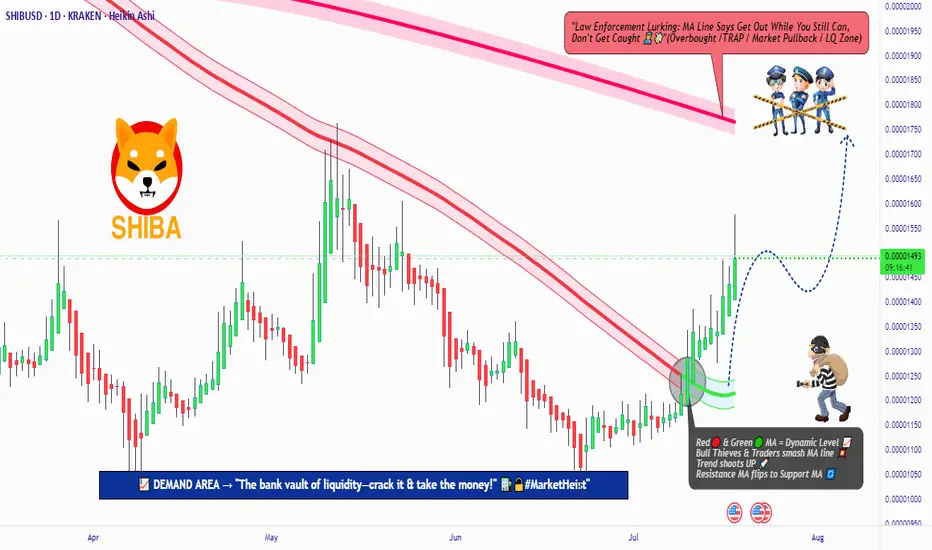
This heist involves breaking past the Police Resistance Checkpoint (moving average red zone), where bearish forces and retail roadblocks stack up.
💹 Heist Entry Strategy:
📍Entry Idea: “The vault's cracked open!”
Longs can be triggered at market price – but wise robbers use precision:
⏱ Place Buy Limit Orders near 15min or 30min swing low pullbacks.
💼 DCA / Layered Entry Method is advised – the more stealthy the approach, the bigger the bag.
🛑 Risk Management:
📌Stop Loss (SL):
Set near recent swing highs/lows on the 1D candle wick zone.
🔒 Example SL: 0.00001300
Remember, SL should scale with your risk appetite, lot size, and number of entries.
🎯 Thief Target:
📍 Target: 0.00001770 or jump off early if the cops (market sellers) start closing in.
You don’t need to wait for the vault to be empty — grab what you can and exit clean.
🔍 Scalper's Shortcut:
Only long-side scalps are valid here.
💰 Big pockets = Fast Entry
💼 Small pockets = Join the Swing Gang
Use Trailing SL to guard your loot and stay agile in the escape.
🧠 Why This Heist? (Fundamentals Insight):
SHIBA/USD is heating up 🔥 due to:
Bullish sentiment in crypto
On-chain activity uptick
Retail momentum shifts
Intermarket cues lining up
📚 Dive deeper into:
📰 News Impact
📊 COT Reports
🔗 On-chain metrics
🧭 Sentiment & Intermarket Guidance
⚠️ Risk Zone Alert:
🚨 News events = Market Chaos
➡️ Avoid fresh entries near news drops
➡️ Use Trailing SLs to lock profits & manage active positions wisely
🙌 Support the Heist Movement:
🔥 Hit the BOOST button if you vibe with the Thief Trading style!
Every boost helps power the team to deliver more precision setups, market heists, and easy-to-follow strategies daily. 💸💎💪
📌 Important Disclaimers:
This is a general market outlook and not financial advice. Always analyze based on your own system and risk tolerance. Markets shift fast — stay updated and adapt.
💬 Comment below if you're on the crew. Let's rob the market together — one chart at a time.
🚀 See you in the next heist, Money Makers! Stay silent, move smart, and steal success! 🤑🐱👤🏆
SHIBUSDT 6D Analysis SHIB ~ 6D Analysis
#SHIB Buy back gradually from here if you still have confidence in this coin with a short term target of at least 20%+ from this support.

SHIBUSDT 2D AnalysisSHIB ~ 2D Analysis
#SHIB Buy on retest of this buy zone with short term target of at least 15%+ from here.

SHIBUSDT 6DSHIB ~ 6D Analysis
#SHIB Buy gradually from here with a short -term target of at least 20%+.

SHIBUSDT 6DSHIB ~ 6D Analysis
#SHIB Support that you might be able to consider to start buying back from here.
Reason, So far it still maintains this block of support.

SHIBUSDT 6DSHIB ~ 6D
#SHIB Double top hard occurs in this coin meme. If the re -testing of this support block occurs, this is a very good opportunity to start buying again. Target 20%+

SHIBUSDT 6DSHIB ~ 6D
#SHIB If you still have Conviction on this coin,. Buy gradually after retesting this support block, with a target of at least 20%+

SHIB IS PRIMED FOR A MASSIVE 123% MOVE HIGHERCRYPTOCAP:SHIB
SHIB IS BREAKING OUT AND IT'S A BUY RIGHT NOW!
ITS A #HIGHFIVESETUP MEANING THE FOLLOWING:
1.) BULLISH uptrend on MACD (blue over orange
2.) BULLISH uptrend on RSI (higher lows)
3.) BULLISH uptrend on Stoch (red over yellow)
4.) We have a volume shelf with a volume gap
5.) Breakout on the symmetrical triangle pattern
Price Targets for this Weekly chart:
PT1: 0.000029584
PT2: 0.000044097

SHIBUSDTSHIB ~ 1W
#SHIB So far it continues to maintain this support Block. Make purchases gradually from here. with a minimum target of 20%++

SHIBAUSDT 1WSHIB ~ 1W
#SHIB This support block would be a very interesting buy for now.
We will place small purchases here. Expect a 20%+ increase at minimum.

it's the time to start the BULLRUN for SHIBA INUBINANCE:SHIBUSDT finished the wave 4 of Elliott 5 waves & now we are at the start of wave 5 & targets on the chart.
Let's start the BULLRUN for SHIBA INU

$SHIB TO THE MOON ?👨🏻💻 CRYPTOCAP:SHIB
#SHIB had a quick dip below the support line to trigger stop losses, but is now showing a strong upward movement👀
We'll have to wait and see if the price can break through the descending resistance, as the next move will be decided by a break of the triangle pattern📈
- - - - - - - - - - - - - - - - - - - - - -
Follow #CryptoEase and Share it With Your Crypto Mate 😉
BINANCE:SHIBUSDT

SHIBUSDT: Two Possible Areas for Swing Buy. Dear Traders,
We have two possible buying opportunites on SHIBUSDT price is currently accumulating and if price do not decide to manipulate then we can see strong price rebound from current price region. However, if price manipulate then we can see it going down to our second entry there we have imbalance zone which will filled and can see strong bullish rebound.
**Like and comment our ideas which will support us to bring you more educational ideas and our views on all financial instruments**
Team SetupsFX_

SHIBAUSD 12HSHIB ~ 12H 📈
#SHIB Successfully penetrated the resistance of this pattern. We will start making purchases gradually from here, with a minimum target of 15%++

SHIBAUSD 6HSHIB ~ 6H 📈
CRYPTOCAP:SHIB Make a purchase after successfully breaking this resistance line or buy after Retesting the nearest support. with a minimum target of 15%+

SHIB (Shiba Inu) Technical Analysis & Trade Idea (video)Further to my previous post I thought I would do a video to explain my thought process behind the trade idea.
SHIBA INU has been experiencing significant selling pressure, compromising its previous bullish trend and indicating a potential reversal. The 50% Fibonacci retracement level presents a logical entry point for a short position. As the market seeks liquidity, price action could target previous swing lows. Consider initiating a short position on #SHIB at the 50% Fibonacci retracement level with targets at previous swing lows, employing a strict stop-loss above the recent swing high.
Important Disclaimer: This analysis serves as a technical perspective and should not be treated as direct financial advice. Conduct your own thorough due diligence and implement sound risk management strategies before executing any trades.

SHIBUSDTBe prepared for the final and upward wave of BINANCE:SHIBUSDT . Entry and exit points have been identified on the chart.
"Daily crypto market analyses I provide are personal opinions & not financial advice. Trading carries risks, so do your own research & seek advisor's help."
Don't forget to like and comment

SHIBA/USDT longterm possible scenariosShiba longterm possible scenarios from my view.
🤌THIS IS NOT A FINANCIAL ADVICE, PLEASE INVEST AT YOUR OWN RISK
