SHIBA INU Strategy Plan | Breakout Entry & Profit Zone🚀 SHIB/USD: Shiba Inu’s Moon Mission! 🌙 Swing/Day Trade Wealth Map 🗺️
🔥 Asset: SHIB/USD (Shiba Inu vs. U.S. Dollar)
🎯 Strategy: Bullish Pending Order – Ready to Ride the Crypto Rocket! 🚀
💡 Vibe: Thief-style, high-energy, fun, and professional – let’s steal some profits (legally, of course)! 😎
📈 Trade Setup: Shiba’s Breakout Bonanza! 🐶💥
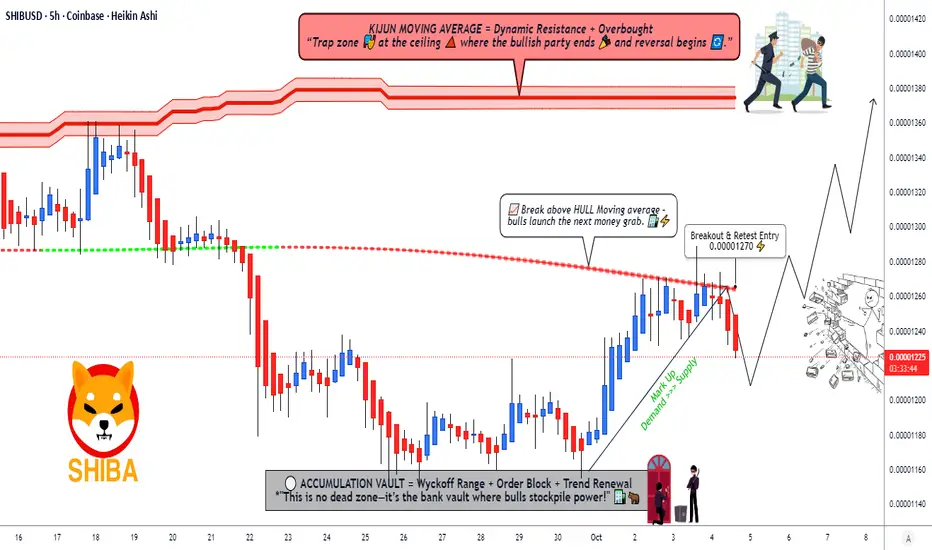
Plan: Bullish Pending Order 📡We’re waiting for Shiba Inu to break out like a dog off the leash! 🐕 Once the price smashes through our key level, it’s time to pounce!
Entry: 🏁 0.00001270Set your traps after the breakout at 0.00001270. This is where the Shiba rocket ignites! 🚀 Enter at any price post-breakout, but confirm the move with volume and momentum to avoid fakeouts.
Stop Loss: 🛡️ 0.00001220The "Thief’s SL" is your safety net! Place it below key support to dodge those sneaky market traps. ⚠️ Note: Dear OG Thieves, this SL is my suggestion, but it’s your heist! Adjust based on your risk tolerance and don’t let the market pickpocket you! 💸
Target: 🎯 0.00001370–0.00001380The "Police Barricade" at 0.00001380 is a strong resistance zone, with overbought signals and potential traps waiting! 🛑 Lock in profits around 0.00001370 to stay one step ahead of the market cops. Note: OG Thieves, this TP is my call, but you decide when to cash out! Take profits at your own risk and keep those bags secure! 💰
🔍 Key Points & Correlations
Why SHIB/USD? Shiba Inu is the meme coin with a cult following, driven by community hype and crypto market sentiment. 📣 Breakouts in SHIB often align with broader altcoin pumps, so keep an eye on Bitcoin (BTC/USD) and Ethereum (ETH/USD) for market direction.
Related Pairs to Watch (in USD):
COINBASE:DOGEUSD (Dogecoin): The OG meme coin often moves in tandem with SHIB. If Doge is barking, Shiba might howl! 🐶
BITSTAMP:BTCUSD (Bitcoin): The crypto king sets the tone. A bullish BTC often lifts altcoins like SHIB. 👑
BITSTAMP:ETHUSD (Ethereum): As the backbone of DeFi, ETH’s strength can fuel meme coin rallies. 🛠️
Correlation Note: SHIB tends to follow DOGE’s momentum with a slight lag. Watch DOGE/USD for early signals, and confirm with BTC/USD’s trend to avoid chasing false breakouts.
Technical Nuggets:
The breakout at 0.00001270 is backed by a key support/resistance flip zone. 📊
RSI is nearing overbought at the target zone (0.00001380), signaling a potential pullback. Watch for divergence! ⚡
Volume spikes post-breakout will confirm the move. No volume, no party! 🎉
🕵️♂️ Thief-Style Notes for the Crew
Dear Ladies & Gentlemen (Thief OG’s), this is a high-risk, high-reward heist! 🕵️♂️ I’m sharing my setup, but the market is a wild beast. My SL and TP are suggestions – you’re the master of your own vault! 💼 Trade at your own risk, and always protect your capital like it’s the crown jewels. 👑
✨ “If you find value in my analysis, a 👍 and 🚀 boost is much appreciated — it helps me share more setups with the community!”
Disclaimer: This is a thief-style trading strategy just for fun. Trading involves risks, and past performance is not indicative of future results. Always conduct your own research and trade responsibly. 🕵️♂️
#SHIBUSD #CryptoTrading #ShibaInu #SwingTrading #DayTrading #MemeCoins #BullishBreakout #ThiefStyle #TradingView
Shibusdtsignals
SHIBUSDT Will skyrocket if it breaks this pattern*** ***
For this particular analysis on Shiba Inu we are using the SHIBUSDT symbol on the OKX exchange.
*** ***
The idea is on the 1D time-frame where SHIB has been trading within a Triangle pattern since the May fall. Based both on the price action and the 1D RSI sequence, it resembles a lot the 'Accumulation' Triangle that followed the May 2021 fall. This pattern broke hyper parabolically to the upside, when the price broke above its top (Lower Highs trend-line). =
Of course the fundamentals at the time were (much) different but patterns tend to follow certain human psychology behind them. If the market does enter into a new Bull Cycle by the time SHIBUSDT breaks above it's Triangle, it is not that unlikely (having the right fundamentals behind it, e.g. Twitter) to see it hit the 0.000025 - 0.000030 zone, being one of the first token to turn parabolic and lead the bull season.
-------------------------------------------------------------------------------
** Please LIKE 👍, SUBSCRIBE ✅, SHARE 🙌 and COMMENT ✍ if you enjoy this idea! Also share your ideas and charts in the comments section below! This is best way to keep it relevant, support me, keep the content here free and allow the idea to reach as many people as possible. **
-------------------------------------------------------------------------------
You may also TELL ME 🙋♀️🙋♂️ in the comments section which symbol you want me to analyze next and on which time-frame. The one with the most posts will be published tomorrow! 👏🎁
-------------------------------------------------------------------------------
👇 👇 👇 👇 👇 👇
💸💸💸💸💸💸
👇 👇 👇 👇 👇 👇

Trading opportunity for DOGEUSDTBased on technical factors there is a Short position in :
📊 SHIBUSDT
🔴 Short Now 0.00000916
🧯 Stop loss 0.00000982
🏹 Target 1 0.00000860
🏹 Target 2 0.00000764
💸RISK : 1%
We hope it is profitable for you ❤️
Please support our activity with your likes👍 and comments📝

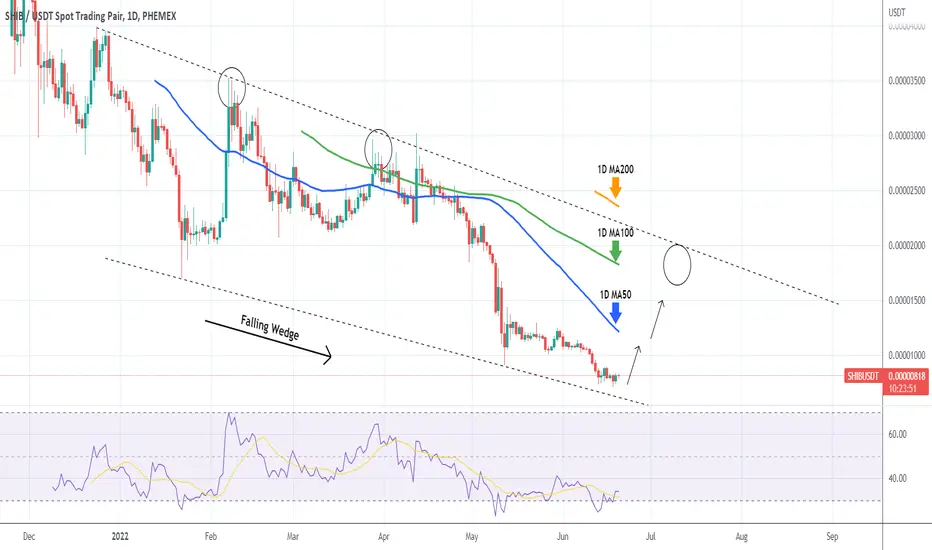
SHIBUSDT Falling Wedge forming a Bottom*** ***
For this particular analysis on SHIBA we are using the SHIBUSDT symbol on the Phemex exchange.
*** ***
The idea is on the 1D time-frame where Shiba has been trading within a Falling Wedge pattern since the December 24 2021 High. The price has been trading near the pattern's Lower Lows trend-line since the May 12 Lower Low, being unable to stage a sustainable rebound. The longer it trades near that level, the more likely it is to attract buyers and form a bottom.
The immediate target is always the 1D MA50 (blue trend-line) and a closing above it takes us to the medium-term 1D MA100 (green trend-line). Only a break above the 1D MA200 (orange trend-line) can justify further buying, in which case we'll have a long-term bullish reversal into a new Bull Cycle.
--------------------------------------------------------------------------------------------------------
Please like, subscribe and share your ideas and charts with the community!
--------------------------------------------------------------------------------------------------------