$SHOP - ACTIVE BEARISH HEAD AND SHOULDERS TOPThis is just what the charts are telling me so I would like to see what you all think too.
Shopify

PLYZ ABOUT TO GO PARABOLIC $1 DOLLAR Parabolic move coming. $1 DOLLAR Price Target! penny stock huge opportunity with merger or acquisition.

SQ (SQUARE) Big Shorting opportunity aheadToday were taking a look at SQ (SQUARE)
So SQ made a big move down for earnings around the $225 level.
This level is widely being considered as a "buy the dip" opportunity which very well may be. However obviously we are offering a different perspective and heres why:
Reason 1:
We spend more than 3x the effort (activity) on August 2nd than we did on February 16th to make the same level highs. (relatively, weekly outlook)
So if we have more participants and cant breach a new level we have to consider that perhaps long isnt the direction.
Reason 2: 235-240 zone was a big area that held as support for nearly 5 months. We finally broke down and closed from that level. So for Operators to immediately reclaim that level is just a less than probable event.
Reason 3: Although not very clear it appears we have completed the B corrective wave and are well into our C distribution wave. We are referencing Elliot waves here. A modest 1:1 ration gets us to the 200-208 destination. Note: 1.5x and 2x distribution waves are no stranger.
There are a few more things happening here that are subjective that I will leave off such as harmonic patterns and the overall type of bearish structure we are in. In this case I dont think we need to add that to the confluence. Theres enough to suggest a lower price is more likely than not going to be realized.
As stated I like the 235 to 240 maybe even 242 area for shorts/puts to be initiated.
If you were to go into a lower time frame like the 4hr or the hourly you can find a much more precise entry point with a more favorable risk profile if not this would be a 1:1 trade short.

SHOP - $1500 Incoming (SHORT)If the market continues to pull back a SHOP looks to be pulling back to the next support level of $1500 and could then fall to $1435. Now some look at this as a stay at home play so if the market bounces it can push back up to ATH

Short-term pressure / Long-term up trendShort-term (next few weeks) could see downward pressure from the overall market move.
Look for support at 1189 and/or the lower part of the channel for a bounce before moving higher.
Trading in a bullish uptrend channel


11/19 Watchlist #2 - $SHOP $1700, $1720 C *SCALP* $SHOP $1700 Calls 11/19 *SCALP*
Plan:
Scalp (1-10 minute trade)
Enter $SHOP $1700 C
Exit at $1718
Price targets: $1718, $1720, $1740
Technical Analysis:
Bull flag breakout
Bounce off hourly pivot

11/15-11/19 watchlist #3 $SHOP $1650, $1620 BOUNCE
Price targets: $1675, $1700
Technical Analysis: All-time high breakout & momentum bounce
News Catalyst: "In a week of whipsaw or negative action in many highflying stocks, Shopify stock made a powerful move Friday, clearing a trend line break in huge volume, offering an early entry in the morning and ultimately clearing the 1,650 Buy point" - Investor's Business Daily

SHOP getting ready for takeoff 🚀Shop daily trading in this range. Once we break out to the upside we can really fly if we break the All Time High. I would wait for the ripster clouds to also turn green again first.


$SHOP rejected again at resistance level, heading towards 1150$SHOP got rejected again at resistance level from long time July 21, can see 1200 / 1150 unless it breaks above 1500 - maybe earnings does the trick but until then we are heading down only on this.

A quick analysis of SHOP, what can we see? Today we will take a quick look at the SHOP chart.
What we can see here is:
a) Ascending Channel, the price was rejected from the lower trendline.
b) ABC corrective pattern (apparently finished).
c) Support/Resistance zone (we want to see the price above that level, to think in bullish opportunities).
Based on all those items, if the price reaches our green horizontal line, we will consider that to activate the bullish view towards the targets we have defined using fibo extensions.
Our invalidation level will be below "C" either the analysis is executed or not.
Thanks for reading!


$SHOPShopify stock has made long-term investors a boatload of money.
If you would have been able to buy shares of the e-commerce subscription platform at its 2015 IPO price, you'd be sitting on gains of nearly 9,000%!
In this short period, the company has risen to become the largest Canadian company by market capitalization with a valuation approaching $200 billion.
Still, the company has its work cut out for it to earn "four-comma status" by 2025.
In the second quarter, Shopify did so by beating analyst expectations on the top line by reporting total revenue growth of 57% and its first $1 billion quarter. However, the numbers are even better than they initially appear when broken down by segment.
Shopify's smaller revenue source is subscription services, the fees it charges sellers, or "merchants," to use its tools. The second is merchant services, which consists of the revenue Shopify earns from those merchants in the form of add-on services like payment processing and transaction fees.
In the year-ago quarter, merchant services grew faster than subscription revenue, which makes sense when you consider the pandemic increased the demand for online shopping. This year's growth was led by subscription services, which was boosted by more merchants beginning to use Shopify's e-commerce platform and existing merchants buying higher-priced subscription bundles.
When we take a look at the technical side of things Shopify looks incredible on the higher timeframes.
Looking at the weekly chart we are currently sitting at long term support and this might be something you might want to keep your eyes on going into next weeks trading sessions.
If price is able to hold these levels we could see Shopify continue it way up.
When we move down to the daily chart for indicators we have;
MACD curling
RSI breaking above 50.
Watchlist this.

SHOP is highly undervalued at this pointShop just hit its long term support and has similar RSI levels as March 2020 (Covid flash crash). IMO SHOP is highly undervalued and has been consolidating around the 17000-1900 range. Next leg up should take it to $3000 and then finally the 5th wave could propel us to around $4200 in the next 6 months. Going long with full force. Not financial advice!
Like and share my TA and follow me for more free alpha.
Cheers!

SHOPCalls can work over 1400 tomorrow. Levels above 1400 are 1431, 1453.
Trade Idea: 1415C 10/8 *lotto (high risk)
BID/ASK: 3.30/5.00


Shopify about to hit long term supportShopify about to hit it's long term support. Longing at CAD$1650, Sell at CAD$1970

SHOP descending wedge is as at a lower edgeWhile I'd look for a breakout to the upside to this descending wedge, I think it's equally likely that price will bounce off my purple breakout line and head down for another leg. We'll have to wait and see.
It's also noteworthy to notice we're now trading below the grey resistance area, so that might add an additional ceiling to bounce off.

SHOP.... drop? ($1300)So I posted an idea about BYND that involves this diamond pattern that I discovered. I checked in on SHOP and it too appears to have that diamond pattern. If this diamond pattern plays out, SHOP can drop down to $1300-$1250. I was skeptical, but then I hear news about increasing competition in the news. I'm interested in what you see.

SHOPTrade Idea: 9/10 1600C over 1560.
SHOP over 1600 can run another 50 points.
..........................................

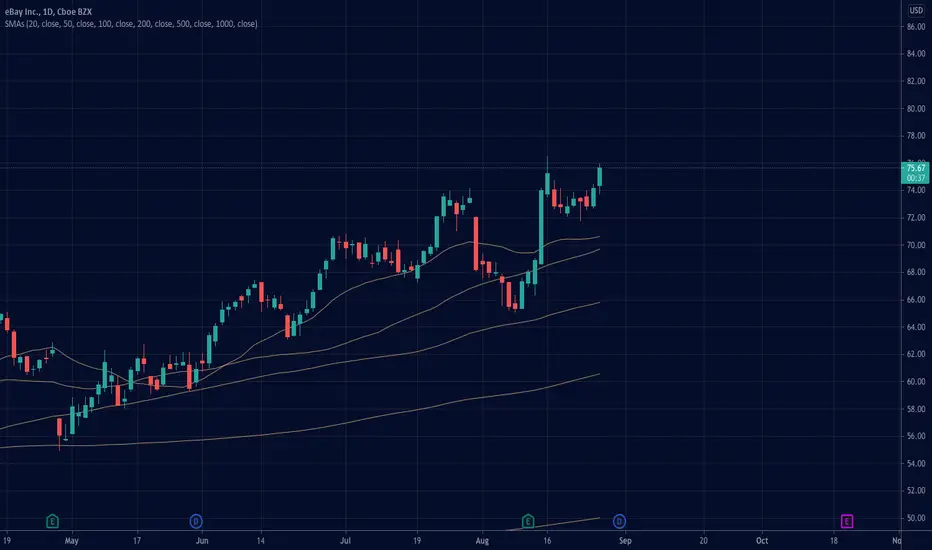
$EBAY: Tapering proof? With Jackson Hole this week looking to create rotation in certain names, I believe you may be able to look beyond it to mid caps like EBAY who have been showing a tremendous amount of relative strength recently against the broader indices and I wonder if there's a lot more left in the tank. After ETSY's earnings went off in a strong way, we'll see if names like this have even more life post-COVID
SHOPStrong close today. Shop over 1500 can run 35-50 points.
Trade Idea: 8/27 1550C over 1500.
BID/ASK: 3.80/4.40
