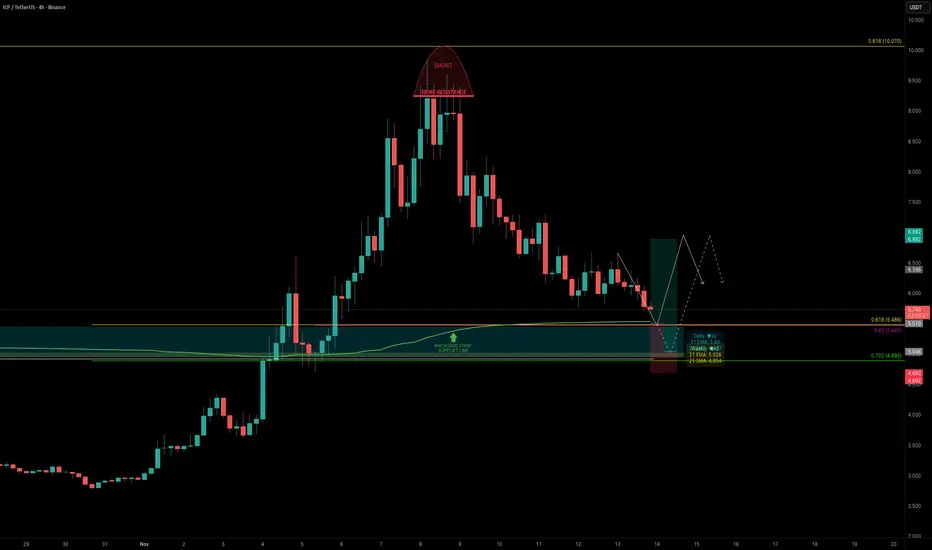
ICP — Identifying the Next High-Probability Long OpportunityICP had a great start to November, rallying over +250% in just 8 days before topping out just below the 0.618 Fibonacci retracement (~$10), right at the $3B MC resistance.
Over the past 5 days, ICP has retraced -42% from the high. The key question now: where is the next high-probability long opportunity?
Key Confluences around the $5.5 Zone
One level that stands out strongly is the $5.5 zone, where several major supports align:
0.618 Fib retracement of the entire +250% rally
0.85 Fib retracement of the smaller internal wave aligns right with the major 0.618 level
Anchored VWAP (280 day) clustering right around $5.5, adding volume-weighted support
Quarterly VWAP currently sits near $5.62
Daily 21 EMA at $5.45
Weekly 21 EMA/SMA both at around $5
$5.5 = $3B market cap
Point of Control (POC) of the past ~280 days sits around $4.9, marking it as the final major support layer below
🟢 Trade Setup Plan
Entry Zone: $5.6 – $5.0
Stop-Loss: Below POC
Targets:
TP1: $6.0
TP2: $6.9 (VWAP resistance / 0.382 Fib)
TP3: 0.618 FR
Risk/Reward: 1:2+, depending on entry precision
🔍 Indicators used
Multi Timeframe 8x MA Support Resistance Zones → to identify support and resistance zones such as the daily/weekly 21 EMA/SMA.
➡️ Available for free. You can find it on my profile under “Scripts” and apply it directly to your charts for extra confluence when planning your trades.
_________________________________
💬 If you found this helpful, drop a like and comment!
Sidec
SOL — From Panic to PrecisionLast week, we witnessed a sharp, market-wide crash, a chain reaction of liquidations that flushed out overleveraged long positions. While many altcoins saw 60–90% drawdowns, the majors held relatively firm.
Among them, SOL stood out as one of the most technically precise. Price perfectly tapped the 1.1 trend-based Fib extension, in confluence with the yearly level, the 21 monthly SMA and the 0.666 retracement, providing a high probability long setup.
After that bounce, SOL revisited the lows, approaching the yearly level near $170, which remains the key structural support for maintaining bullish momentum. The support zone between $175–$170 aligns with the 21 EMA/SMA on the monthly timeframe, which currently spans $158–$170 → forming a strong macro confluence cluster that’s critical to hold.
From there, price unfolded into a clean 5-wave impulsive structure, topping within a dense resistance zone between $208–$212, reinforced by:
mOpen at $208.68
21 EMA/SMA (Daily TF) between $211–$212
0.618 Fibonacci retracement at $211.43
This area offered the perfect low-risk short entry.
Currently, SOL appears to be forming an ABC corrective pattern, likely targeting a move back into the $190–$185 range to fill imbalances and complete wave C. As another key element, the yearly open at $189.31 sits mid-range between resistance and support → a critical pivot level. That’s the region I’ll be monitoring for long setups.
🔍 Indicators used
DriftLine — Pivot Open Zones → For identifying key yearly/monthly/weekly/daily opens that act as major S/R reference points
Multi Timeframe 8x MA Support Resistance Zones → to identify support and resistance zones such as the monthly 21 EMA/SMA.
➡️ Available for free. You can find it on my profile under “Scripts” and apply it directly to your charts for extra confluence when planning your trades.
_________________________________
💬 If you found this helpful, drop a like and comment!
