Review and plan for 7th Jaunary 2026Nifty future and banknifty future analysis and intraday plan.
sail- analysed.
This video is for information/education purpose only. you are 100% responsible for any actions you take by reading/viewing this post.
please consult your financial advisor before taking any action.
----Vinaykumar hiremath, CMT
Sideways

Plan for 6th January 2026Nifty future and banknifty future analysis and intraday plan.
This video is for information/education purpose only. you are 100% responsible for any actions you take by reading/viewing this post.
please consult your financial advisor before taking any action.
----Vinaykumar hiremath, CMT

Plan for 2nd January 2026Nifty future and banknifty future analysis and intraday plan.
This video is for information/education purpose only. you are 100% responsible for any actions you take by reading/viewing this post.
please consult your financial advisor before taking any action.
----Vinaykumar hiremath, CMT

The Calm Before the Break: EUR/USDEUR/USD on the 1H chart is trading in a well-defined range environment, with price currently around 1.1775 and repeatedly rotating between a support band near 1.1760–1.1765 and a resistance band near 1.1800–1.1810. The structure is not trending cleanly; instead, it is showing mean-reversion behavior—buyers step in aggressively on dips into support, while sellers defend the upper supply zone, producing the repeated “up-down” swings visible on the chart. Technically, this is reinforced by the moving averages compressing around price: the EMA 34 (~1.1775) and EMA 89 (~1.1773) are almost flat and overlapping, a classic signature of consolidation rather than directional expansion.
From a macro perspective, this type of tight range is typical when the market is waiting for clarity on rate expectations and yield differentials. EUR/USD tends to move higher when U.S. yields soften or the USD weakens, and it tends to stall or pull back when U.S. yields reprice upward or risk sentiment deteriorates. As long as traders are uncertain about the next policy steps from the Fed vs. ECB, price often remains trapped inside these liquidity bands, with both sides fading extremes rather than committing to trend continuation. The practical takeaway is simple: 1.1760–1.1765 is the “line in the sand” for bulls, while 1.1800–1.1810 is the ceiling that must break for upside expansion. A clean hold and rebound off support keeps the range rotation intact and opens the path back toward the top of the box; a decisive break and acceptance below support would invalidate the bullish rotation and shift focus to lower demand zones.

Review and plan for 30th December 2025 Nifty future and banknifty future analysis and intraday plan.
This video is for information/education purpose only. you are 100% responsible for any actions you take by reading/viewing this post.
please consult your financial advisor before taking any action.
----Vinaykumar hiremath, CMT

Review and plan for 26th December 2025 Nifty future and banknifty future analysis and intraday plan.
manappuram,Dalbharat- analysis.
This video is for information/education purpose only. you are 100% responsible for any actions you take by reading/viewing this post.
please consult your financial advisor before taking any action.
----Vinaykumar hiremath, CMT

Review and plan for 24th December 2025 Nifty future and banknifty future analysis and intraday plan.
stocks- shriramfin, nmdc.
This video is for information/education purpose only. you are 100% responsible for any actions you take by reading/viewing this post.
please consult your financial advisor before taking any action.
----Vinaykumar hiremath, CMT

Review and plan for 23rd December 2025 Nifty future and banknifty future analysis and intraday plan.
This video is for information/education purpose only. you are 100% responsible for any actions you take by reading/viewing this post.
please consult your financial advisor before taking any action.
----Vinaykumar hiremath, CMT

S&P 500 (H4) – A Breathing Pullback Within an UptrendHello everyone, Domic here.
Looking at the S&P 500 on the H4 timeframe, the dominant feeling right now is not a trend breakdown, but rather a market slowing down to catch its breath after a fairly solid advance.
The medium-term trend still leans bullish, as the EMA89 continues to slope upward and price remains within its zone of influence. Losing the EMA34 only signals that short-term buying momentum has weakened, with EMA34 now acting as dynamic resistance — a classic feature of a corrective phase within an uptrend.
The key level to watch is the EMA89. Price is currently rotating back to test this area with moderately sized bearish candles, without any aggressive breakdown. Volume also does not suggest strong distribution or panic selling. This behavior is typical of a technical pullback, not the start of a trend reversal.
The most fitting scenario at this stage is for the S&P 500 to continue moving sideways and consolidating around the EMA89, roughly within the 6,740–6,780 zone, allowing the remaining selling pressure to be absorbed. Only if we see a clear H4 close below the EMA89, followed by failed rebounds back above it, would a deeper correction come into play. For now, this remains a “rest after the run” within a medium-term uptrend.
Wishing you all a smooth and successful trading day!

Review and plan for 19th December 2025 Nifty future and banknifty future analysis and intraday plan.
Tcs-analysed.
This video is for information/education purpose only. you are 100% responsible for any actions you take by reading/viewing this post.
please consult your financial advisor before taking any action.
----Vinaykumar hiremath, CMT

Review and plan for 17th December 2025 Nifty future and banknifty future analysis and intraday plan.
This video is for information/education purpose only. you are 100% responsible for any actions you take by reading/viewing this post.
please consult your financial advisor before taking any action.
----Vinaykumar hiremath, CMT

Review and plan for 16th December 2025 Nifty future and banknifty future analysis and intraday plan.
This video is for information/education purpose only. you are 100% responsible for any actions you take by reading/viewing this post.
please consult your financial advisor before taking any action.
----Vinaykumar hiremath, CMT

Will the Sky clear for higher Goldprice? Week 8-12 DecContext: After a quiet week with little impact from economic data, Gold FX_IDC:XAUUSD has been moving sideways within a triangle structure. The US economy looks resilient—better than many expected—shifting all eyes to the FED rate cut decision this Wednesday. 🇺🇸👀
📅 Market Recap:
Mon Dec 1 (Asia Session): Price pumped +$60 up to $4264, only to dump -$101 back down to $4163, sweeping liquidity in the beginning of the US Session. 🧹
Consolidation: Since then, Gold has consolidated in a narrow range between $4190 and $4226. ↔️
Friday: US Inflation data was less dramatic than feared, but Gold still dropped around -$64, closing the week near $4191.
🔥 The Week Ahead:
We have key dates coming up, but with the Rate Cut Decision pending on Wednesday, data needs to be dramatic to force a major move before then.
Quiet/Choppy markets until Wednesday. 💤
The Exception: Tuesday, when US Job Data is released. 📊
🎯 The Trade Setup:
If the US Job Market remains stable, there is room for further downside. I am watching for a dip to sweep liquidity before looking for entries.
📉 Downside Targets (Buy Zones):
Primary Target: $4150 🥇
Secondary Target: $4110 🥈
There is strong support between this zones, so it is very possible the drop stops right at $4150 without reaching the second target.
🐂 Strategy: I see the market chopping sideways until the announcement. My plan is to look for LONG positions 🚀 if price sweeps into my targets ($4150 / $4110).
My last idea about was not longer valid because the right shoulder did not went down, but a Quasimodo pattern could be a thing... Maybee FED does skip the cut? Let's see...
-------------------------------------------------------------------------
This is just my personal market idea and not financial advice! 📢 Trading gold and other financial instruments carries risks – only invest what you can afford to lose. Always do your own analysis, use solid risk management, and trade responsibly.
Good luck and safe trading! 🚀📊

Bearish Divergence on Weekly TF.Bearish Divergence on Weekly TF.
Resistance lies around 225 - 235
Currently moving in a Rectangular Channel.
Crossing 222 - 223 will trigger more positivity
towards 235 - 240 initially and then around 250-260.

BTCUSD: Trend lost momentum, sideways within price blockBITSTAMP:BTCUSD Analysis – October 21, 2025
Overview
Yesterday, BITSTAMP:BTCUSD failed to sustain its bullish momentum and closed below the EMA, indicating that the uptrend has weakened and the market has potentially shifted back into a bearish phase.
Current structure (H4)
On the H4 timeframe, BITSTAMP:BTCUSD is moving sideways within a price block, reflecting an ongoing indecision between buyers and sellers.
At the moment, the market lacks a clear direction and is consolidating within a tight range, waiting for a breakout to define the next move.
In such a challenging and uncertain market environment, the best approach is to stay patient, wait for clear confirmation, and avoid forcing trades when price action is still unclear.
Above all, capital preservation and risk control should remain the top priority.
Trading plan
Bearish scenario:
If price consolidates with weak momentum below the EMA and near the lower boundary of the price block, we can consider short positions, following the downside momentum.
Bullish scenario:
If price moves back above the EMA, then forms a tight accumulation near the upper boundary of the price block while the EMA holds below price, this would signal that bulls are regaining control in that case, consider long positions.
Notes:
Avoid entering trades when price is still within the mid-range of the block.
Wait for clear price reactions around key boundaries.
Maintain strict risk management and limit exposure per trade.
Daniel Miller @ ZuperView

US30: Flash pump not enough to break resistanceSPREADEX:DJI Analysis – Weak flash pump signals a possible pullback ahead.
📊 Technical Overview
On the 30-minute timeframe, Wall Street (US30) has recently shown a quick rebound — a flash pump — after a strong flash dump earlier in the week. Price is now trading near the 46,400 – 46,500 area, right below the major resistance zone between 46,600 – 46,750 (highlighted in green).
Below, the support range around 46,050 – 46,200 (marked in red) remains the key demand area.
⚙️ Market Structure Insight
The recent flash pump recovered quickly from the previous drop, but the momentum appears insufficient to break through the prior flash dump zone. This imbalance often indicates a short-term exhaustion in buying pressure, meaning the market could need one more corrective leg before finding new strength.
🧭 Main Scenario
The most likely scenario is that price will move sideways or slightly pull back toward the 46,200 support zone before deciding its next major move.
• If buyers defend 46,200 successfully, the index could attempt another test of 46,700.
• However, failure to hold that support might open the door to a deeper correction.
💡 Personal View
The weak flash pump following the previous flash dump signals that the market is still in a consolidation and absorption phase. A short-term pullback could help reset momentum before a more sustainable trend emerges.
⛔ This analysis represents a personal technical perspective and should not be taken as investment advice. Always manage your risk before entering any position.
Please like and comment below to support our traders. Your reactions will motivate us to do more analysis in the future 🙏✨
Harry Andrew @ ZuperView

Plan for 9th October 2025- Quarterly results preparation!! Nifty future and banknifty future analysis and intraday plan.
This video is for information/education purpose only. you are 100% responsible for any actions you take by reading/viewing this post.
please consult your financial advisor before taking any action.
----Vinaykumar hiremath, CMT

BTCUSD: Sideways market plan🔁 Review of Yesterday’s Plan
Yesterday, we had two breakout trading plans for BITSTAMP:BTCUSD :
IRB (Inside Range Break)
Price moved exactly as projected.
Trade reached a profit of 2R – 2.5R, depending on individual target exits.
RB/ARB (Range Break / Advance Range Break)
Price reached the top boundary of the range and formed a bullish breakout candle,
but was immediately followed by a strong bearish candle pulling back into the range.
This was a clear False Breakout → No trade was taken, waiting instead for the next clear setup.
📈 Market Outlook for Today
BITSTAMP:BTCUSD has now moved back inside the larger range (125,710 – 122,383), showing that the market is currently sideways within a wide range.
The most recent candle closed below the EMA, indicating no clear signal for continuation trades yet.
🧭 Trading Plan for Today
Wait for a new compression setup to form before entering.
If price consolidates and compresses near the upper boundary of the range, prepare to Buy once confirmation appears.
If price continues to drop toward the lower boundary of the range, consider Sell setups, depending on how price reacts to support.
🎯 Summary:
BTC is currently in an accumulation (sideway) phase.
Be patient and wait for a valid breakout setup before taking action — avoid chasing the market and focus on trading only when momentum and confirmation align.
You can refer to my previous analysis here:
Please like and comment below to support our traders. Your reactions motivate us to do more analysis in the future 🙏✨
Daniel Miller @ ZuperView

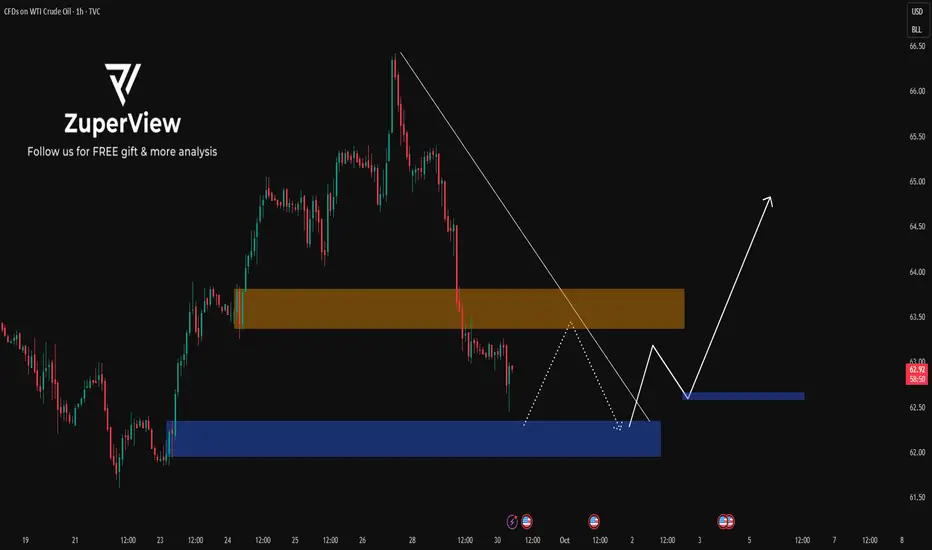
USOIL: Waiting for breakout after sidewaysTo better understand my current outlook on USOIL, please refer to my previous higher-timeframe and fundamental analyses.
* Trend: assessed using at least three trend indicators, with market structure as the primary guide.
** Weak or Reversal Signals: Assessed based on one of our criteria for trend reversal signals.
*** Support/Resistance: Selected from multiple factors – static (Swing High, Swing Low, etc.), dynamic (EMA, MA, etc.), psychological (Fibonacci, RSI, etc.) – and determined based on the trader’s discretion.
**** Our advice takes into account all factors, including both fundamental and technical analysis. It is not intended as a profit target. We hope it can serve as a reference to help you trade more effectively. This advice is for informational purposes only and we assume no responsibility for any trading results based on it.
Please like and comment below to support our traders. Your reactions will motivate us to do more analysis in the future 🙏✨
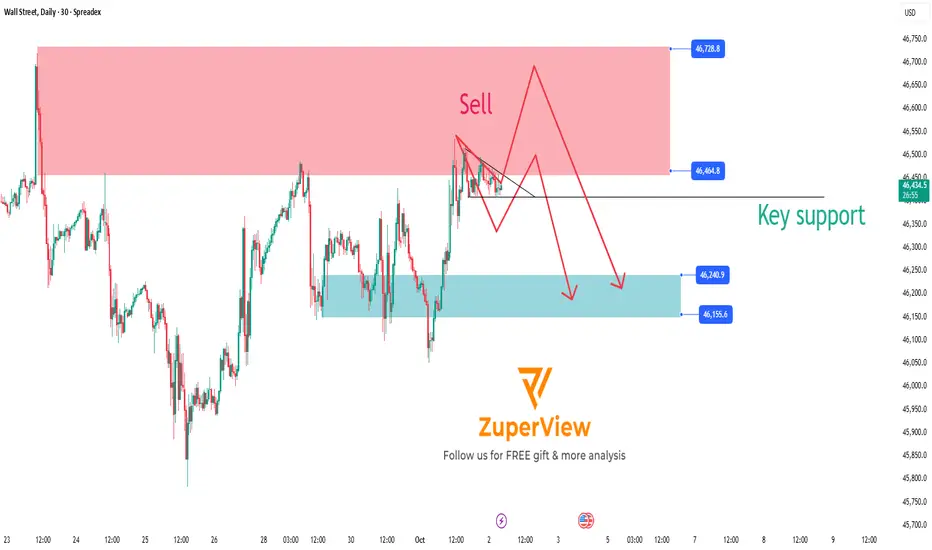
US30: Key support breakdown signals potential sell opportunity
1. Current Market Overview 🌐
The SPREADEX:DJI index is approaching a significant resistance zone where selling pressure is expected to be strong. The price is currently consolidating and moving sideways around this area, preparing for a major move.
2. Technical Signals and Momentum Indicators 📊
Momentum indicators such as MFI, RSI, and Stochastic have all entered the oversold territory, while also showing signs of price compression (consolidation), indicating the market is waiting for the next breakout.
The strong resistance zone and the Overbought/Overextended (OB/OS) signals suggest that buying pressure is weakening, which is favorable for sellers.
3. Sell Scenario on Key Support Breakdown 🔻
If the price breaks below the important Key Support level shown on the chart, this will confirm the beginning of a downtrend.
Traders can consider opening sell positions as soon as the breakout occurs to take advantage of the downward momentum.
The price target is expected to move toward lower support zones where buying interest may emerge to cause a price correction.
4. Risk Management ⚠️
Place stop-loss orders above the resistance zone or the nearest recent highs to protect against unexpected market moves.
Adjust your position size according to your risk tolerance.
5. Conclusion 🔑
The sell setup on US30 is very clear with a strong resistance zone and momentum signals indicating a potential upcoming downtrend.
Main scenario: Breaking the Key Support will trigger a strong decline, providing a profitable trading opportunity for sellers.
Wait for a confirmed support break before entering the trade to ensure safety and effectiveness.
Please like and comment below to support our traders. Your reactions will motivate us to do more analysis in the future 🙏✨
Harry Andrew @ ZuperView
PLAN DAY 26-SEP-25Related Information:!!!
Strong data point to the resilience of the economy despite headwinds from U.S. President Donald Trump’s trade tariffs. In fact, on Thursday, Trump announced a 100% tariff on imported branded or patented pharmaceutical products, a 25% tariff on all imported heavy-duty trucks, and a 50% tariff on kitchen cabinets, effective October 1.
Personal opinion:!!!
Gold price hit an all-time high (ATH) 3784 and then moved sideways 3778-3750.
Support zone point: 3750ted Information:!!!
Strong data point to the resilience of the economy despite headwinds from U.S. President Donald Trump’s trade tariffs. In fact, on Thursday, Trump announced a 100% tariff on imported branded or patented pharmaceutical products, a 25% tariff on all imported heavy-duty trucks, and a 50% tariff on kitchen cabinets, effective October 1.
Personal opinion:!!!
Gold price hit an all-time high (ATH) 3784 and then moved sideways 3778-3750.
Support zone point: 3750, 3740 zone

Review and plan for 25th September 2025Nifty future and banknifty future analysis and intraday plan.
This video is for information/education purpose only. you are 100% responsible for any actions you take by reading/viewing this post.
please consult your financial advisor before taking any action.
----Vinaykumar hiremath, CMT

Review and plan for 10 September 2025Nifty future and banknifty future analysis and intraday plan.
This video is for information/education purpose only. you are 100% responsible for any actions you take by reading/viewing this post.
please consult your financial advisor before taking any action.
----Vinaykumar hiremath, CMT
