SIEMENS – STWP Equity Snapshot📊 SIEMENS – STWP Equity Snapshot
Ticker: NSE: SIEMENS
Sector: ⚙️ Industrial / Capital Goods
CMP: 2,980.80 ▲ (+3.00% | 29 Jan 2026)
Learning Rating: ⭐⭐⭐⭐☆ (Neutral → Early Reversal Bias)
Chart Pattern Observed: 📐 Falling Wedge (Developing)
Candlestick Pattern Observed: Demand-led rebound from lower boundary
📊 Technical Snapshot
SIEMENS is currently forming a falling wedge structure, characterised by lower highs and lower lows converging toward a narrowing range. This structure typically reflects selling pressure losing momentum rather than aggressive distribution. Price has recently responded positively from the lower boundary of the wedge, indicating active demand absorption near support. Momentum indicators are stabilising from neutral-to-weak zones, suggesting that downside momentum is slowing rather than expanding. While price still trades below the upper supply trendline, the compression within the wedge signals a potential volatility expansion phase ahead. Directional confirmation, however, will require acceptance above the wedge resistance, failing which the structure may continue to oscillate within the range.
📊 Volume Analysis
🔹 Current Volume: ~249K
🔹 Average Volume (20-period): ~295K
⚖️ Volume remains slightly below average, consistent with compression phases inside wedge formations.
💡 Interpretation: Falling wedges often mature under declining volume. A volume expansion near the upper boundary would be required to validate any structural resolution. Until then, participation remains selective rather than aggressive.
🔑 Key Levels – Daily Timeframe
Support Areas: 2915 | 2850 | 2813
Resistance Areas: 3017 | 3054 | 3119
These are zones where price has paused or reacted earlier.
What’s Catching Our Eye: Price compression within a falling wedge with demand response at the lower trendline.
What to Watch For: Acceptance above the wedge resistance with volume expansion.
Failure Zone: Sustained trade below the lower wedge boundary.
Risks to Watch: Lack of follow-through volume near resistance.
What to Expect Next: Range-to-breakout resolution as compression matures.
Bullish Case: Wedge breakout with participation may shift structure toward recovery.
Bearish Case: Rejection at upper trendline keeps price range-bound or corrective.
Momentum Case: Early rebound momentum, awaiting confirmation.
📌 Price Reference Framework – Educational View
🔹 Intraday Reference (Short-Term Observation)
Observation Zone: 2,980
Risk Invalidation Area: Below 2,915
Upside Reference Zones: 3,017 → 3,054
Used only to observe short-term price behaviour and participation.
🔹 Swing Reference (Positional | 2–5 Sessions)
Observation Zone: 2,980
Risk Invalidation Area: Below 2,850
Upside Reference Zones: 3,119 → 3,250 (structure-based extension)
Relevant only if price sustains above the wedge structure with acceptance.
🧠 Important Note:
These levels are reference zones derived from structure and past reactions, shared purely for educational interpretation. They are not buy/sell recommendations.
STWP View:
Momentum: Improving | Trend: Neutral | Risk: Moderate | Volume: Normal
Learning Note:
Patterns reveal market behaviour, not outcomes. Confirmation always comes from structure + acceptance + volume, never prediction.
Disclaimer:
This post is for educational and informational purposes only. It is not investment advice or a recommendation. Please consult a SEBI-registered financial advisor before making any trading or investment decisions. STWP is not responsible for actions taken based on this analysis.
💬 Did this help you read the chart better?
🔼 Boost | ✍️ Comment | 🔁 Share with a learner
👉 Follow STWP for clean, structure-based chart reading
🚀 Stay Calm. Stay Clean. Trade With Patience.
SIEMENS

Siemens AG (1D) – Full Technical Analysis + Fundamental Analysis🔍 1. Price Action & Trend Structure
✔️ Strong long-term uptrend inside a rising channel
Siemens has been moving within a well-defined ascending channel for several years.
The price consistently respects both the upper resistance line and the lower support line of this channel.
Every pullback to the bottom of the channel has historically led to a new bullish wave.
✔️ Price currently near the upper-mid region of the channel
This suggests:
The trend is still healthy and bullish
But the stock is not at an ideal low-risk buy zone
Strongest buy opportunities typically occur near the channel’s lower boundary
✔️ Key support zone: ~138 €
This level, marked on the chart, acted as:
Major support during corrections
A psychological price floor
If the stock ever returns to this zone, it would be considered a high-value demand area.
🔍 2. MACD + RSI Combined Indicator
✔️ MACD is recovering from a recent bearish phase
The histogram is transitioning from negative toward zero → decreasing selling pressure
MACD and Signal lines are preparing for a possible bullish crossover
This usually indicates early momentum shift toward buyers
⚠️ However:
The momentum is not strongly bullish yet.
The MACD must cross above the Signal line with histogram turning positive for a confirmed buy signal.
➡️ We are currently in a transition phase, not a confirmed uptrend continuation.
🔍 3. Stochastic RSI (Stoch RSI)
✔️ Stoch RSI is near overbought levels (above 90)
This indicates:
A strong recent upward bounce
Potential for short-term pullback or consolidation
However, in strong long-term trends (like Siemens), Stoch RSI can stay overbought for extended periods without triggering a reversal.
✔️ Overall message from Stoch RSI:
Momentum is strong short term, but buying at this level carries increased risk of near-term correction.
🔍 4. Key Observations from RSI Strategy Buy/Sell Signals
The chart shows multiple automated RSI-based Buy (LE) and Sell (SE) signals.
Pattern:
Buy signals occur near channel support → extremely profitable historically
Sell signals occur near channel resistance → reliable for trimming or exiting
Right now:
Price is closer to the upper-middle zone, not near support
Therefore, no strong Buy signal is present
🔥 5. Bullish & Bearish Scenarios
Bullish Scenario (Primary Trend)
If price continues respecting the channel:
Next target: 240–250 € range
Break above 250 € → continuation toward 270–280 €, the projected top of the channel
This aligns with the stock’s strong long-term bullish structure.
Bearish Scenario (Less likely but important)
If momentum weakens and price breaks below the mid-channel line:
First support: 210 €
Major support: 138 € zone (historically very strong)
A break below 138 € would invalidate the rising channel, but this has a low probability given historical behavior.
⭐ Final Summary
Siemens remains in a strong multi-year uptrend inside a clean ascending channel.
MACD shows early signs of bullish momentum returning, but not confirmed yet.
Stoch RSI is overbought, signaling the possibility of a short-term pullback.
Price is not at the channel bottom, meaning risk is higher for new entries at current levels.
📌 Best buying opportunities historically occur at the channel’s lower boundary.
We are currently in the mid-to-upper area, which is not optimal for low-risk entry.
If you want, I can also provide:
✔ Entry/exit points
✔ Risk management plan
✔ Weekly & monthly timeframe confirmation
----------------------------------------------------------
Fundamental Analysis
🧾 1. Business & Structural Drivers
Siemens AG is a diversified industrial and technology group, with core businesses in:
Digital Industries (automation, industrial software)
Smart Infrastructure (building technologies, power distribution)
Mobility (rail and transportation solutions)
Management highlights electrification, transportation and industrial software as the main long-term growth drivers, with continued strong demand in these areas even while the automation environment has been more challenging.
Siemens
The company is also pushing its “ONE Tech Company” strategy – integrating hardware, software and services to lock in customers and grow recurring revenues.
Siemens
+1
📈 2. Recent Financial Performance
FY 2024 (year ended 30 Sept 2024)
Revenue: €75.9 billion, +3% year-on-year.
Net income: €9.0 billion – a record high at that time.
Free cash flow: €9.5 billion, described by management as “excellent”.
Siemens
+2
Siemens Press
+2
Demand remained strong in electrification, transport and industrial software, helping offset a tougher cycle in automation.
Siemens
FY 2025 (latest full year)
For fiscal 2025 (ended Sept 2025), Siemens extended this growth trend:
Q1 2025: revenue €18.4 bn (+3%); book-to-bill 1.09.
Siemens Press
Q2 2025: revenue €19.8 bn (+7%); orders up 10% to €21.6 bn; book-to-bill 1.10.
Siemens Press
Q4 2025: revenue €21.4 bn (+6% comparable); book-to-bill 1.02.
Siemens Press
+1
For the full fiscal 2025 year:
Net income: ~€10.4 billion, another all-time high (third year in a row).
EPS pre PPA: €12.95; excluding one-off gains, EPS pre PPA was ~€10.71 – in line with guidance (€10.40–11.00).
Siemens Press
+1
There was an earnings miss versus analyst expectations in Q4 2025 (EPS and revenue came in slightly below forecasts, which caused a short-term share price drop), but underlying growth remained solid.
Investing.com
Outlook
For fiscal 2026, Siemens guides for:
Comparable revenue growth: 6–8%
Book-to-bill: >1
EPS pre PPA: €10.40–11.00 (excluding special items).
Siemens
This shows management still expects profitable growth despite macro uncertainty and FX headwinds.
💰 3. Balance Sheet, Cash & Dividend
Free cash flow: around €9.5 bn in FY 2024 (and similarly strong in 2025), giving the company a lot of flexibility for dividends, buybacks and investment.
Siemens Press
+1
Net debt: Total net debt around €34.8 bn, but industrial net debt only about €7.9 bn, down ~27% vs 2022, with a solid liquidity position.
Creditreform Rating
Dividend: Proposed/paid dividend of €5.20 per share, with a yield roughly in the 2–3% range and a payout ratio around 40–45%.
Siemens Press
+2
Siemens
+2
Rating agencies and independent analysts generally view Siemens’ balance sheet as strong and conservative, which supports continued investment and shareholder returns.
Siemens
+1
📊 4. Valuation
Recent data show:
Trailing P/E: around 23–24x earnings.
Wisesheets
Forward estimates (2026–2027) imply a P/E in the low-20s and a dividend yield around 2.4–2.6%.
MarketScreener
Profit margin around 12% and decent returns on equity and invested capital compared with peers.
Yahoo Finance
+1
So the stock is not cheap, but for a high-quality, diversified industrial with strong cash generation and structural growth themes, the valuation is in a reasonable premium range rather than “bubble” territory.
⚙️ 5. Key Fundamental Positives
Structural tailwinds in electrification, grid upgrades, automation, digitalization and rail transport.
Siemens
+1
Consistent revenue and order growth with book-to-bill >1, showing a healthy pipeline.
Siemens Press
+2
Siemens Press
+2
Excellent free cash flow and disciplined capital allocation (dividends, buybacks, targeted acquisitions).
Siemens Press
+1
Strong balance sheet with manageable industrial net debt and solid credit ratings.
Creditreform Rating
+1
⚠️ 6. Main Risks & Caveats
Cyclical exposure: Parts of the business (especially automation) are sensitive to global industrial cycles and capex spending.
Siemens
Execution & portfolio risk: Strategy depends on integrating software, services and hardware; missteps in large projects (Mobility, infrastructure) or M&A could pressure margins.
FX and macro headwinds: Management already cites currency effects as a drag on EPS for 2026.
Siemens
Valuation risk: With a P/E in the 20s, any disappointment (like the recent Q4 2025 earnings miss) can trigger sharp short-term drawdowns.
Investing.com
+1
🧩 7. How This Fits Your Technical View
Technical picture: clear long-term uptrend in a rising channel, but currently not at the lower boundary (not a “deep value” technical entry).
Fundamentals: confirm Siemens as a high-quality, cash-generative company with solid growth guidance and a shareholder-friendly capital allocation policy.
So from a combined technical + fundamental perspective:
Long-term investors might see Siemens as a strong compounder but may prefer to buy on pullbacks toward the lower part of the channel to improve risk/reward.
Short- to medium-term traders should still respect the overbought readings and channel resistance, even though the underlying business is fundamentally strong.
⚠️ Disclaimer (as you requested)
This fundamental and technical analysis reflects only my personal view based on publicly available information. I take no responsibility for any of your buy or sell decisions.

Review and plan for 11th December 2025Nifty future and banknifty future analysis and intraday plan.
siemens, kaynes.
This video is for information/education purpose only. you are 100% responsible for any actions you take by reading/viewing this post.
please consult your financial advisor before taking any action.
----Vinaykumar hiremath, CMT

Siemens (SIE) Rally in Full Swing | Supercycle Target Above 700+⚡️ Siemens – Supercycle Wave 3 Heating Up! 🌊
Siemens (SIE) is mid-flight in Wave (3) of the Supercycle Wave 5 — the most explosive leg of the macro move.
Momentum still looks 🔥 with upside potential toward the 3.618 Fib extension around 330 , where Wave 3 could complete before a healthy Wave 4 dip.
Smart money’s been quietly reloading through each consolidation 🧠 — structure stays bullish, trend intact, and sentiment still building.
Wave 4 = opportunity. Wave 5 = potential breakout zone 🚀
Is smart money really in? Drop your analysis below!
#Siemens #SIE #ElliottWave #SmartMoneyConcepts #FibonacciTrading #PriceAction #TechnicalAnalysis #WaveTheory #Investing #TradingView #BullMarket #GermanStocks #MarketCycle #TrendTrading

Review and plan for 16th September 2025Nifty future and banknifty future analysis and intraday plan.
Stock analysis.
This video is for information/education purpose only. you are 100% responsible for any actions you take by reading/viewing this post.
please consult your financial advisor before taking any action.
----Vinaykumar hiremath, CMT

Equity Trade Setup – Siemens Ltd. (NSE: SIEMENS)Trade Type: Breakout + Channel Trend Continuation
🔹 Trade Details
Buy Zone (Entry): ₹2,982.00 – ₹2,987.00
Current LTP: ₹2,970.00
Stoploss (SL): ₹2,887.00 (below recent swing support)
Target (T1): ₹3,150.00
Target %: ~5.46%
Timeframe: 3–5 trading days
R:R Ratio: ~2:1
Confidence: Moderate to High (subject to intraday volume confirmation)
For Education Purposes Only

Short, target 184.9Following Siemens in daily chart.
I am mostly bearish in German stocks. For Siemens, I got a weekly short call o Monday and today a short call again in daily chart.
TP1 188.6
TP2 186.2
TP3 184.9 - my main target.
You can stop above 195 daily candle close.

Siemens India Ltd *Siemens India Ltd*
P&F; Formation on Weekly Basis.
Price BreakOut Needed & Sustained. To be Watched. Then Good to go.
Strong Vol Consolidation & Continued Traction.
RSI: 1H>D


VOLTAMP 5k to 7k 🚀 Buy Recommended - Rachit Sethia 💚💙VOLTAMP 4988
TGT 7000+
SL4100
Return 40%+
RR >2.35
Timeframe <6 Months
NSE:VOLTAMP
Recommended buy.
Can hold for longer term.
Shared with 💚
By Rachit Sethia

Short SiemensThere is M pattern breakdown in Siemens on daily chart. Expecting a downward trend in Siemens.

SIEMENSNSE:SIEMENS
One Can Enter Now ! Or Wait for Retest of the Trendline (BO) Or wait For better R:R ratio
Note :
1.One Can Go long with a Strict SL below the Trendline or Swing Low of Daily Candle.
2. Close, should be good and Clean.
3. R:R ratio should be 1 :2 minimum
4. Plan as per your RISK appetite
Disclaimer : You are responsible for your Profits and loss, Shared for Educational purpose

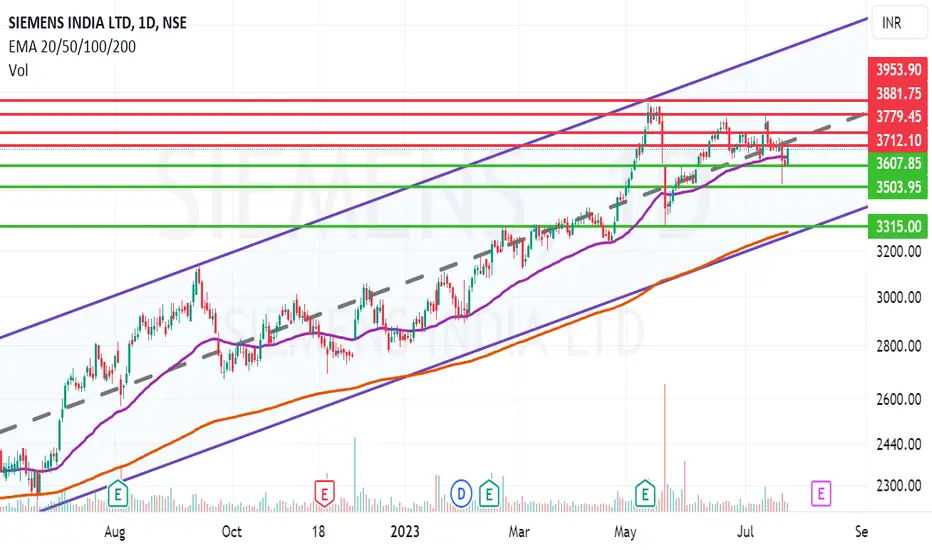
Siemens trying to break the mid channel resistanceSiemens Ltd. is a technology company focused on industry, infrastructure, digital transformation, transport as well as transmission and generation of electrical power. Siemens has signed a 3 billion euro ($3.25 billion) contract to supply and service freight trains in India.
Siemens CMP is 3694.90. Negative aspects of the company are high valuation (P.E. = 69.7), declining cash from operations annual, MFs are decreasing stake. Positive aspects of the company are improving annual net profits, no debt, FIIs are increasing stake and zero promoter pledge.
Entry after closing above 3713. Target of the call will be 3779 and 3881. Long term targets in the stock will be 3953. Stop loss in the stock should be maintained at closing below 3315.
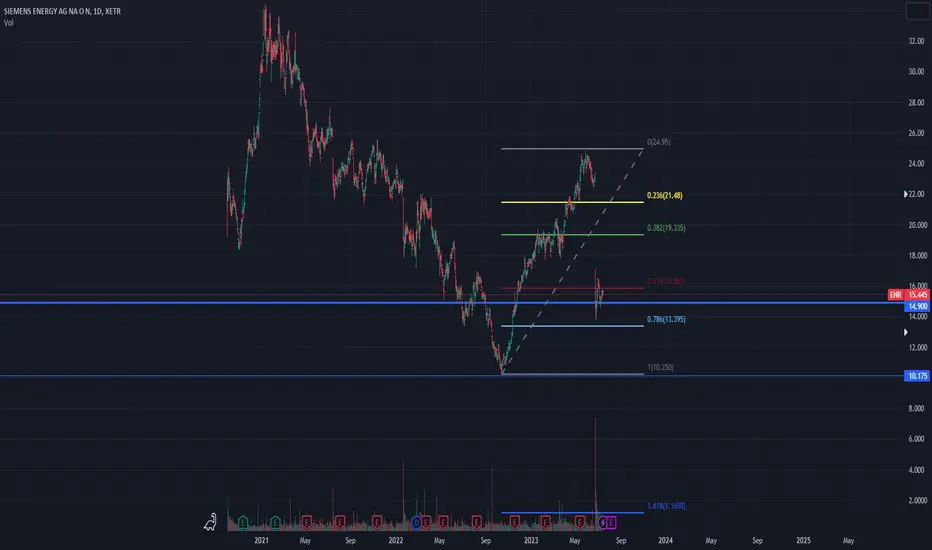
If looking for an opportunity, this could be. Just look.I believe this will close up the gap and continue the upward trend. Siemens Energy will fix the problems and the price gap will be closed in the following weeks.
SIEMENSNSE:SIEMENS
One can Enter Now or WAIT for Proper BO of the pattern !
Note :
1.One Can Go long with a Strict SL below the Trendline or Swing Low of Daily Candle.
2. Close, should be good and Clean.
3. R:R ratio should be 1 :2 minimum
4. Plan as per your RISK appetite
Disclaimer : You are responsible for your Profits and loss, Shared for Educational purpose!

SIEMENS: All set for next leg of Journey!Siemens ready to breakout from the Top of a Long Term Channel - Buyers are very aggressively pushing the prices up.
"Three Soldiers" pattern in Weekly chart from previous base.
PS: Results due today.
Holding it at from 3000 levels when the stock came out from a pretty good base.
New positions to be taken after consolidation and a break out above the channel.
PS: Think about R:R before any entry is taken.

Siemens is about to reverseSiemens take a trend of angle greater than 80 degree in 1H Time Frame,
And it is about to reverse or retrace to atleast 50% from high
Daily candle RSI- divergence found

Trendline Breakout in Siemens Limited...Chart is self explanatory.
Disclaimer: This is for demonstration and educational purpose only. This is not buying or selling recommendations. I am not SEBI registered. Please consult your financial advisor before taking any trade.

Siemens Breaking Out. Can Show Good MomentumSiemsns Broke out today. Trading at all time high. Company declared solid results

SiemensSiemens- It has formed Butterfly Pattern. we could see it can move upwards 3090 to 3150 Range. After reaching the target it will start to fall.
Disc- Please do your own research and this is only for learning purpose & not trading recommendation

Triangle PatternSiemens has broken the triangle pattern, good buy around marked demand area on retest with below level as stop loss for the given target.
lets see..

SIEMENSNSE:SIEMENS
One Can Enter Now ! Or Wait for Retest of the Trendline (BO).
Note :
1.One Can Go long with a Strict SL below the Trendline or Swing Low of Daily Candle.
2. Close, should be good and Clean.
3. R:R ratio should be 1 :2 minimum
4. Plan as per your RISK appetite
Disclaimer : You are responsible for your Profits and loss, Shared for Educational purpose!
