Bitcoin: Range Mode After Rejection — Break Levels MatterLadies and gentlemen, After reacting to 94,330.16, Bitcoin got hit with a strong rejection and dropped about 3% (down to pivot point level 4). I'm expecting a range in these areas until tomorrow. 🧙♂️
📈If a range forms, we can open pre-breakout longs on breaking its ceiling. If you want to play it safe for longs, wait for a break of resistance 94,330.16 —there's a ton of liquidity in this zone, and its break would be massive. That's probably why I say it's better to have pre-breakout positions.
📉For shorts, we need to see lower highs on the 4H timeframe—nothing there right now.
Capital management—don't ever forget it, and stay miles away from FOMO.
By the way, I’m Skeptic, founder of Skeptic Lab.
I focus on long-term performance through psychology, data-driven thinking, and tested processes.
Thanks for riding this idea—if it delivered value, hit that boost to keep the momentum rolling and follow to build the squad. Toss any symbol you want dissected in the comments, I'll handle it. 🩵
Now get outta here.
Skeptic

EURCHF: Clean Bearish Channel — Short Below SupportLadies and gentlemen, EURCHF on the 4H timeframe is moving inside a solid downward channel—nailing strong reactions off both the ceiling and floor, with a perfect angle to boot. 🧙♂️
After that hard rejection from the channel top, we've now dropped to the midline and support at 0.92775. A clean break below 0.92775? That's a killer short trigger, likely escorting us straight to the channel floor.
Right now, no long trigger in sight—structure's too tough for longs to make sense.
Capital management—don't ever forget it, and stay miles away from FOMO.
By the way, I’m Skeptic , founder of Skeptic Lab.
I focus on long-term performance through psychology, data-driven thinking, and tested processes.
Thanks for riding this idea—if it delivered value, hit that boost to keep the momentum rolling and follow to build the squad. Toss any symbol you want dissected in the comments, I'll handle it. 🩵
Now get outta here.

EURUSD: Volatility Is Back — Key Breaks to WatchLadies and gentlemen, EURUSD is in full-blown volatility mode right now—HWC and LWC are ranging, so whatever the LWC does, that's what we respect and trade off. 🧙♂️
In the 1H timeframe, after that first bearish leg and the correction that followed, we're primed for the next impulsive drop. Break of 1.17011? That's our short trigger all day.
Personally, if this candle closes like it's shaping up, I'm jumping in short right here. Why? 7 SMA is sitting below the candle, sellers are dominating hard, buyers are basically ghosts, and we're clearly in the second bearish leg. Plus, it hands me a sweet stop loss spot—if volatility rejects and we bounce past 1.17011, I can still hold a position.
If we get rejected and flip upside instead, break of 1.17385 could trigger a long—but that's riskier territory.
For the short we triggered, scale out with partial profits. For any long, resistances at 1.17786 and 1.18026 in order make solid take-profit zones.
Capital management—don't ever forget it, and stay far away from FOMO.
By the way, I’m Skeptic , founder of Skeptic Lab.
I focus on long-term performance through psychology, data-driven thinking, and tested processes.
Thanks for riding this idea—if it delivered value, hit that boost to keep the momentum rolling and follow to build the squad. Toss any symbol you want dissected in the comments, I'll handle it. 🩵
Now get outta here.

GBPJPY: One of the Cleanest 1H Setups Right NowLadies and gentlemen, GBPJPY is serving up one of the cleanest structures on the 1H timeframe—trust me, you don't want to miss this one. 🧙♂️
After three solid reactions off resistance at 211.382 and finally punching through to the upside, the daily HWC uptrend is officially reactivated. This thing's primed for some serious continuation growth.
The question is: Where's the trigger right now?
We've got a few scenarios:
Jump in on one of these reactionary candles hitting the level—ideally with a long lower shadow, strong body, showing buyers dominating and sellers basically absent. That's your sign momentum is swinging back hard.
Wait for a clean candle close above indecision—no mess, just conviction.
Break of resistance 212.013 (the one we pulled back from)—that's the confirmation play.
Quick tip: Best to wait for the 7 SMA to slip under the candles for clear buyer momentum, plus it hands you a logical stop loss spot (we don't have a great one right now otherwise).
Capital management—never forget it.
By the way, I’m Skeptic , founder of Skeptic Lab.
I focus on long-term performance through psychology, data-driven thinking, and tested processes.
Thanks for riding this idea—if it delivered value, hit that boost to keep the momentum rolling and follow to build the squad. Toss any symbol you want dissected in the comments, I'll handle it. 🩵
Now get outta here.

WTI: Politics Just Entered the ChartLadies and gentlemen, if you're trading oil (WTI) right now, you're probably in one of the most sensitive periods of your trading life. Why? Trump just arrested Venezuela's leader a few days ago :) Odds of a strike on Iran are sky-high, Israel could jump in too + a ton of other factors that could spike massive volatility in the oil market over the next few weeks and make trading it brutal.
Let's break it down together.
Daily timeframe
We've got a super strong downward channel for ages, with most action hugging the upper side and midline—barely touching the channel floor in forever. Today's candle is straight-up engulfing the last three weak bearish ones to the upside, and with all the tension building, expect a sharp uptrend move soon.
Drop to 4H for real long/short triggers.
Short side: Killer trigger on break of support 56.463—it's held with strong reactions before. If it snaps, look for midline retest first, then channel floor test.
Long side: Riskier trigger at 58.731 break—could kick off the upside correction of this bearish channel. But since it'd be the first uptrend leg, keep risk low.
By the way, I’m Skeptic , founder of Skeptic Lab.
I focus on long-term performance through psychology, data-driven thinking, and tested processes.
Thanks for riding this idea—if it delivered value, hit that boost to keep the momentum rolling and follow to build the squad. Toss any symbol you want dissected in the comments, I'll handle it. 🩵
Now get outta here.

DXY at a Key Decision ZoneLadies and gentlemen, let's kick off the first analysis of 2026 with DXY —the index that's got potential for both long and short plays, depending on where it snaps. 🔥
Start with the daily timeframe
As you can see, we're grinding through a massive consolidation . Right now, we're parked dead on the midline. A decisive break of the ceiling ( 100.340 ) or floor ( 96.455 ) could activate the major weekly trend continuation. These levels also make killer profit-taking spots.
Given today's candle building a long lower shadow + the bearish MWC behind it, I'm leaning heavier toward our short triggers failing (meaning downside follow-through). Seller strength is dominant, buyers who burned months defending 98.870 got wrecked—price can easily slide lower now.
Now drop to 4H
Break of resistance = long trigger. Break of support 98.147 = our short trigger.
Long targets: First 99.309, then the daily box ceiling I mentioned.
For shorts (my preference), I'd scale out with partials rather than full close at once—lets us ride the daily MWC bearish continuation while stacking higher R/R.
No rush opening fresh positions—the yearly candle just closed, liquidity hasn't flooded in yet. We've got plenty of time, so skip the FOMO and never forget capital management.
By the way, I’m Skeptic , f ounder of Skeptic Lab.
I focus on long-term performance through psychology, data-driven thinking, and tested processes.
Thanks for riding this idea—if it delivered value, hit that boost to keep the momentum rolling and follow to build the squad. Toss any symbol you want dissected in the comments, I'll handle it. 🩵
Now get outta here.

How High Risk-to-Reward Trades Are Actually BuiltIf you want to understand how I achieve risk-to-reward ratios of 5, 10, or higher — something you’ve probably seen in many of my analyses — stay with me until the end. 🍵
I’ll explain this step by step, directly, and without unnecessary complexity.
Step 1: Fix Your Expectations First 🔧🧠
Before anything else, your expectations must be corrected.
If you expect to trade with an average R:R of 5 and maintain an 80% win rate, you should stop reading right now. That mindset is fundamentally flawed.
Profitability does not require a high win rate. ❌
For example:
With an R:R of 2, a win rate of around 40% can already be profitable.
With an R:R of 5, profitability requires only about a 20% win rate.
That means out of 100 trades, you only need 20 winners — and you must be mentally prepared for 80 stop losses.
This brings us to a concept that is rarely discussed properly: losing streaks. 📉
A losing streak means taking multiple stop losses in a row during a trading period With a 40% win rate (R:R 2), a losing streak of 4 trades is statistically normal.
With a 20% win rate (R:R 5), losing streaks of 9 trades are expected.
If your numbers are significantly different from this, your journal needs review — not your strategy.
Once expectations are realistic, we can move forward.
Step 2: The Art of the Range 🎨
Personally, I love ranges :)
Why?
Because ranges accumulate liquidity — and liquidity eventually fuels strong, impulsive moves.
Do we trade inside the range?
Absolutely not.
You don’t want to become liquidity for others.
We trade the break — either the top or the bottom of the range.
Is it that simple? No.
Let’s walk through a real example.
On December 9, in my XAGUSD analysis on the 1H timeframe, price entered a range after a clear impulsive leg up.
Both HWC and MWC structures remained bullish, with higher lows forming inside the range.
Momentum favored buyers.
Candles were stronger on the upside.
Even fundamentals supported silver.
In this case, I waited for a break of the range high, not the low — because all parameters aligned with continuation.
When the breakout candle appeared, the position was opened.
At this point, execution paths may differ:
Some place stops below the previous range low.
Others place them behind the breakout candle.
In my case, I placed the stop below the lower wick of the breakout candle.
Why?
Because seller presence was visible, yet buyers absorbed it aggressively.
The liquidity below that wick made it statistically difficult for price to return there.
This is where trade quality increases — and high R:R becomes possible.
Step 3: Where the Real Edge Is Built 🧙♂️
This is where most traders struggle: when to exit.
I almost always use partial profit-taking — especially when HWC, MWC, and even LWC structures remain bullish.
Closing too early is a mistake.
Instead:
Close 35% at R:R 2 → the trade becomes risk-free.
Close 40% at R:R 5 → another R:R 2 is secured.
Close 20% at R:R 10 → yet another layer of edge.
Beyond R:R 10, exits depend on:
Momentum weakness
Candle rejection
Structural changes based on Dow Theory
At that point, experience and market reading matter more than rules.
(Reviewing your Personal Trading journal after 100 trades or more, helps you clearly understand how to read the market better.)
If you have questions, leave them in the comments — I’ll respond.
By the way, I’m Skeptic , founder of Skeptic Lab.
I focus on long-term performance through psychology, data-driven thinking, and tested processes.
If this was useful, feel free to support it. 🩵
More education continues tomorrow.
Peace out.
— Skeptic

Where You Trade Matters More Than You ThinkWhere do you trade?
At a café?
At university?
Between tasks at work?
Or inside your own office?
Today I want to talk about something many traders underestimate — and end up hurting themselves, others, and their accounts because of it.
Let’s assume you trade in a café. 🍵
High or inappropriate background noise reduces focus, increases stress, and disrupts financial decision-making — especially in tasks that require precision, such as chart analysis or risk management.
Research shows that background noise negatively affects cognitive performance and alters risk perception (Payzan-LeNestour & Doran, 2021, Scientific Reports).
Now add a stop loss to that situation — which is completely normal.
You get frustrated.
Your mood shifts.
And that emotional state often spills over to the people around you.
Eventually, this can even lead to isolation — because most people around you don’t understand what a stop loss, drawdown, or trading emotion actually means.
Now imagine the opposite.
You trade in a space you fully control — your own office. 💻
No noise.
No distractions.
No emotional spillover to others.
Whether you hit a stop loss or a target, the emotional load stays contained.
Your awareness increases.
Your confidence improves.
And the overall quality of your trades goes up.
What do I do?
I only allow myself to trade at my personal workstation, inside my office, following my trading plan.
If I’m outside — at a café, a gathering, anywhere — and an alert goes off, I simply ignore it.
I don’t open trades.
There are rare exceptions, like managing a partial take profit at a predefined level — but nothing beyond that.
Believe it or not, this simple rule — controlling your trading environment — can improve both your win rate and trade quality.
That’s it.
By the way — I’m Skeptic , founder of Skeptic Lab.
I focus on long-term performance through psychology, data-driven thinking, and tested processes.
If this was useful, feel free to support it 🩵

What I Would Focus on If 2026 Was My First Serious Trading YearHere’s the blueprint I would follow if I were starting trading from scratch.
Not because this roadmap magically turns five years into one.
Not because everything suddenly becomes easy, smooth, or predictable.
But because the path becomes clearer.
You understand why you’re doing each step.
You know where you are in the process.
And you stop expecting results you haven’t earned yet.
So let’s begin.
Stage One: Education
Trading is no different from any serious skill — you don’t start without learning.
The problem is not whether to learn, but how.
There are many paths, many sources, and a lot of noise.
If I had to recommend one starting point, it would be
“The Handbook of Technical Analysis” by Mark Andrew Lim.
This book is so comprehensive that it can prepare you for IFTA CFTe Level 1 and 2 , one of the most respected technical analysis certifications.
But here’s the key question:
Do you need to read the entire book?
Absolutely not.
Over a thousand pages cover tools with heavy overlap and correlation.
Realistically, maybe 5% of the book will actually shape your trading.
So what should you focus on?
Chapter 2: Introduction to Dow Theory
This is the foundation of almost every technical concept.
If you don’t truly understand Dow Theory, everything else remains fragmented.
Chapter 4: Market Phase Analysis
Technical analysis is largely about recognizing structure.
This chapter is just as important as Dow Theory — and works best with it.
If you want to see how I apply this in actual trading, I’ve written a separate educational article on it. ( link )
Chapter 6: Volume Analysis
If you trade crypto without volume, you’re essentially navigating blind.
It’s like running downhill with your eyes closed.
I also recommend using one oscillator to assess momentum — especially if your trading style is momentum-based, as mine is.
For RSI and how I personally use it (sometimes differently from the book), I’ve shared a separate breakdown. ( link )
Chapter 14: Candlestick Analysis
You don’t need to memorize candle names.
Focus on understanding behavior, not labels.
That’s enough to write your first personal trading plan.
Stage Two: Backtesting
This step is essential.
I’ve already explained backtesting in depth in a separate educational idea that received Editor’s Pick, so I won’t repeat it here.
If you haven’t read it, start there. ( link )
Stage Three: Forward Testing
This is where most traders quit.
Not after a week.
Not after a month.
Sometimes after six months.
Sometimes after an entire year of near break-even results.
This phase is rarely discussed honestly.
I call it the “desolate prison pit” — the place Bruce Wayne escaped from.
It’s where patience, discipline, and identity are tested.
I’ve written about this phase separately if you want a deeper perspective. ( link )
Two critical notes here:
Do not abandon your strategy just because you’re not profitable after six months or a year.
Adjust it — don’t destroy it.
Do not quit.
Final Stage: Ownership
This is where things come together.
Writing your personal trading plan
Executing it with intention
Maintaining a daily trading journal
Practicing scenario writing (yes — the same skill I recently explained in detail)
Skipping this part means skipping responsibility.
You don’t drift into consistency.
You design it.
I could spend hours explaining daily analysis, journaling, and refinement — but attention spans are short now.
If you’ve read this far, you’re already ahead of most people.
I’ll leave you with a quote from Rango — from the Armadillo, Roadkill:
“I will see you on the other side.”
Peace out,
— Skeptic
Disclaimer:
This content is educational and reflects my personal experience and process.
The resources mentioned are shared for learning purposes only and are not sponsored or promotional.
Trading is complex, requires time, discipline, and emotional control, and is not a guaranteed or easy path to profitability.
There are no shortcuts, timelines, or promises implied in this framework.

What to Fix in Your Trading Process Before 2026I’ve been stopped out more than 300 times.
After years of trial, error, and reflection, I realized there was one thing missing from my process.
If I had understood and fixed it earlier, I would have become profitable much sooner.
It’s probably very simple to you.
And I’m confident that around 90% of traders either don’t do it at all — or do it incorrectly.
That skill is scenario writing.
It doesn’t matter whether you’ve been in the market for one year or three.
Writing scenarios before the trade can significantly improve your win rate.
Let me explain how.
Imagine your trading day has started.
You’re analyzing the market when suddenly a symbol begins to move with strong momentum.
Your mind says: “This fits my strategy. I should enter.”
Your emotions say: “Wait for a pullback — you’ll get a better price.”
Then another thought appears: “What if this trade covers a year’s profit?”
Logic, FOMO, and dozens of parameters start competing.
The result is usually a position with much lower quality than what your strategy actually requires.
Now imagine a second trader.
The day before, they wrote down all possible scenarios and the exact actions required for each one.
When momentum appears and resistance breaks, they enter immediately — without hesitation.
Not because they are emotionless, but because the plan already exists.
Nothing is surprising.
Nothing feels urgent.
Emotions play a minimal role because the decisions were made in advance.
I believe many of you have experienced the first situation.
So let’s look at how scenario writing should actually be done.
I’ve prepared a simple template you can copy directly into Notion.
Duplicate it daily and use it for every pair you analyze.
At first, it may feel difficult.
It might even take hours.
But after one month of consistent use, analyzing a symbol will often take less than seven minutes.
If you’ve followed my daily analyses, this structure may already feel familiar — because all my analysis is built around clear triggers, scenarios, and defined risk.
⚙️ Trading Scenario Journal Template
🧩 Structure Overview
Each position should have six sections:
Start (Setup & Entry Logic)
End (Exit & Contingency)
Actors (Market Elements)
Storyline (Expected Path)
Mid-Scenarios (Adjustments)
Goal (Purpose & Awareness)
1. Start – Setup & Entry Logic
Market Direction: Uptrend / Downtrend / Range (Weekly / Daily / 4H)
Entry Trigger: What confirms the entry (e.g., break & retest, candle pattern, volume)
Alternative Conditions: Valid setups if the main trigger fails
🗝 Only trade within the defined structure — no guessing.
2. End – Exit Logic & Contingencies
Exit Trigger: Where and why the position will be closed
If the Trigger Never Happens: Wait, cancel, or partially close
Profit Management: When to secure profit or move stop to break-even
🗝 Every “if–then” must be decided before the market forces you to act.
3. Actors – Key Market Factors
Each element either supports or weakens the setup:
Candles (strength, volatility, dominance)
Volume (confirmation or rejection)
RSI (momentum or exhaustion)
DMI / ADX (trend and volatility strength)
Support & Resistance (decision zones)
Trendlines / Channels (structural bias)
P.S: These are my personal trading plan confirmations; you need to define your own
🗝 Align at least three confirmations.
4. Storyline – Expected Path
Write the ideal “movie” of price behavior.
Example:
“Pullback to 66.4k → rejection → retest → continuation to 68k.”
If the story does not unfold, there is no trade.
🗝 You don’t predict. You prepare.
5. Mid-Scenarios – Management Adjustments
All reactions are pre-defined, not emotional:
Add if structure breaks with volume
Reduce if momentum fades or divergence appears
Exit early if volatility disappears or major news hits
Avoid adding if RSI is already overextended
🗝 Responses are designed mathematically, not emotionally.
6. Goal – Purpose of the Trade
Core Goal: Why this trade exists (continuation, test, reversal)
Expected Learning: What this trade should teach you — even if it loses
“If something unexpected happens, it means the scenario wasn’t fully planned.
Next time, it gets written down.”
If you stop writing scenarios by day seven, understand this clearly:
You are not supposed to be profitable yet.
Trading is not a comfort skill.
And this environment is not designed for comfort.
It requires structure, discipline, and emotional control.
If journaling, scenario writing, and structured analysis feel unbearable, quitting early is actually more honest than pretending.
By the way — I’m Skeptic , founder of Skeptic Lab .
I focus on long-term performance through psychology, data-driven thinking, and tested processes.
If this was useful, feel free to support it.
If you know a trader struggling with the same issue, share it — growing together is one of the most human experiences we have.
And if you have your own insights, leave them in the comments.
Let’s learn from each other.
— Skeptic

USDCHF Box Range — Don’t Miss the BreakLadies and gentlemen, if you're as obsessed with box breakouts as I am, this analysis is custom-built for you. We're tearing into USDCHF together—nailing those triggers and slipping in some solid education mid-way. No delays, straight fire. 🔥
I’m Skeptic , founder of Skeptic Lab . If you want to elevate your long-term performance through genuine psychology, data-driven insights, and proven strategies, you’ve landed in the right spot.
First, daily timeframe glance: We're deep in a huge consolidation box—ceiling at 0.81013 , floor at 0.79047 . A confirmed break of either side could ignite a months-long trend. After that savage rejection from 0.80829 (and even slicing through the box midline), we've been chopping in tight range for 11 straight days.
Now drop to 4H: The range box here is crystal clear. Upside break above 0.79653 lights up our long trigger —first aiming for the daily consolidation midline, then resistance at 0.80677.
Quick lesson (don't skip this) : For box breakout targets, always measure the box height (here ~0.38%) and project it upward from the breakout point. Lands us a first target at 0.79961. Why bother? It lets you manage risk surgically—set a tight stop so you hit R/R before target, banking partial profits early like a pro.
Short side: Break below 0.79352 looks tasty, but caution—we're hugging the bigger consolidation floor. Take profits quick, no greed.
Thanks for riding this idea—if it delivered value, hit that boost to keep the momentum rolling and follow to build the squad. Toss any symbol you want dissected in the comments, I'll handle it. 🩵
Now get outta here.

USDJPY: Last Clean Setup Before Christmas?Ladies and gentlemen, in our previous XAGUSD analysis , the long trigger we discussed did get activated and followed through as expected, offering a clean example of how structure and timing can align.
With that in mind, and as we approach the end of the year, if you're looking for another market with clear levels, tradable volatility, and a well-defined R/R, USDJPY is worth analyzing closely before Christmas.
I’m Skeptic , founder of Skeptic Lab . If you want to elevate your long-term performance through genuine psychology, data-driven insights, and proven strategies, you’ve landed in the right spot.
Let’s kick off with the daily timeframe : After peaking at 157.567 , it dove into a time-based correction. We printed lower highs in this pullback, but those highs couldn't crack the prior support at 154.539 —so buyer strength is still alive and kicking, even mid-correction. This screams that if the bearish secondary trend wraps up, buyers could dominate the next uptrend wave hard: sellers are burned out, and the buyers who scooped up that liquidity and seller exhaustion? They'll rocket prices higher in the follow-up leg.
On the economic front , the biggest news for JPY drops Friday: the rate decision. Markets are almost locked in on the Bank of Japan hiking rates again. At first glance, you might think "sweet, JPY strength = USDJPY dump," but it's not that simple. The snag? Japan's government is pushing "now's not the time for belt-tightening—we need more stimulus," while the central bank counters with "inflation's real, rates gotta rise." This clash is spiking market fear.
What's the fallout?
Investors are dumping Japanese bonds en masse.
Yields on those bonds have skyrocketed to their highest since 2007 (hitting an 18-year peak).
Meanwhile, the Yen keeps weakening.
This uncertainty could keep pounding the JPY even more—which lines up perfectly with the technicals we're seeing.
Now, drop to the 1H timeframe to hunt that trigger: After busting the downtrend line, we've formed higher highs and higher lows. If resistance at 155.605 cracks, that's our green light to go long. But if price dumps below 155.352 before the break, trigger's off—we'll scout a fresh one, and I'll update right here under this idea, 'cause that's my duty :)
For extra confirmation, tap RSI: A break above 68.27 could seal the deal (note: overbought levels can flex 5% around 70 based on market vibes—right now, reactions make 68.27 the key spot over 70).
Dial your targets by R/R: First up, resistance at 156.093, then the daily Resistance at 156.933.
Thanks for tuning into this idea—if it clicked for you, I'd appreciate a boost to keep the energy rolling and follow to grow our community. If there's a specific symbol you want analyzed, drop it in the comments. 🩵
Now get outta here.

The Last Bitcoin Setup Before 2026?Ladies and gentlemen, maybe last week Bitcoin handed a few of you stop losses and now your nerves are fried—if you want next week (or hell, your very last Bitcoin position of 2025) to actually count, you've come to the right place. We're dissecting Bitcoin together and pinning down those long/short triggers crystal clear.
I’m Skeptic , founder of Skeptic Lab . If you want to elevate your long-term performance through genuine psychology, data-driven insights, and proven strategies, you’ve landed in the right spot.
Let's start with the daily timeframe: As you can see, we're locked in a range after that brutal dump from 100k to 82k. Ceiling sits around 93k, floor around 85k. Break 93k? You better have a position—could spark a pullback straight to 100k or even resume the full HWC uptrend. Drop below 85k? Load shorts, we're continuing that first daily bearish leg with an initial target at 78,440 .
We called all this before, but what's the flow right now? Where's the real momentum?
Zoom in on those daily candles: It's glaring—the upside momentum is dominating here. Yesterday's candle straight-up engulfed the previous four (all screaming bearish bias) and closed strong to the upside. That's a textbook sign we could see solid growth in lower timeframes next week.
But if we factor in the classic pre-Christmas scenario that's played out most years? Expect 2 weeks of ranging or downside chop, followed by that post-holiday "markets wake up" explosive move we're all waiting for.
Long story short: Please Reduce your risk this week.
Drop to the 4H timeframe: Yesterday, with the Japan rate news, we got wild swings. BoJ hiked rates exactly as expected—0.25% to 0.75%, the highest in about 30 years. Market had priced it in, so no real directional fireworks, just pure volatility chaos.
Plan now? We had a fake breakout below support at 85,845 . Classic—post-fakeout below, odds heavily favor breaking the top next. So for longs: 4H box ceiling break at 89,395 is our trigger, with the main trigger still that 93k daily resistance.
For shorts: Clean break of the box floor at 85,845.
We might get dead flat action today, but tomorrow—right before New York open—glue yourself to the chart. Moves love hitting then. Volume spike remains your best friend for confirmation when we're this range-bound and momentum-light.
Thanks for diving into this idea—if it clicked, I'd love a BOOST to keep the fire lit and a follow to grow our crew. Drop any symbol you want broken down in the comments, and I'll hit it. 🩵
Now get outta here.

Meet the Market’s New Bully: DXYLadies and gentlemen, if you think the neighbor’s kid who screams from dawn till dusk is the most annoying thing in the world, you’re dead wrong—you clearly haven’t wrestled with the Dollar Index (DXY) yet...
In this analysis, we’re going to tame this screaming little monster together and hunt down its triggers side by side.
I’m Skeptic , founder of Skeptic Lab . If you want to elevate your long-term performance through genuine psychology, data-driven insights, and proven strategies, you’ve landed in the right spot.
Let’s kick off with the daily timeframe:
We’ve been trapped in a massive consolidation box for ages. A decisive break of either the ceiling or the floor could spark a proper long-term daily trend. We had a solid uptrend trendline that just got smashed downward, and right now we’re sitting smack on the midline of this bigger box.
If that midline cracks lower, expect a straight shot down toward the key support floor at 96.455. On the flip side, a bounce here makes a ceiling retest very much on the table—and honestly, the odds of an upside break look higher if we get that reaction.
Now drop to the 4H timeframe:
After snapping the upward trendline to the downside, we’ve printed lower highs and lower lows—LWC is officially BEARISH, so our bias is SHORT. We got a strong reversal candle reaction off support at 98.098 , which looks like a seriously important zone. Right now, we’re rejecting hard from resistance at 98.548 , engulfing a bunch of those prior green candles—plenty of fuel to drive us straight to the lows.
Short trigger: Clean break and close below 98.098 support.
For longs, I’d much rather see us first punch through 98.548 to the upside, then confirm real momentum on the next leg up. Why? LWC is bearish, and with both HWC and MWC stuck ranging, the lower timeframe carries way more weight right now.
That’s it :) thanks for sticking with this idea. If it helped, I’d really appreciate a BOOST to keep the momentum going and a follow to grow our community. Drop any symbol you want analyzed in the comments, and I’ll get to it. 🩵
Now get outta here.

Hit All Your Monthly Targets with XAGUSDLadies and gentlemen, XAGUSD is about to activate a trigger that could kick off another uptrend rally for silver—but nailing it won't be that easy... let's break it down. 🔍
I’m Skeptic , founder of Skeptic Lab. If you want to elevate your long-term performance through genuine psychology, data-driven insights, and proven strategies, you’ve landed in the right spot.
In the daily timeframe, after smashing through the ceiling at 54.47959 and surging 8% , we're now ranging just below the resistance at 58.79759 . But every candle that's printed has been pushing hard to break this level: long lower shadows and short upper ones, signaling sellers tried to drag the price down, but buyers fought back fiercely and closed the body strong.
Tomorrow's rate news drops. Over 89.6% are betting on a 25 basis point cut (source: according to the CME FedWatch Tool). What does this mean in plain English? Borrowing gets cheaper, liquidity floods into stocks, companies ramp up investments = boom for commodities, equities, and Bitcoin. But on the flip side, the market might have already priced this in.
Silver's massive run-up these past weeks? Largely because forecasts have been screaming "rate cut incoming"...
My take? If we can open the position today and lock in profits tomorrow pre-news—making it fully risk-free—that's ideal. If we hit stop loss, hey, we gained real market insight (priceless), and exited with zero risk hanging over us. Win the trade? Massive R/R upside. + Slash your risk—drop from 1% to 0.1% exposure—so a stop barely stings. (News trades have lower win rates, hence the low risk play :) )
In the 1H timeframe, a breakout candle above 58.79759 fires our long trigger. Stay out of lower frames, please! They're full of shit candles, insane volatility, and fakeout traps—since the core momentum and real action is locked in 1H right now.
That's it—DO NOT FOMO in, and if this analysis hits your feed, a quick boost on that rocket button keeps the vibes going :) 🩵
Now get outta here.

Is having a stop loss on Bitcoin embarrassing?Is having a stop loss in the crypto market embarrassing? This isn't just a question—it's a new trading style that's become trendy and has pulled the culture of young crypto traders right into its orbit... a culture without responsibility that wants to escape reality and market principles, chasing higher profits and loftier positions. A culture where 5% monthly profit is laughable to them, and they won't settle for anything less than 50% to 100% gains.
Let's see what happens to this minority in just the past few weeks with this ideology: On October 10, a 16% drop (they get liquidated and wiped out of the market). On September 22, with that long squeeze candle, a 4.30% drop (wiped out for the second time). On November 3 and 4, a 10% drop (wiped out for the third time :))
That said, a huge crowd usually floods the market right before accumulation phases or trend changes (when big investors need liquidity), and after supplying that liquidity, they get wiped out too... I haven't found a precise indicator yet for when these folks show up—if you've got one, comment below; maybe I'll write a script for it myself. But the point is, after these people get liquidated, we usually enter an accumulation phase, followed by a trend reversal. Long squeeze and short squeeze candles are great examples for spotting these crowds, and then you can expect ranging, followed by the trend change.
In the 4H timeframe, we've relatively shifted the range—hopefully forming a higher high and higher low above 104,862.71 . A break of 106,542.82 in the 4H timeframe could be our first trigger for a trend change in this leg. But the main trigger is breaking the resistance at 111,287.45, since this resistance is what triggered the reaction that formed the lower low at 100,503.60—so it's hugely important, and breaking it would put Bitcoin back into uptrend mode.
+ The probability of the US government shutdown ending has hit 84% on Polymarket. Actually, that's what drove the growth in recent days... You might think it's weird—like, shouldn't we grow after good news? I say no, the market moves based on expectations, not news or anything else... Does the expectation say the US government will reopen? Okay, let's grow—that's it.
+ A super important point: Trump officially announced that every American (except high earners) will get $2,000. Something like those stimulus checks during COVID in 2020! Remember that?
And what I'm saying here impacts daily and weekly timeframes, not 4H... So if you're trading in lower timeframes, no need to pay attention to this stuff—per your strategy, if it signals long, open long; if we dump from here and go below 104k, hunt for shorts :) Easy.
If you like these multi-faceted, educational analyses, definitely follow—it's crazy we're still under 1,000. We need a bigger community to pull off even bigger things. Thanks for your attention—till next time, peace out.

The Bitcoin Long Trigger No One MentionsYo traders, Skeptic from Skeptic Lab! 🚀 Bitcoin’s in a wild phase—any move could drag us for weeks! In this video, I break down the buy squeeze candle that started it all, dive candle-by-candle into the market, and hunt for long/short triggers. We’ll also check Bitcoin dominance and altcoin vibes. From a V pattern to pivot 4 action, I’ve got you covered. no FOMO! Drop your coin picks in the comments, boost if it helped, and follow for more.

Bitcoin Price Action Explained: Daily & 4H Trade TriggersIn today’s episode (EP.18), I’m breaking down Bitcoin & Ethereum price action with a full multi-timeframe strategy:
Daily → structure, momentum & breakout confirmation
4H → long/short triggers with exact levels
1H & 15m → entry timing & risk management
BTC.D vs ETH/BTC → why liquidity might shift to Ethereum
⚡ Main idea: Bitcoin looks ready for an 8% rally, while Ethereum has a 10% breakout potential if key levels break. But only if you know where to look and how to manage your risk.
👉 If you don’t know what “partial profit” is, check my video 5 Lessons from My First 100 Trades ( link here ).
Everyday I post straightforward Bitcoin analysis with no BS. follow so you never miss the triggers.
Until tomorrow – peace out ✌️

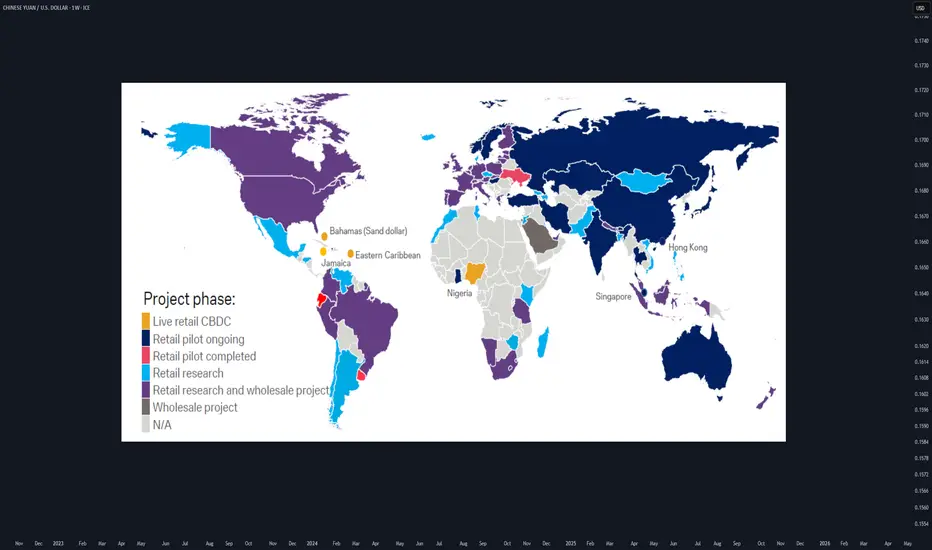
CBDCs for FXTraders :Your 2025 Guide to Digital Currency MarketsWhat if the U.S. dollar or Chinese yuan you’re trading today becomes digital tomorrow?
As of 2025, 132 countries are piloting Central Bank Digital Currencies (CBDCs) , with China’s digital yuan already in 260 million wallets. This isn’t sci-fi—it’s happening now, and it’s about to shake up forex markets.
hey I’m Skeptic :) At Skeptic Lab , we don’t chase hype—we dissect it. CBDCs are the next frontier, and I’m here to show you how to trade this shift without getting burned. In this guide, you’ll learn what CBDCs are, how they’ll mess with pairs like CNY/USD , and a beginner-friendly strategy to profit from the chaos. Let’s get ahead of the curve.
What Are CBDCs? A No-BS Breakdown
Central Bank Digital Currencies are digital versions of fiat money, backed by central banks. Think digital yuan or digital USD—same value, but on a blockchain or centralized ledger.
132 countries , including China (260M digital yuan wallets), India (digital rupee pilots), and the EU (digital euro trials), are testing CBDCs in 2025. Why? Control, speed, and lower transaction costs.
Unlike crypto, CBDCs are tied to fiat, so they’ll directly impact pairs like CNY/USD, INR/USD, or EUR/USD. Expect new volatility patterns and liquidity shifts.
I’m not sold on CBDCs being a trader’s paradise yet—central banks love control, and that could mean less freedom ( I hate XRP too, but I trade it when it gives my fuking trigger... ). But the opportunity is real if you know how to play it.
How CBDCs Will Shake Up Forex Markets
CBDCs could make cross-border transactions faster, boosting liquidity for pairs like CNY/USD. China’s digital yuan is already used in global trade pilots.
As countries roll out CBDCs, expect short-term price swings. For example, CNY/USD could spike if digital yuan adoption outpaces expectations.
Central banks might tighten forex controls with CBDCs, impacting leverage or spreads. Stay sharp—regulations are coming. Focus on CNY/USD (China’s digital yuan is live), INR/USD (India’s pilot is scaling), and EUR/USD (digital euro trials are accelerating). The hype says CBDCs will streamline forex, but I’m skeptical—centralized digital money could mean more manipulation. Still, volatility is a trader’s friend if you’re prepared.
Trading Strategy—Range Trading CNY/USD
Why CNY/USD? “China’s digital yuan is the most advanced CBDC, with 260M wallets and growing global use. CNY/USD is volatile but often range-bound, perfect for beginners.
Step-by-Step Strategy:
Identify the Range: “On TradingView, use daily charts to spot CNY/USD’s Range boxes ( Consolidation phases ). Look for consolidation after CBDC news. ”
Enter the Trade: “Buy after resistance breakout (breakout above consolidation box); sell after support breakout (breakout below our consolidation box). Set a stop-loss bellow the breakout candle or previous low in lower time frames(4h. ) or below previous support (4h) or above resistance and high (if you go for short).”
Take Profits: “clone the consolidation box and put it above or below the previous box. take partial profit (35% at rrr of 2 then 40% at rrr of 5 then 20% at rrr of 10 and close the rest when we formed lower highs and lower lows (based on dav theory)”
Risk Management: “ Risk only 1-2% of your account per trade. CBDC news can be fakout so have your other confirmations (such as RSI and PIVOT POINTS etc.)
Range trading isn’t sexy, but it’s steady. CNY/USD’s CBDC-driven swings make it a solid pick for 2025—just don’t get greedy.
Risks and What to Watch in 2025
CBDCs could tighten central bank control, reducing forex flexibility. Sudden policy shifts (e.g., China banning crypto trades again) could tank CNY/USD . Plus, tech glitches in CBDC rollouts might cause market freezes. Track CBDC adoption news on X—look for updates on China’s digital yuan, India’s rupee, or EU trials. Follow central bank announcements and IMF reports for clues.
I’m all in on spotting trends early, but CBDCs aren’t a free lunch. Stay skeptical , trade small, and always have an exit plan.
What’s your take on CBDCs in forex? Drop your thoughts bellow , and let’s debate!
Boost for more Skeptic takes :) 📈
Disclaimer: This article was written for educational purposes only and should not be taken as investment advice.
Bitcoin Is Hiding Something BIG (Target Revealed)In Episode 17 of my Bitcoin daily analysis , we just hit a +2.3% gain from the last long trigger, and now BTC is pressing against a critical resistance. If this level breaks with volume, the next +2.7% move could be right around the corner.
In this video, I’ll break Bitcoin down across weekly, daily, and 4H timeframes to show you:
Why this resistance is so important 🔑
How I set my next upside target step by step
The role of volume, BTC dominance, and TOTAL2/TOTAL3 in confirming moves
Whether altcoins (like ETH and SOL) are about to outperform Bitcoin
❌ Don’t FOMO.
✅ Stick to risk management.
✅ Trade your plan, not your emotions.
If you found this analysis helpful, share it with your trading friends and let’s grow smarter together.

BTC Daily: 26% Growth & ATH Correction—What's Next?Welcome back, guys—it's Skeptic from Skeptic Lab! 🚀
This is Episode 14 of our Daily Bitcoin Analysis. After a 26% growth and hitting ATH, Bitcoin is correcting—so what’s the smartest move now? Long, short, or wait? Let’s dive in.
💡 What you'll learn in this video:
Daily timeframe trend analysis (higher highs & higher lows) ✅
Key support & resistance levels to watch 📊
Smart strategies for shorts and longs with proper risk management ⚡
BTC.D & altcoin flows—where the money is moving! 💰
if it helped, give it a boost :)

Don’t Buy Ethereum Until You Watch This!In this episode, I take a skeptical look at Ethereum’s latest price action. We’ll break down the recent pullback, identify clear triggers for long setups, and discuss what happens if key levels fail. Plus, a quick educational tip on how ETH.D and BTC.D can signal the start of altseason.
⚠️ This content is for educational purposes only and not financial advice.

Indexes Pull Back – Is This the Entry You Missed? | SPX500 & HK5Most major indexes like SPX500 and HK50 have retraced about 50% of their recent gains, giving a second chance to those who missed the previous leg up. In this episode, I break down key support zones and share simple, high-probability triggers—range breakouts, engulfing candles, and fakeouts—to spot momentum shifts. 🔍
📍Remember: follow the trend, manage your risk, and no shorting here as it goes against HWC/MWC bias.
( Educational content only , not financial advice. Comment your favorite ticker for future analysis.)
