SKLUSDT Forming Falling WedgeSKLUSDT is forming a basic falling wedge reversal signal that often indicates an upcoming breakout. The price has been consolidating within a narrowing range, suggesting that selling pressure is weakening while buyers are beginning to regain control. With consistent volume confirming accumulation at lower levels, the setup hints at a potential bullish breakout soon. The projected move could lead to an impressive gain of around 190% to 200% once the price breaks above the wedge resistance.
This falling wedge pattern is typically seen at the end of downtrends or corrective phases, and it represents a potential shift in market sentiment from bearish to bullish. Traders closely watching SKLUSDT are noting the strengthening momentum as it nears a breakout zone. The good trading volume adds confidence to this pattern, showing that market participants are positioning early in anticipation of a reversal.
Investors’ growing interest in SKLUSDT reflects rising confidence in the project’s long-term fundamentals and current technical strength. If the breakout confirms with sustained volume, this could mark the start of a fresh bullish leg. Traders might find this a valuable setup for medium-term gains, especially as the wedge pattern completes and buying momentum accelerates.
✅ Show your support by hitting the like button and
✅ Leaving a comment below! (What is your opinion about this Coin?)
Your feedback and engagement keep me inspired to share more insightful market analysis with you!
SKLBTC

SKLUSDT Forming Falling WedgeSKLUSDT is forming a falling wedge patter, a classic bullish reversal setup that signals potential trend change after a sustained downtrend. The pattern is tightening, showing that selling pressure is weakening while buyers are gradually stepping in. The good trading volume further supports the likelihood of a strong breakout ahead. Based on current technical structure and investor sentiment, SKLUSDT holds an expected gain potential of 90% to 100%+, making it an attractive opportunity for traders looking for momentum-based setups.
This falling wedge formation indicates that the market is approaching a breakout zone where bulls are likely to regain control. The price compression within the wedge pattern suggests accumulation by stronger hands, while short-term traders may be waiting for confirmation before entering. A decisive breakout above the upper trendline could trigger a sharp upward move, potentially aligning with broader market recovery trends across the altcoin sector.
Investors’ growing interest in SKLUSDT adds further confidence to the technical outlook. With volume confirming accumulation and sentiment leaning bullish, the coin could soon see increased volatility to the upside. Traders are watching closely for a breakout confirmation, as the next leg up could deliver substantial gains once momentum shifts decisively.
✅ Show your support by hitting the like button and
✅ Leaving a comment below! (What is You opinion about this Coin)
Your feedback and engagement keep me inspired to share more insightful market analysis with you!

#SKL/USDT - shorters will get rekt!#SKL
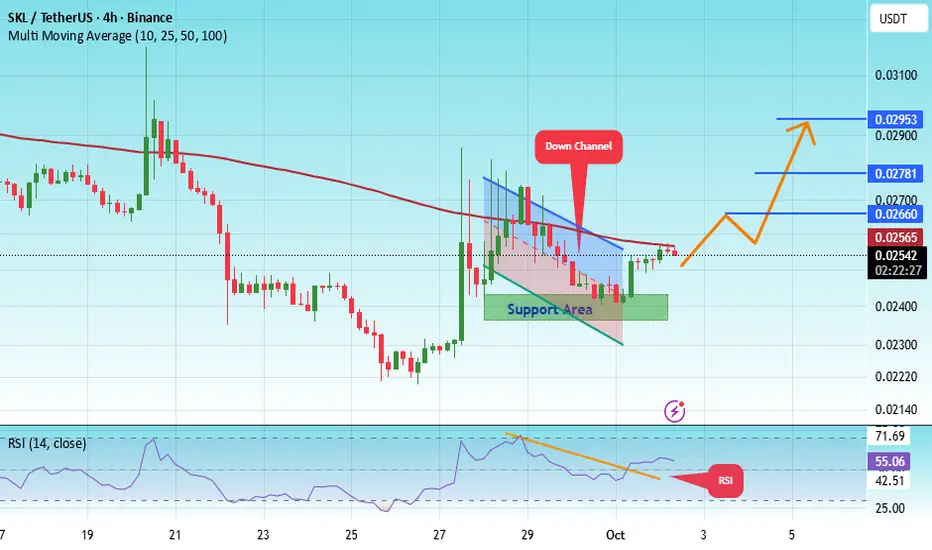
The price is moving within a descending channel on the 1-hour frame, adhering well to it, and is heading for a strong breakout and retest.
We have a bearish trend on the RSI indicator that is about to be broken and retested, which supports the upward move.
There is a major support area in green at 0.02412, representing a strong support point.
We are heading for consolidation above the 100 moving average.
Entry price: 0.02545
First target: 0.02660
Second target: 0.02781
Third target: 0.02950
Don't forget a simple matter: capital management.
When you reach the first target, save some money and then change your stop-loss order to an entry order.
For inquiries, please leave a comment.
Thank you.
#SKL/USDT#SKL
The price is moving within a descending channel on the 1-hour frame, adhering well to it, and is heading for a strong breakout and retest.
We have a bearish trend on the RSI indicator that is about to be broken and retested, which supports the upward breakout.
There is a major support area in green at 0.02800, representing a strong support point.
For inquiries, please leave a comment.
We are in a consolidation trend above the 100 Moving Average.
Entry price: 0.02970
First target: 0.03050
Second target: 0.03117
Third target: 0.03200
Don't forget a simple matter: capital management.
When you reach the first target, save some money and then change your stop-loss order to an entry order.
For inquiries, please leave a comment.
Thank you.

SKLUSDT Forming Bullish WaveSKLUSDT is showing signs of forming a strong bullish wave pattern, which could be a major signal for an upcoming explosive move. The structure indicates that price action is gradually building momentum and preparing for a breakout. With solid trading volume supporting this setup, SKLUSDT has the potential to deliver massive upside gains in the near term, with expectations ranging from 190% to 200%+.
This bullish wave pattern suggests accumulation and growing investor confidence. Historically, similar setups have triggered sharp rallies once resistance levels are broken, and SKLUSDT appears to be following a comparable path. The presence of higher lows and steady market activity strengthens the outlook, pointing towards a sustained upward push once a breakout occurs.
Investor sentiment is also favoring SKLUSDT as interest in this project continues to rise. A clean breakout above the resistance zone could unleash strong bullish momentum, driving prices to new levels and attracting even more buyers into the market. With these factors in play, SKLUSDT is positioned as one of the crypto pairs to watch closely for substantial growth potential.
✅ Show your support by hitting the like button and
✅ Leaving a comment below! (What is You opinion about this Coin)
Your feedback and engagement keep me inspired to share more insightful market analysis with you!

SKLUSDT Forming Bullish PennantSKLUSDT is currently trading within a bullish pennant pattern, a technical structure that often signals a potential bullish reversal once price breaks above the channel resistance. The steady trading volume indicates active participation from both buyers and sellers, but with the pattern narrowing, the balance is slowly tipping in favor of the bulls. Based on the current chart structure, a confirmed breakout could pave the way for a 40% to 50%+ upside move in the near term.
The price action shows multiple touches on both channel boundaries, confirming the validity of the pattern. Historically ,bullish pennants tend to resolve upward when accompanied by healthy volume, as it signals that accumulation is taking place beneath the surface. A breakout with strong momentum could trigger a rapid push toward the projected profit targets, offering a favorable risk-to-reward ratio for traders positioning early.
Investor sentiment around SKLUSDT is improving, with more market participants taking interest in the project’s potential. This technical setup, combined with rising attention, creates an environment where any bullish catalyst — such as positive news, market-wide rallies, or on-chain developments — could spark a decisive upward move. Monitoring the breakout zone closely will be key to catching this opportunity at the right time.
✅ Show your support by hitting the like button and
✅ Leaving a comment below! (What is You opinion about this Coin)
Your feedback and engagement keep me inspired to share more insightful market analysis with you!

SKLUSDT Forming Descending ChannelSKLUSDT is currently trading within a descending channel pattern, a technical structure that often signals a potential bullish reversal once price breaks above the channel resistance. The steady trading volume indicates active participation from both buyers and sellers, but with the pattern narrowing, the balance is slowly tipping in favor of the bulls. Based on the current chart structure, a confirmed breakout could pave the way for a 40% to 50%+ upside move in the near term.
The price action shows multiple touches on both channel boundaries, confirming the validity of the pattern. Historically, descending channels tend to resolve upward when accompanied by healthy volume, as it signals that accumulation is taking place beneath the surface. A breakout with strong momentum could trigger a rapid push toward the projected profit targets, offering a favorable risk-to-reward ratio for traders positioning early.
Investor sentiment around SKLUSDT is improving, with more market participants taking interest in the project’s potential. This technical setup, combined with rising attention, creates an environment where any bullish catalyst — such as positive news, market-wide rallies, or on-chain developments — could spark a decisive upward move. Monitoring the breakout zone closely will be key to catching this opportunity at the right time.
✅ Show your support by hitting the like button and
✅ Leaving a comment below! (What is You opinion about this Coin)
Your feedback and engagement keep me inspired to share more insightful market analysis with you!

SKLUSDT Signals Potential Trend Reversal!SKLUSDT has broken above a long-standing descending Channel resistance on the daily timeframe. This breakout is backed by a noticeable increase in trading volume, signaling renewed buying interest after months of consolidation.
The chart setup indicates a potential shift in market structure from a prolonged downtrend into an accumulation-to-uptrend phase. If the breakout sustains above the $0.027 level, we could see a 50%–125% move in the coming weeks.
Cheers
Hexa

#SKL/USDT#SKL
The price is moving in a descending channel on the 1-hour frame and is expected to continue upwards
We have a trend to stabilize above the moving average 100 again
We have a descending trend on the RSI indicator that supports the rise by breaking it upwards
We have a support area at the lower limit of the channel at a price of 0.02733
Entry price 0.02916
First target 0.03010
Second target 0.03090
Third target 0.03200

SKLBTC BEARISH As @NayibSayilor requested, I analyzed the SKLBTC chart, and here are the results.
I believe it will experience a slight decline towards the target prices. The danger zone and stop loss levels are also indicated on the chart.
Note: My ideas are not intended for any type of scalping or scalpers!
Here are my other ideas:
www.tradingview.com

#SKL/USDT#SKL
The price is moving in a descending channel on the 1-hour frame and is expected to continue upwards
We have a trend to stabilize above the moving average 100 again
We have a descending trend on the RSI indicator that supports the rise by breaking it upwards
We have a support area at the lower limit of the channel at a price of 0.04324
Entry price 0.04380
First target 0.04482
Second target 0.04622
Third target 0.04775

#SKL/USDT#SKL
The price is moving within a bearish channel pattern on the 4-hour frame, which is a strong retracement pattern
We have a bounce from a major support area in green at 0.03500
We have a tendency to stabilize above the Moving Average 100
We have a downtrend on the RSI indicator that supports the rise and gives greater momentum, upon which the price is based higher at the discount
Entry price is 0.04100
The first target is 0.04600
The second target is 0.05450
The third goal is 0.06670

SKLUSDT | Patience = ProfitabilityBoth the green line and the blue box are clean areas for ordering, but it would be better to act with the hourly reactions to be received from here. I am alarmed and waiting. There is no need to be FOMO, bull time is the time when there are deep corrections as well as extreme rises. There will be times when our entries arrive when they wonder if the trend is reversing.
Patience = Profitability
I don't overcomplicate things and add a ton of dirty crap to my charts, but you can check out the success of my analysis below.
I approach trading with confidence backed by experience and past success in identifying high-probability setups.
While I don’t claim to be the best, my track record speaks for itself, and I strive to let my analysis and results do the talking. Watch these levels closely—markets can confirm what charts already whisper. Let’s see how this plays out together.
My Previous Ideas
DOGEUSDT.P | 4 Reward for 1 Risk much more if you hold it.
RENDERUSDT.P | HTF Accuracy
ETHUSDT.P | Accurate Buyer Zone Identification | High Risk Reward if you hold it.
BNBUSDT.P | Accurate Buyer Zone Identification | High Risk Reward if you hold it.
Bitcoin Dominance | Great Characteristic Detection and Accurate Analysis

SKL Looks BullishFrom where we placed the green arrow on the chart, the rising waves of SKL have started.
Wave A and B seem to be over and now wave C is entering.
The target is a red box.
Closing a daily candle below the invalidation level will violate this analysis.
For risk management, please don't forget stop loss and capital management
Comment if you have any questions
Thank You

SKL - Daily more fallSKLUSD has recently experienced a pullback below its crucial support zone, as highlighted in the chart. This movement indicates a potential shift in market sentiment.
Typically, a pullback under a support zone, especially when sustained, can signify weakness and increased selling pressure, hinting at the possibility of further declines.
This breach suggests that buyers are losing control, and if SKLUSD does not reclaim the support zone swiftly, it may continue to trend lower, targeting new support levels.

SKL is bearish (1D)SKL's bullish Diametric seems to be over.
Now we are at the end of the G wave of this diametric, which is the last wave of this diametric.
We expect SKL bearish waves to start soon.
We have two important targets on the chart.
Closing a daily candle above the invalidation level will violate the analysis.
For risk management, please don't forget stop loss and capital management
When we reach the first target, save some profit and then change the stop to entry
Comment if you have any questions
Thank You

#SKL/USDT#SKL
The price broke the last bear flag since May 2022
The Moving Average 100 was broken to the upside strongly.
The price moves in two waves.
The price now is 0.06400.
The first target is 0.07850.
The second goal is 0.11690.
This rise is supported by breaking the descending triangle pattern and breaking the moving average 100 and the MACD indicator.
We may see some correction before completing the rise.

SKL/USDT Bullish Leap from Support Zone? 🚀SKL analysis💎 Paradisers, get ready for a lucrative trading chance with #SKLUSDT, firmly placed in a vital support zone and hinting at a possible bullish shift.
💎 As we explore #SKL's path, it's climbing from a key support level at $0.09818. Maintaining this momentum could highly increase the chances of a bullish journey, especially as we've observed resistance transforming into support, bolstering its upward potential.
💎 If the drive behind LSE:SKL starts to wane, anticipate a bullish resurgence from the steadfast support at $0.08170. Yet, a descent below this critical point may trigger a significant drop.

#SKL/USDT | Ready to rise strong
#SKL
The price is moving in a perfect triangle on the 4-hour frame
Some correction is expected before the triangle breaks higher
We have oversold conditions on the MACD indicator
Entry price is 0.07220
First target 0.07500
Second goal 0.02180
Third goal 0.07991
Fourth goal 0.08284

SKL LOOKS BEARISH (4H)From the wave counter, it seems that SKL is completing a bearish triangle.
We have an untested resistance range, which is a good place to open sell/short positions.
We specified the targets on the chart. Closing two 4-hour candles above the invalidation level will violate the analysis
For risk management, please don't forget stop loss and capital management
When we reach the first target, save some profit and then change the stop to entry
Comment if you have any questions
Thank You

SKL - Daily , Continuing its bullish TrendSKALE is consolidating above a key zone, positioning it for a smooth ascent to the next level.

SKL BUY SETUPWe are considering a buy setup for SKL. Put this symbol in the watch list and enter the position if it reaches the buy zone.
Do not open a position without capital management and stop setting, and note that this is a buy setup, do not use this setup to open sell/short positions.

Trade signal | SKALE (SKL) completed setup for upto 37.50% pumpHi dear friends, hope you are well, and welcome to the new trade setup of SKALE (SKL) with US Dollar pair.
Previously we caught almost 22% pump of SKL as below:
Now on a 4-hr time frame, SKL has formed a bullish AB=CD move for the next pump.
Note: Above idea is for educational purpose only. It is advised to diversify and strictly follow the stop loss, and don't get stuck with trade.
