SKL showing a very good investment opportunityHi Everyone;
today we have one of the best risk to reward Investment opportunity
it is more than 100 times the risk and the chart is look very promising.
I expect breaking the previous bear market key point will clear the way to the final target
SKLUSD

#SKL/USDT - shorters will get rekt!#SKL
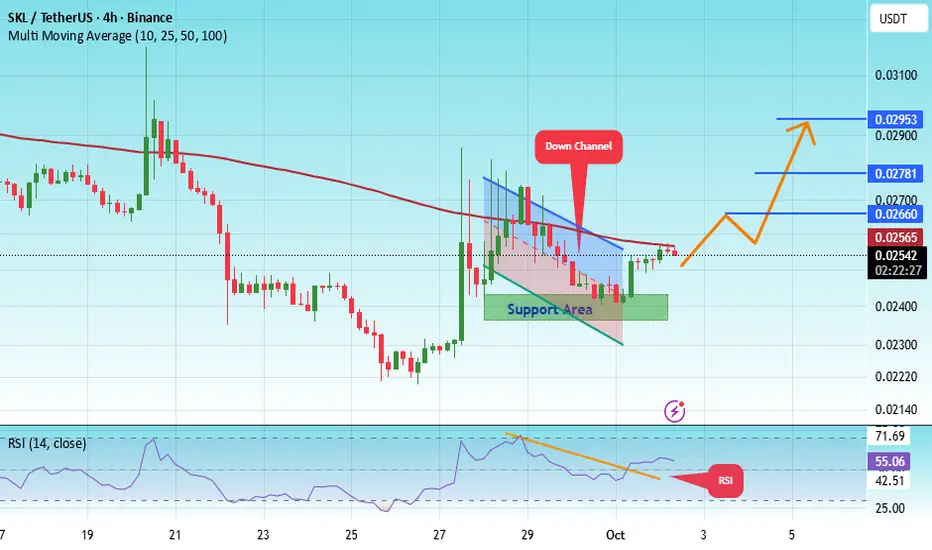
The price is moving within a descending channel on the 1-hour frame, adhering well to it, and is heading for a strong breakout and retest.
We have a bearish trend on the RSI indicator that is about to be broken and retested, which supports the upward move.
There is a major support area in green at 0.02412, representing a strong support point.
We are heading for consolidation above the 100 moving average.
Entry price: 0.02545
First target: 0.02660
Second target: 0.02781
Third target: 0.02950
Don't forget a simple matter: capital management.
When you reach the first target, save some money and then change your stop-loss order to an entry order.
For inquiries, please leave a comment.
Thank you.
#SKL/USDT#SKL
The price is moving within a descending channel on the 1-hour frame, adhering well to it, and is heading for a strong breakout and retest.
We have a bearish trend on the RSI indicator that is about to be broken and retested, which supports the upward breakout.
There is a major support area in green at 0.02800, representing a strong support point.
For inquiries, please leave a comment.
We are in a consolidation trend above the 100 Moving Average.
Entry price: 0.02970
First target: 0.03050
Second target: 0.03117
Third target: 0.03200
Don't forget a simple matter: capital management.
When you reach the first target, save some money and then change your stop-loss order to an entry order.
For inquiries, please leave a comment.
Thank you.

SKL/USDT — Consolidation at a Critical Demand Zone, Big Move?Currently, SKL/USDT is trading around 0.0296 USDT, sitting right inside the historical demand zone (0.026 – 0.030) that has acted multiple times as a strong pivot. This area is a decision point: whether the bulls defend it or the bears break it will define the next major trend.
---
🔎 Structure & Price Pattern
1. Key Demand Zone (yellow box)
Price is consolidating after a sharp rejection from the August spike. This zone reflects accumulation, where buyers are absorbing supply to prevent a deeper breakdown.
2. Sideways Consolidation
Daily candles show small bodies with multiple wicks, signaling indecision. Such phases often precede a strong breakout move.
3. Layered Resistances (yellow dashed lines)
Several resistances stand above the current level: 0.0373 – 0.0495 – 0.0617 – 0.0696 – 0.0798 – 0.0859. Each can serve as a profit-taking zone or temporary rejection point.
4. Liquidity Grab (August spike)
The sharp August rally that quickly reversed looks like a liquidity sweep — stop orders above were taken before the retracement. Now, the retest of demand may set the base for a larger move.
---
🚀 Bullish Scenario
Main trigger: Daily close above 0.03730 USDT → signals strength and opens the way higher.
Targets:
0.0373 (+26%) → first breakout level.
0.0495 (+67%) → mid target.
0.0617 (+108%) → extended target.
0.0859 (+190%) → retest of previous swing high.
Risk/Reward setup: Example — Entry at 0.0296, stop at 0.025 (−15.5%), target 0.0495 (+67%) → RR ~ 4.3 : 1.
📌 This scenario holds if demand remains intact and bullish candles form with strong volume.
---
⚠️ Bearish Scenario
Main trigger: Daily close below the demand zone (0.026 – 0.030).
Downside targets:
0.0190 (−36% from current price).
0.01579 (−46% from current price, previous major low).
Breakdown would likely resume the bearish trend with deeper correction risk.
📌 This scenario becomes valid if buyers fail to defend the zone and strong selling pressure emerges.
---
🧠 Market Psychology
Bulls are building a base at demand, trying to defend this key zone.
Bears are still pressing, evident from repeated rejections at resistance.
This is the “battlefield zone” — whichever side wins will dominate the coming weeks.
---
🎯 Conclusion
0.026 – 0.030 is the make-or-break zone.
Breakout above 0.0373 → potential rally with >100% upside.
Breakdown below demand → risk of decline to 0.019 – 0.01579.
Best strategy: wait for a daily close confirmation before committing to a trade.
---
#SKLUSDT #SKL #CryptoAnalysis #Altcoin #CryptoTrading #PriceAction #SupportResistance #TechnicalAnalysis

Skale SKL price analysis📉 Today, CRYPTOCAP:BTC launched a “red attack” — the daily candle erased the last 3 in a row!
Altcoins are holding surprisingly strong, and #SKL’s price is literally “glued” to the trendline, refusing to give up 😏
No wonder: a trendline break happens either now — with momentum & volume — or the price surrenders to a corrective trend.
📊 OKX:SKLUSDT Plan:
1️⃣ Break and close above $0.054 → only then consider entering a long.
2️⃣ Pullback to ~$0.035 → accumulate positions and aim upward to $0.083 & $0.138.
❓ Could this #SKALE move be fueled by some fundamental news? Share in the comments 👇
🏆 P.S.:
The second corrective wave in alts is often stronger than the first — especially when market sentiment flips to “the pump is over” 😉
⚠️ Disclaimer: This is not financial or investment advice. Opinions are the author’s own. Always DYOR.
________________
◆ Follow us ❤️ for daily crypto insights & updates!
🚀 Don’t miss out on important market moves

SKLUSDT Signals Potential Trend Reversal!SKLUSDT has broken above a long-standing descending Channel resistance on the daily timeframe. This breakout is backed by a noticeable increase in trading volume, signaling renewed buying interest after months of consolidation.
The chart setup indicates a potential shift in market structure from a prolonged downtrend into an accumulation-to-uptrend phase. If the breakout sustains above the $0.027 level, we could see a 50%–125% move in the coming weeks.
Cheers
Hexa

SKLUSDT 1W AnalysisSKL ~ 1W Analysis
#SKL Buy gradually from here with a short -term target of at least 20%+. This is the lowest support for now.

#SKL/USDT#SKL
The price is moving in a descending channel on the 1-hour frame and is expected to continue upwards
We have a trend to stabilize above the moving average 100 again
We have a descending trend on the RSI indicator that supports the rise by breaking it upwards
We have a support area at the lower limit of the channel at a price of 0.02733
Entry price 0.02916
First target 0.03010
Second target 0.03090
Third target 0.03200

SKLUSDT 1WSKL ~ 1W Analysis
#SKL If you still have a Conviction on this coin,. Maybe this support block will be a very good place of buy for now.

#SKL/USDT#SKL
The price is moving in a descending channel on the 1-hour frame and is expected to continue upwards
We have a trend to stabilize above the moving average 100 again
We have a descending trend on the RSI indicator that supports the rise by breaking it upwards
We have a support area at the lower limit of the channel at a price of 0.04324
Entry price 0.04380
First target 0.04482
Second target 0.04622
Third target 0.04775

SKALE Looking ready to fly!I do not use leverage. I am profitable for many years now.
Personally I wouldn't be going long. They have enough liquidity below to sweep already.
I am in a decent position and will definitely be buying more if we go lower.
I do believe an easy 4x is coming for SKL.
Again I would be weary about using leverage at this point of the corrective rally.
NOT FINANCIAL ADVICE!!!

SKALE looking pump ready I've been stackingDefinitely some liquidity to sweep below.
If I was playing with leverage I would wait for lower... Maybe below 0.035?
I only use spot. Targets going all the way above an 4x I believe will be hit.
Again this is a very dangerous time to be jumping into leveraged positions IMO.
NOTHING I SAY IS EVER FINANCIAL ADVICE

Skl time to flipi been looking for this coin for almost 5 years now, ans i see that a flip is comming.
As you can see, rsi is in over sell position, and MACD is shoeing efforts of a big change.
In the chart there are little green points, those are my Buy positions.
I understand that january and February will be greates than november.
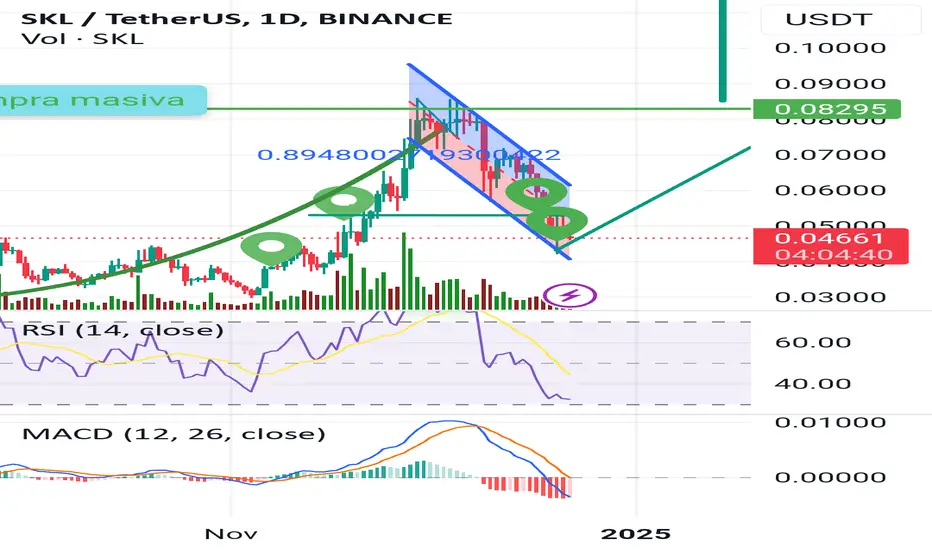
SKL NEXT STOP 0,10$Well guys i drawn the chanel this is going to be masive. We are between 2 ascending lines.
Last time SKL MAKE A 2000% its a 20x from 0,04$ to 1,45$ so impresive. This is the future coin.

#SKL/USDT#SKL
The price is moving within a bearish channel pattern on the 4-hour frame, which is a strong retracement pattern
We have a bounce from a major support area in green at 0.03500
We have a tendency to stabilize above the Moving Average 100
We have a downtrend on the RSI indicator that supports the rise and gives greater momentum, upon which the price is based higher at the discount
Entry price is 0.04100
The first target is 0.04600
The second target is 0.05450
The third goal is 0.06670

SKLUSDT | Patience = ProfitabilityBoth the green line and the blue box are clean areas for ordering, but it would be better to act with the hourly reactions to be received from here. I am alarmed and waiting. There is no need to be FOMO, bull time is the time when there are deep corrections as well as extreme rises. There will be times when our entries arrive when they wonder if the trend is reversing.
Patience = Profitability
I don't overcomplicate things and add a ton of dirty crap to my charts, but you can check out the success of my analysis below.
I approach trading with confidence backed by experience and past success in identifying high-probability setups.
While I don’t claim to be the best, my track record speaks for itself, and I strive to let my analysis and results do the talking. Watch these levels closely—markets can confirm what charts already whisper. Let’s see how this plays out together.
My Previous Ideas
DOGEUSDT.P | 4 Reward for 1 Risk much more if you hold it.
RENDERUSDT.P | HTF Accuracy
ETHUSDT.P | Accurate Buyer Zone Identification | High Risk Reward if you hold it.
BNBUSDT.P | Accurate Buyer Zone Identification | High Risk Reward if you hold it.
Bitcoin Dominance | Great Characteristic Detection and Accurate Analysis

#SKL (SPOT) IN ( 0.03050- 0.04150) T. (0.11300) SL(0.02969)BINANCE:SKLUSDT
entry range ( 0.03050- 0.04150)
Target1 (0.06000) - Target2 (0.07100)- Target3 (0.11300)
SL .1D close below (0.02969)
______________________________________________________________
Golden Advices.
********************
* collect the coin slowly in the entry range.
* Please calculate your losses before the entry.
* Do not enter any trade you find it not suitable for you.
* No FOMO - No Rush , it is a long journey.
Useful Tags.
****************
My total posts
www.tradingview.com
1Million Journey
www.tradingview.com
www.tradingview.com
********************************************************************************************************************** #Manta ,#OMNI, #DYM, #AI, #IO, #XAI , #ACE #NFP #RAD #WLD #ORDI #BLUR #SUI #Voxel #AEVO #VITE #APE #RDNT #FLUX #NMR #VANRY #TRB #HBAR #DGB #XEC #ERN #ALT #IO #ACA #HIVE #ASTR #ARDR #PIXEL #LTO #AERGO #SCRT #ATA #HOOK #FLOW #KSM #HFT #MINA #DATA #SC #JOE #RDNT #IQ #CFX #BICO #CTSI #KMD #FXS #DEGO #FORTH # AST #PORTAL #CYBER #RIF #ENJ #ZIL #APT #GALA #STEEM #ONE #LINK #NTRN #COTI #RENDER #ICX #IMX #ALICE #PYR #PORTAL #GRT #GMT # IDEX #NEAR #ICP #ETH #QTUM #VET #QNT #API3 #BURGER #MOVR #SKL .

SKL Looks BullishFrom where we placed the green arrow on the chart, the rising waves of SKL have started.
Wave A and B seem to be over and now wave C is entering.
The target is a red box.
Closing a daily candle below the invalidation level will violate this analysis.
For risk management, please don't forget stop loss and capital management
Comment if you have any questions
Thank You

SKALE #SKL is positioned nicely versus Ethereumright in accumulation zone
which was a previous launchpad for good gains versus #ETH
can it do it again?
Well odds favour YES
and you have a well defined area/level that if you see skale breakdown on this ratio you can abandon the trade.
But I believe Skale can go on a Run
Gasless Gaming blockchains are very much needed if #Crypto is to succeed in bringing millions of more people into this space.

SKL - Daily more fallSKLUSD has recently experienced a pullback below its crucial support zone, as highlighted in the chart. This movement indicates a potential shift in market sentiment.
Typically, a pullback under a support zone, especially when sustained, can signify weakness and increased selling pressure, hinting at the possibility of further declines.
This breach suggests that buyers are losing control, and if SKLUSD does not reclaim the support zone swiftly, it may continue to trend lower, targeting new support levels.

Could Skale #SKL do a 50X?It's a scaling solution.
It has a big gaming component.
It's a low cap.
all the ingredients necessary for the possibility of delivering outsize gains..
Let's get to the halfway point and assess the likelihood there.

SKL is bearish (1D)SKL's bullish Diametric seems to be over.
Now we are at the end of the G wave of this diametric, which is the last wave of this diametric.
We expect SKL bearish waves to start soon.
We have two important targets on the chart.
Closing a daily candle above the invalidation level will violate the analysis.
For risk management, please don't forget stop loss and capital management
When we reach the first target, save some profit and then change the stop to entry
Comment if you have any questions
Thank You

SKLUSD could be ready to SKALE? (3 Trade setups)Summary:
Three potential trade opportunities as long as Bitcoin price action doesn't ruin the show.
Story:
SKLUSD has been following an upward channel since October 2023 and the recent pullback could be a good buying opportunity to enter or add to your stack. SKLUSD is an active blockchain gaming company that provides fast, gas-free transactions that is constantly engaging in new partnerships. Happy to hear what you all think of this idea.
- Possible 11% gain
- Price action could pop up the $0.1215 resistance
- RSI looks like it could bounce off the yellow dotted horizontal ray or yellow dotted line that identifies RSI lows
- Stoch RSI looks like we could see a move to the upside
- Possible 30% gain
- Price action could pop up to the top of the channel to around $0.14
- RSI looks like it could bounce off the yellow dotted horizontal ray or yellow dotted line that identifies RSI lows
- Stoch RSI looks like we could see a bounce off the support red line to the resistance
- Ambitious 56% gain
- Price action could pop up to the next highest resistance of $0.17
- RSI and Stoch RSI could break the upper resistance line and keep going
- If Bitcoin performs well, this definitely happen down the road.
- No crypto analysis is complete without correlating it with BTC price action. If BTC can maintain staying above the resistance line it broke through in the triangle formation, we could potentially see a move up to test the ATH
- Stoch RSI long look is bullish and as long as we stay above the Stoch RSI support line, good things can happen this year. Notice how the end of the ascending triangle is near the end of the year. Could this be when BTC rips even higher?
