An ABCD BAMM Hints $540B Will Be Added to Small & Mid Cap CoinsThis is total 3 and it tracks the total market cap of all the Cryptocurrencies combined Excluding BTC and ETH and there is currently Hidden Bullish Divergence on the weekly and a potential AB=CD Pattern in development that if it plays out would add around 540 Billion Dollars to the Total 3 market cap taking us to the top of the channel where we may then face a greater reversal.
Smallcaps

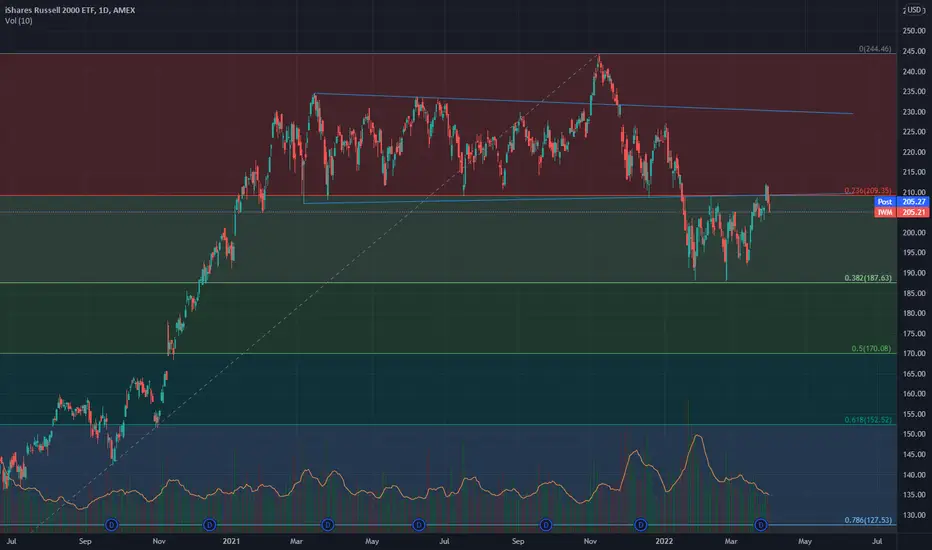
Perfect Retracement for Small Cap Index The Russell 2000 index $IWM retraced and bounced perfectly off the 38% fibonacci level. Actually it bounced twice, which created a double bottom at the 38% retracement level. This strong level of support suggests the bottom may be in and small caps may start to lead the market up again.
New Oriental: A Sleeping Giant. I was attracted to this chart from a Technical Analysis point of view and reward: risk ratio on a potential trade. Price has finally found support at a previous Weekly level after dropping 95% from all time high. It seems as if there is more upside potential than downside potential.
I'm not going to buy here. If I buy, it will be at the fib levels outlined in the chart. A retest would show strength and could incentivise buyers to push volume to the EDU. I'm not sure if I will get that buy but I don't like to chase breakouts. I didn't know about this company until last week.
Reading more about the company and their annual report I was surprisingly impressed. Despite the huge drop in price, the company has actually increased revenue from 2020. They've total assets have doubled from close to five million US dollars in 2019 to 10 million US dollars in 2021. With that said there are some negative components such as decrease in Net Income and Net Profit Margin. Looking at their business model, providers of private education in China, this makes sense. Schools have been massively affected by pandemic.
Some big names have EDU in their portfolio, their largest five holders include Morgan Stanley, Blackrock, Vanguard, Goldman Sachs and Bank of America. According to Yahoo Finance it was also one of Ray Dalio's Bridgewater Associates top ten small cap stock picks. They increased their position size in Q4 by 24%.

Ingersoll Rand India BreakoutThe stock has broken out and retested, therefore may undergo a reversal rally. Trade is supported by Supports Nearby.
Risk Reward Ratio - 2:1
SL is placed below the support zone & the lower trendline. The target is placed near resistance.

KSB BreakoutThe stock has broken out and retested, therefore may undergo a reversal rally. Trade is supported by Supports Nearby.
Risk Reward Ratio - 2:1
SL is placed below the support zone & the lower trendline. The target is placed near resistance.

UFlex BreakoutThe stock has broken out and retested, therefore may undergo a reversal rally. Trade is supported by Supports Nearby.
Risk Reward Ratio - 2:1
SL is placed below the support zone & the lower trendline. The target is placed near resistance.

Credit Access Grameen BreakoutThe stock has broken out and retested, therefore may undergo a reversal rally. Trade is supported by Supports Nearby.
Risk Reward Ratio - 2:1
SL is placed below the support zone & the lower trendline. The target is placed near resistance.

$MULN Continues up on an Uptrend PT $15-$20The electric car company has been making big moves recently and it can be seen in the recent price movement. Looking forward to seeing the progress and keeping a track of this one.

$PYPL Clears the way for a breakout to the Upside PT $200A year after PayPal adopted the crypto market and allowed users to receive and use crypto for goods, PayPal has returned to its Pre-Covid levels that most tech companies have recently returned to after seeing an extraordinary last two years.
Now in a clear uptrend with the stock market and crypto heading back up to breakout levels I anticipate PayPal to follow suite and gain considerable ground over the next few weeks.
My current PT is $180-$200
I've bought May 20th $150 Calls in anticipation of this.
GLTU All

Bullish Dragon with a 1.618 Max Target on SmallCap 600 Value ETFThe Small Cap Value Seems to be in a much better position than the rest of the market and in the case that the market Bullishly Reverses we may see the Small Caps severely Outperform the Indexes. This could lead to the Small Caps making a Minimum 88.6% Fibonacci Retrace from High to Low and a Maximum of a 1.618 Fibonacci Extension before we have the potential for further downside.

GNFC BreakoutThe stock has broken out and retested, therefore may undergo a reversal rally. Trade is supported by brokerage calls and Supports Nearby.
Risk Reward Ratio - 2:1
SL is placed below the support zone & the lower trendline. The target is placed near resistance.

APL Apollo BreakoutThe stock has broken out and retested, therefore may undergo a reversal rally. Trade is supported by brokerage calls and Supports Nearby.
Risk Reward Ratio - 2:1
SL is placed below the support zone & the lower trendline. The target is placed near resistance.

Fine Organics BreakoutThe stock has broken out and retested, therefore may undergo a reversal rally. Trade is supported by brokerage calls and Supports Nearby.
Risk Reward Ratio - 2:1
SL is placed below support zone & the lower trendline. The target is placed near resistance.

GE Shipping BreakoutThe stock has broken out and retested, therefore may undergo a reversal rally. Trade is supported by brokerage calls and Supports Nearby.
Risk Reward Ratio - 2:1
SL is placed below support zone & the lower trendline. The target is placed near resistance.

#KEX#KEX
Adding this low cap Altcoin to portfolio
#midterm #longterm
KIRA is a financial hub connecting decentralized Web3 applications,
enables users to stake tokenized representations of any of their current assets.
Also in Coinbase Ventures portfolio.
CEO @milanavalmont followed bz CZ 😏
•Risk / reward ratio: 1:10
•1-2% from your funds
•Trade TP 1$
•Invest TP 2,6$ - 10$
•Price 0.26$
•M.Cap 8M
#AEX #AscendEX #GATE #Pancake
#VIPSIGNAL

#COVAL#COVAL
Adding this low cap Altcoin to portfolio
#midterm #longterm
Blockchain's FIRST Composite Token
Trade AS MANY Tokens as you want at the Same Time!
Combine multiple assets into a single token. 40% BTC, 20% ETH, 10% LINK, 10% AMPL, 10% ADA making a tradable portfolio.
Or
Create an Emblem Vault that contains one or more pieces of Collectable Art (ERC 721 NFT) along with some Bitcoin.
Recently, Coinbase added COVAL for trading
•Risk / reward ratio: 1:20
•1-2% from your funds
•Invest TP 0.5$-2$
•Price 0.044$
•M.Cap 78M
#Coinbase #Uniswap
#VIPSIGNAL

IWM - Looks like small caps might be in for a bit more hurtThe daily chart from the Covid crash to the peak of the Covid recovery paints a picture of the Russell 2000 that is eerily similar to a textbook sketch of Wyckoff's distribution theory.
For the bulk of 2021 IWM respected a very clear support line that has been crashed through in 2022. Recent price action shows that old support being tested as a new resistance and buyers attempting to push prices through that level were flatly rejected. Furthermore, volume began spiking on drops in price below the 200 day moving average and any movement above it recently was met with anemic volume. This is not the excitement that we've been accustomed to in the small caps of 2020.
The game has changed.
With 1/3 of the Russell (at least) being non-revenue producing speculative companies that were exponentially over-valued during the 2020 bull run, it's hard to imagine that the grounding of the Russell isn't real and that it isn't coming. In today's market, giants like TSLA, AAPL, and MSFT are being dragged down to fundamental value. The small caps aren't immune, unfortunately. What's even worse is that a correction to AAPL's charts isn't as ghastly as some small caps that are trading at tens or hundreds of millions above their quarterly earnings.
The Russell is an important index to watch if one is interested in small cap boomers. It serves as not only a tradable ETF but as a thermometer for the sentiment toward speculation. Right now, it appears that bullish sentiment and risk taking is waning and bearish sentiment is growing. This could lead to a gut wrenching performance for small caps going forward into 2022 and larger drops in former penny stocks that retail investors drove to epic heights in 2020 and early 2021. Many of these companies are still heavily overvalued after 50%+ drops in share prices.
I'd expect volatility in the coming months as tax returns are pumped into these old favorites with the rallying cries of "buy the dip" and "moon next PR" on the breath of most novice investors and traders, especially those who are holding bags likely exponentially higher than current share prices. Once that surge of small money ends I would think that an abysmal summer is approaching for many of these strongholds.
Most of the companies have made lofty promises and many of them have targeted this summer for validation of their business models and strategies. But in the face of generationally high inflation, wars, rate hikes, and supply chain disruptions along with a pandemic that is cyclically impacting humanity, will it matter?
If Mr. Russell is any indication of what is to come, that answer is likely no. Spiking prices will likely be met with hard sell-offs and shorts that start to feel the squeeze will get a layer of protection from the trapped bulls just looking to get their money back out of the markets.
It's not the best of news, but it shouldn't be considering that we aren't in the best of economic situations currently. Of course this is the markets and the markets have a mind of their own. It's wise not to get too caught up in bias and predictions to the point where you are unable to react appropriately and according to your plans.
Good luck out there and God bless!!

$IWM — Potential H&S forming on the 1hr We can either go lower to fill that open gap right off the bat...
or
We're going to go a bit higher to form the second shoulder, creating the H&S with a downside target of $193...
Either way, that gap is filling — not sure if it will today, but likely for next week and for certain before March's 3rd Friday.
The StochasticSlow is looking overbought, and the CCI is hinging lower just under that momentum line — bad sign for the bulls, if you ask me.

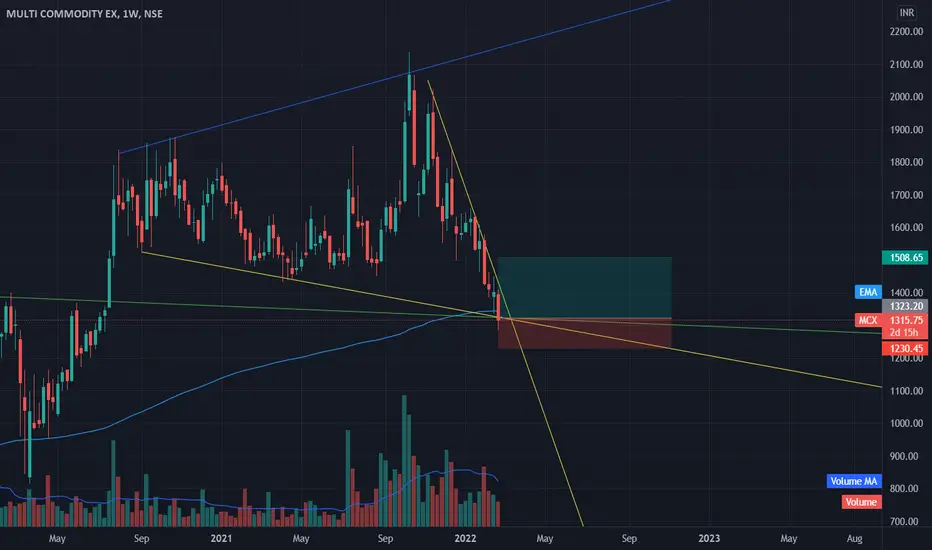
MCX BreakoutThe stock has broken out and retested, therefore may undergo a reversal rally. Trade is supported by brokerage calls and Supports Nearby.
Risk Reward Ratio - 2:1
SL is placed below support zone & the lower trendline. The target is placed near resistance.
Schneider Electric BreakoutThe stock has broken out and retested, therefore may undergo a reversal rally. Trade is supported by brokerage calls and Supports Nearby.
Risk Reward Ratio - 2:1
SL is placed below support zone & the lower trendline. The target is placed near resistance.

XTM - Breach of downtrend and launchTorum attracted a lot of attention once they were listed on KuCoin, pumped to a high and then fell subject to immense selling pressure. I've had my eye on this project for a while and it has been tempting to "buy the dip". Similar to many alts, $XTM has been heavily affected by the #Bitcoin downtrend since 69k and has struggled to regain solid footing in these turbulent market conditions.
On February 7th, XTM broke its downtrend which started on November 19th, for the first time since the 29th of November. Unlike the initial breach in late November, this recent outbreak has shown more strength by successfully retesting the resistance and turning it to support. This shows buying pressure. It makes sense as after the outbreak, XTM had strong hidden bearish divergence and evidence of the MACD crossing over on the 12H time frame. Consequently, we saw a decrease of 34% (at the time of writing 2/18/22).
Why didn't we buy XTM earlier? Why is it a more interesting trade now?
1) I have been looking for strength after the breakout from XTM, which did not happen in late November - early December. Breach of the trendline, no real consolidation and dip.
2) XTM is seeing its support hold better against selling pressure and the initial close of our most recent swing low (.2175) could be a good entry as if it forms a double bottom.
3) XTM has been having a relatively neutral month despite Bitcoin having a good start to February (despite price action in recent days!). Obviously, this lack of price increase is not a bullish sign, but what this along with volume tells me is that selling pressure has also substantially decreased.
4) Too much overall uncertainty in the market.
XTM was recommended to me by a respected peer, who is bullish on the project's fundamentals. As you can see in the chart, I am bullish from a technical analysis point of view. This will all be heavily influenced by the price action of Bitcoin. Torum is a very low market cap cryptocurrency and thus categorically a higher risk choice of investment, please exercise risk management if you choose to invest.
I am not a financial advisor, this is not financial advice. I was encouraged to start posting trading ideas as I have benefitted tremendously from studying the work of others in this community.
I would love to learn more, if there is anything you would like to discuss XTM, other cryptos, stocks, or trade ideas please feel free to leave them in the comment section below.
Have a good weekend,
C

IRB Infra BreakoutThe stock has broken out and retested, therefore may undergo a reversal rally. Trade is supported by brokerage calls and Supports Nearby.
Risk Reward Ratio - 2:1
SL is placed below support zone & the lower trendline. The target is placed near resistance.

IDFC Breakout The stock has broken out and retested, therefore may undergo a reversal rally. Trade is supported by brokerage calls and Supports Nearby.
Risk Reward Ratio - 2:1
SL is placed below support zone & the lower trendline. The target is placed near resistance.
