EURUSD buy opportunity There is a current buying opportunity on the EURUSD to break the previous high and collect more liquidity and fill the large liquidity void resulting from the sharp drop that occurred on September 24th
SMC-ICT

USOIL STRONG DEMAND AREA|LONG|
✅WTI OIL price reacts at demand level, showing signs of absorption with liquidity grabs. ICT model points to bullish orderflow aiming for the nearby target zone. Time Frame: 4H.
LONG🚀
✅Like and subscribe to never miss a new idea!✅

EURUSD Quick Sell tradeCurrently the general trend of EURUSD is upward, but we can sell it from the current levels in order to fill the Liquidity trend line and then continue the rise from the upward OB.

US100 MOVE UP AHEAD|LONG|
✅US100 price is hovering above the demand level after a sell-side sweep, hinting at ICT displacement. If the level holds, Smart Money will likely rotate price upward to rebalance inefficiency and draw liquidity toward 24,640. Time Frame 3H.
LONG🚀
✅Like and subscribe to never miss a new idea!✅

Gold Weekly Outlook (Sept 29 – Oct 3)Hello Traders,
As we head into the final stretch of September, gold is approaching a critical technical juncture. With prices testing a key supply zone and momentum indicators running hot, traders are watching closely for signs of either continuation or reversal. This week could offer important clues about the broader trend heading into Q4. Let’s dive into the levels, catalysts, and scenarios that matter most.
🟡 Gold Summary (XAUUSD)
Current Price: ~3760
Bias: Bearish–Neutral
Catalyst: NFP (Non-Farm Payrolls) this Friday
🔑 Key Levels
Resistance (Supply Zones):
* 3770–3835 → Current ceiling (weekly supply)
* 3895–3945 → Breakout confirmation zone
Support (Demand Zones):
* 3640–3600 → First major demand
* 3560–3510 → Secondary support
* 3480–3430 → Deeper shelf
* 3250–3200 → Long-term institutional demand
🔻 Bearish Scenario (Favored unless breakout occurs)
* Rejection at 3770–3835 → Targets: 3640 → 3560 → 3480
* RSI divergence + stretched EMAs support pullback
🔺 Bullish Scenario
* Break and hold above 3820–3835 → Targets: 3850 → 3895 → 3945
* Weekly close above 3820 = strong continuation signal , opens up possibility of price targeting $4K.
📉 Intraday (H1–H4)
* Structure: Bullish but weakening
* EMAs stretched, RSI diverging
* Tactical rejection at 3775–3795 opens downside
* Breakout above 3795–3820 needed for further upside
⚔️ Decision Point
3760–3785 = Key battle zone
* Rejection → Bearish retrace
* Breakout → Bullish continuation
✅ Strategy: Wait for confirmation. NFP will likely trigger the move.

Short Term Buy on 3749 Mitigation Gold is required to seek discount at 3749 mitigation, thus a short term buy is expected and hits 3772.

USDCHF REBOUND AHEAD|LONG|
✅USDCHF price reacts from demand level, rejecting sell-side pressure. ICT framework highlights bullish displacement, with Smart Money liquidity targets aligning near 0.7995 resistance. Time Frame 2H.
LONG🚀
✅Like and subscribe to never miss a new idea!✅

GOLD LOCAL LONG|
✅XAUUSD price is about to tap the demand level, showing ICT bullish order block reaction. Smart Money seeks short-term liquidity grab toward 3,764$ target zone. Time Frame 30M.
LONG🚀
✅Like and subscribe to never miss a new idea!✅

USDJPY FREE SIGNAL FOR MONDAY|SHORT|
✅USDJPY Price forms a double-top and breaks neckline, signaling bearish order flow. ICT framework suggests liquidity draw into the 149.00 demand area.
—————————
Entry: 149.60
Stop Loss: 150.05
Take Profit: 149.00
Time Frame: 3H
—————————
SHORT🔥
✅Like and subscribe to never miss a new idea!✅

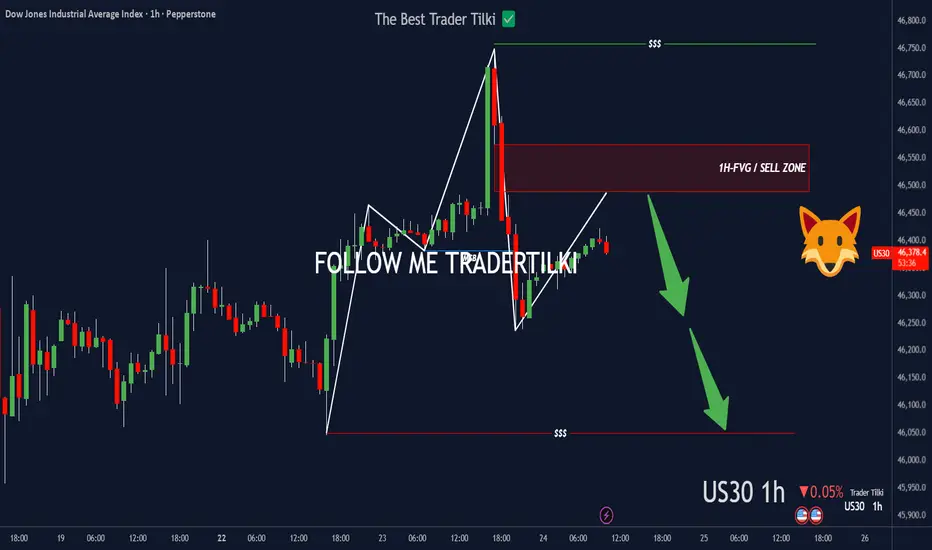
US30 left a footprint—FVG’s callin’.Hey Guys,
Once US30 hits my SELL zone, I’m pulling the trigger—targeting 46049.0
• Entry: 46574.5.0 or 46488.9
Set the stop point according to your own margin, my friends.
Every like you drop pushes me to share more setups like this. Big thanks to everyone showing support!
REAL VS FAKE CHOCK🔹 1. Real Choke vs Fake Choke
A **Choke** in ICT/SMC language usually refers to a **block of price action where liquidity is absorbed** and either the trend reverses or continues strongly. It is connected to the idea of **Order Blocks, IDM (Imbalance-Demand-Mitigations)** and **Liquidity Absorption**.
### ✅ Real Choke
* Happens when **genuine liquidity is absorbed** by institutions (big players).
* Price reacts to the choke level → gives a **clear displacement** in opposite direction.
* Characteristics:
* Strong rejection (impulsive move away).
* Volume & imbalance support the move.
* Leaves behind a valid **IDM / FVG / Order Block**.
* Usually aligns with **higher timeframe POI** (HTF OB, FVG, BPR).
👉 **Effect**: Becomes the base for a **true reversal or strong continuation**.
---
### ❌ Fake Choke
* Happens when price **pretends to absorb liquidity** but it’s just a **stop hunt / inducement**.
* Market sweeps liquidity near choke level → then continues in original direction.
* Characteristics:
* Small/weak rejection, no real displacement.
* No proper imbalance or absorption.
* Often formed just to **trap retail traders** thinking reversal is coming.
* Seen in **mid-range / liquidity inducement zones**, not at HTF POI.
👉 **Effect**: Leads to **continuation in same direction** after trapping liquidity.
---
## 🔹 2. Why IDM (Imbalance Demand Mitigation) is Important
**IDM** is the footprint of institutions when they:
* Absorb liquidity,
* Create imbalance, and
* Mitigate their positions later.
It’s important because:
1. **Shows Institutional Interest** → IDM confirms that Smart Money actually participated.
2. **Validates Choke** → If choke has IDM inside it → higher chance it’s **real**.
3. **Gives Entry Points** → IDM zones often become mitigation levels (precise entries with low risk).
4. **Separates Fake vs Real** → Fake chokes usually have no IDM footprint.
---
## 🔹 3. Role of IDM in Reversal & Liquidity Absorption
When market is reversing:
* First, **retail liquidity is collected** (fake choke).
* Then, institutions place **real choke + IDM** to absorb liquidity.
* The IDM ensures that:
* All **supply/demand imbalance** is cleared,
* Institutions get filled,
* Price is ready for a **clean reversal**.
👉 **In Short:**
* **Fake choke** = liquidity grab.
* **Real choke + IDM** = liquidity absorption + reversal base.
---
⚡So, the easiest filter is:
* If a choke has **IDM (clear imbalance & mitigation footprint)** → it’s **real**.
* If not → it’s just a **fake liquidity sweep**.

Possible retracement in EURUSDThere is a possibility of the EURUSD falling in the event of a break of the 1.17901 level, because the EURUSD has risen since the beginning of the week by more than 80 points, and it is likely to fall today or tomorrow.

NAS100 Buy Entry’s Clean, R:R 2.00 — Setup Locked & Loaded!Hey traders,
Here’s my NAS100 setup based on the 1-hour chart:
🟢 Buy Entry: 23998.77
🔴 Stop Loss: 23884.81
🎯 TP1: 24045.42
🎯 TP2: 24097.67
🎯 TP3: 24225.56
Risk/Reward Ratio: 2.00
Every like you drop is pure fuel for me to keep sharing these setups.
Big thanks to everyone standing by and showing support.

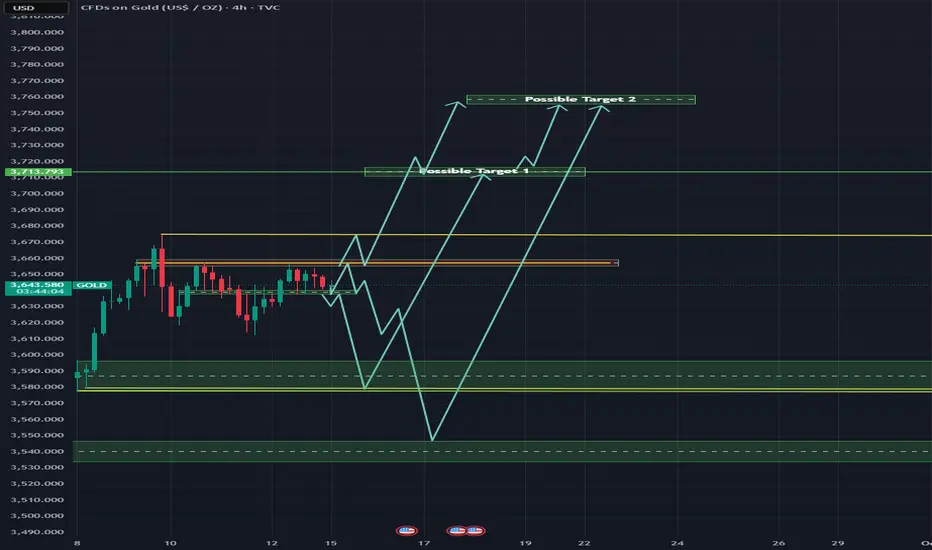
Gold Weekly Outlook ( FOMC Week )Hello traders,
Another week and most importantly its FOMC week
🔸 Weekly Outlook (HTF Bias)
Trend: Bullish, but stretched into ATH zone.
Supply Zones:
3670–3720 (ATH pocket – decision zone)
3770–3800 (extension confluence)
3850–3920 (untouched liquidity cluster)
Demand Zones / Imbalance:
3590–3450 → main corrective magnet (contains EMA50)
3340–3290 → first strong HTF demand
3180–3120 & 3050–2980 → deeper extreme discount demand
Confluence:
EMA stack bullishly locked, but extended
RSI weekly overbought → exhaustion risk
Liquidity pools: above 3674 ATH and below imbalance 3450
Fibonacci: 1.272/1.618 extensions (3750/3880) align with supply above
Scenarios:
Bullish Expansion: Clean breakout above 3670–3720 → targets 3770 → 3850+
Bearish Correction: Rejection from ATH → pullback into 3590–3450 imbalance. A deeper rebalance could test 3340 or lower demand if macro turns hawkish.
🔸 H4 Structure & Trend
Trend: Still bullish (HH–HL), but slowing momentum inside supply.
Active Supply Zones:
3640–3666 → current battlefield (price inside)
3692–3720 → inducement + 1.272 Fib trap zone
3745–3785 → 1.618–2.0 Fib, expansion exhaustion supply
Demand Zones:
3600–3580 → first pullback demand
3544–3520 → EMA50 confluence, BOS origin
3500–3470 → last valid H4 demand before sentiment shift
Confluence:
EMAs locked bullish, but flattening
RSI cooling off → momentum compression
Equal highs below 3666 → inducement
Imbalances on both sides = liquidity-driven moves ahead
Scenarios:
Bullish: Hold above 3600–3580 → breakout above 3666 confirms push toward 3720/3785.
Bearish: Rejection at 3640–3666 or EQH sweep → pullback into 3580/3544, possibly 3500.
🔸 H1 Refined Levels
Premium Sell Zones:
3640–3654 → short-term liquidity wall (first seller defense)
3670–3678 → ATH trap zone (inducement risk)
3704–3720 → exhaustion zone (final upside trap)
Discount Buy Zones:
3595–3580 → first reaction base
3550–3535 → mid-range accumulation shelf
3505–3490 → deep liquidity reload zone (best RR swing entry)
Decision Zone: 3630–3608 → momentum pivot
Above 3630 → bulls in control
Below 3608 → opens reentry demand zones
🎯 Battle Plan
Bullish Play:
Look for rejections from 3595 / 3550 / 3505 with confirmation (M15 BOS or engulfing).
Above 3630 → push toward 3654 → 3674 → 3720.
Break and hold above 3674 → continuation toward 3770+.
Bearish Play:
Tactical shorts at 3654, 3678, 3720 with M15/M30 confirmation.
Targets: 3608 → 3580 → 3550.
Loss of 3490 = HTF correction mode unlocked.
✅ Overall Bias: Still bullish on HTF, but extended. Market is at a make-or-break zone (3640–3674).
⚠️ Risk: RSI overbought + inducement structure = high probability of a liquidity sweep before the real move.
📌 Key Catalyst: FOMC will likely decide whether ATH breaks cleanly or if a corrective flush into imbalance (3450–3590) happens first
EURUSD overview 14-09-2025I am a bit confused as to whether the price will go up after breaking the 1.17008 level or will it reach 1.16520 and then it will be a good area to go up with the orderflow and this is more likely to happen and in case the price reaches this level with the Fed news it will be a very good rise

EURUSD Buy Signal after Tokyo has been sweepedAfter a sweep of liquidity for Tokyo, this level is expected to be protected, and the price will continue its upward trend to reach higher levels and break the previous peak. It is preferable to enter after the price declines and a 15-minute candle closes with a Wick as a rejection signal.

This Aussie Tech Gem Is Screaming BUY – If This Zone Holds!SDR (SiteMinder) is showing massive potential both technically and fundamentally:
- Trading 75.4% below fair value
- Forecasted to grow 65.36% YoY
- Earnings up 28.2% p.a. over the last 5 years
- Analysts expect 91%+ upside
On the chart, we’re sitting right on a high-probability monthly FVG + OB zone. If respected, we could see a strong rally back toward the $6.90–$7.78 buyside liquidity levels and beyond.
Key Levels to Watch:
📍 FVG support: ~$3.50
📈 Targets: $6.90 – $7.78
🧠 Confirmation needed via strong candle closes
🔥 Could be a high-reward play — but as always, DYOR!

Bullish SMT Signal at EURUSD & GBPUSDThere was an SMT signal on EURUSD and GBPUSD. EURUSD was targeting a strong order block, and it broke through the previous low, which acted as an inducement. The SMT provided additional confirmation of the strength and resilience of that order block.

Good sell opportunity on EURUSDIt is possible to sell EURUSD with the aim of targeting the liquidity void on the 15-minute timeframe. I am expecting a liquidity sweep to occur during the previous day's London session.

EURUSD overview on Daily chartEURUSD is likely to fall to retest the uptrend, and there is also a good order block at that level from which the uptrend could potentially resume. However, we should only enter a trade if we see a change of character (CHoCH) signal on the hourly timeframe, as EURUSD is currently in a corrective phase.

NFP Forecastwe might see good bullish movement till reach the Orderflow in the 15min Timeframe
i think with the NFP there will be liquidity run to this ob and then will bounce a little, if the 15min candle closed below this level will be good signal for sell (even during NFP)

DXY | 1SPT directional sentiment (SMC)“DXY moving like it just clocked in for a Monday shift 🥱📉… got smacked with that Friday LQC and now stumbling down to 97.100 like it’s chasing a Black Friday discount 🛒. Daily bias still bearish, 4H looking weak, and on the 1H the bulls tryna flex but only after sweeping some liquidity 🐂➡️🚪.
If price taps back into that chef’s POI kitchen 🍳 and fails to hold, the bears finna drag this straight to the basement 📉🐻. Until then, we vibin’ in discount land waiting for confirmation signals. This POI remains the make-or-break zone 🧩 heading into the next sessions.”**

XAUUSD 30M – Intraday Plan Around the RangePrice is holding between $3,417.84 (resistance) and $3,403.41 (support). We’re trading around $3,410–$3,411 inside a tight box. Scalps can work, but reversals are quick.
🔼 Bullish Plan (needs confirmation)
Trigger: A clean 30min body close above $3,417.84 (not just a wick).
Targets: $3,419.55 → $3,420.54 → $3,422.10.
Management: Take partials at $3,419.55, move SL to breakeven once $3,418 holds on a retest.
🔽 Bearish Plan (cleaner below support)
Trigger: 30min body close below $3,403.41.
Targets: $3,401.29 → $3,398.36 (trail if sellers stay in control).
Management: Scale partials at $3,401.29, protect the rest at breakeven.
🔄 Range Scalp (higher risk, small size)
Shorts: $3,416–$3,417 on a clear rejection → aim $3,410–$3,412, SL above rejection high / $3,420.
Longs: $3,403–$3,404 on a strong rejection wick → aim mid-range, SL below $3,401.
✅ Break Confirmation
Strong 30min close through the level.
❌ Invalidation
Breakout closes back inside the box on the next candle (trap).
Multiple wick with no momentum.
📌 Bottom Line
Above $3,417.84 → bullish bias to $3,420.54 and $3,422.10.
Below $3,403.41 → bearish bias to $3,401.29 and $3,398.36.
Inside the box = scalp only, keep risk tight.
