LiamTrading – XAUUSD H1 | Gold holds 0.618, prioritize ...💛 LiamTrading – XAUUSD H1 | Gold holds 0.618, prioritize bullish scenario for Wednesday 🎯
Gold continues to recover after the previous decline and is currently right at the 0.618 Fibonacci level on H1 – indicating that buyers still hold the advantage. The price is also clinging to the upward trendline and the thick Volume Profile area around 407x, so today I continue to prioritize the BUY scenario following the trend.
📰 Macro – news context
After the US government reopened, the market is preparing to receive a series of economic data today and tomorrow → USD and gold can both fluctuate strongly according to the news.
President Trump attacked Fed Chairman Powell, calling him "stupid and incompetent," expressing that he wanted to fire him immediately but was prevented by advisors.
👉 Therefore, market sentiment is quite sensitive: just a tilt towards a rate cut scenario in the data could further support gold.
📊 Technical – H1 with Fibonacci, Trendline & Volume Profile
Fibonacci 0.618: The price is at the 0.618 level of the most recent decline; if it holds above this level, the natural target will be the FVG area + resistance above 4120–4150.
Upward trendline H1: The trendline from the most recent bottom is supporting the price very well; each touch back to the trendline results in a rebound → this will be an ideal area to wait for a BUY.
Volume Profile & Liquidity:
Cluster 4075–4080 is the Buy Liquidity area – thick volume, many orders exchanged → very suitable as an entry point if the price retests.
VAL ~4040 and the Support + FVG area around 4020 are the next defense lines if the market is swept deeply.
Upside liquidity: The past FVG on H1 is still open to at least 4150, so if the bullish scenario succeeds, gold can fully extend to this area.
🎯 Reference trading scenario (LiamTrading)
1️⃣ BUY following the trend – main priority
Entry: 4078–4080 (retest trendline + strong volume cluster)
SL: 4073
TP: 4094 → 4120 → 4140 → 4175
💡 Note:
Wait for M5–M15 to have a nice reaction candle (long lower tail, pin bar, or bullish engulfing) around 4078–4080 before entering the order.
When the price moves ~1R, move SL to breakeven to protect the account.
2️⃣ Price area for short scalping
Support – quick buy: 4048 – 4023 (VAL + lower FVG area).
Resistance – quick sell: 4121 – 4151 (FVG + upper liquidity area).
This is just a scalping area, so:
Enter orders on small frames (M5–M15).
Close quickly, do not hold orders through strong news.
✅ Summary
Short-term trend: leaning towards bullish, as the price holds above the H1 trendline and the 0.618 area.
Main plan: wait for BUY 4078–4080, target direction 4120 → 4140 → 4175.
Do you think gold will go straight to 4150 today or will it be swept back to 404x first?
👉 Comment your perspective & Follow LiamTrading channel to receive daily XAUUSD plans on TradingView.
Smctrading

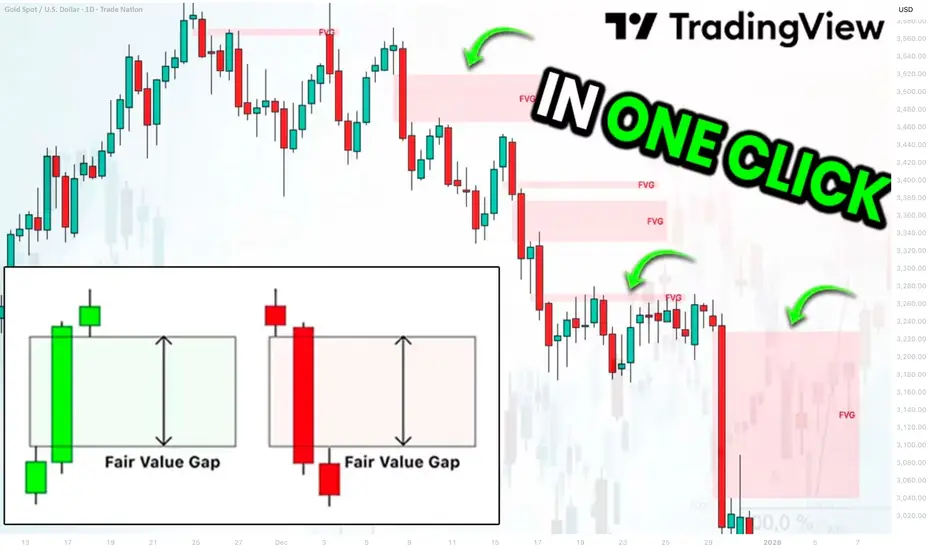
Best Free Fair Value Gap FVG Technical Indicator on TradingView
This free indicator accurately identifies Fair Value Gaps FVG on any market.
It is available on TradingView and it is very easy to set it up.
In this article, I will show you how to use this indicator and how to find a fair value gap easy in one click.
Let's start with my definition of a fair value gap because it is different from trader to trader.
FVG is a sudden, sharp price move that happens so fast that it leaves behind a price zone where very little trading actually occurred.
Because this zone saw almost no trading, it creates an imbalance .
Such a move is usually created by a large candle.
A candle with a big body and almost no wicks.
Among classic Japanese candlesticks, there is one such a candle.
It is called Marubozu.
Here are bullish and bearish structures of that candle.
A green one represents extremely strong bullish momentum. The price opened at the low of the period and closed at the high of the period. There were no pullbacks ; buyers were in complete control from the opening bell to the close.
Its bearish variation has the same logic.
The price opened at the high of the period and closed at the low of the period, with a very little trading activity within.
Our technical indicator will look for such a candle.
The indicator that we will use is called "All Candlestick Patterns".
In the settings of this indicator, we should select Marubozu White (bullish candle) and Marubozu Black (bearish candle).
After we click "OK", the indicator will immediately start working.
The indicator will show valid and significant Fair Value Gaps FVG on any time frame and any trading instrument.
Like any other indicator, it will miss some Fair Value Gaps, but while you are learning to identify them, it will help you to spot the most important ones.
❤️Please, support my work with like, thank you!❤️
I am part of Trade Nation's Influencer program and receive a monthly fee for using their TradingView charts in my analysis.
XAUUSD – HEAD AND SHOULDERS PATTERN FORMING ON H4💛 XAUUSD – HEAD AND SHOULDERS PATTERN FORMING ON H4 🎯
🌤 Overview
Hello everyone, it's Lana here again 💬
Gold, after a strong decline, is forming a clear Head and Shoulders structure on the H4 timeframe, following a long-term upward trendline. This pattern allows us to expect a rebound to the old peak area, but before that, the price may "dip" down to complete the structure.
💹 Technical Analysis (ICT Perspective)
The Left Shoulder – Head – Right Shoulder is gradually completing around the trendline + supporting FVG.
The area around the 50% Fibonacci above is a reasonable zone for the price to form the right shoulder, and if it breaks above the neckline, it could pave the way back to the strong liquidity area above 4200.
In the short term, the 4118–4120 area is both resistance + the neckline of the pattern, suitable for a technical Sell.
The 4040–4042 area coinciding with the trendline + OB is a nice support to watch for a Buy if the price adjusts deeply.
🎯 Reference Trading Plan
💢 SELL Scenario (scalping at resistance)
Sell 4118–4120 │ SL: 4125
TP: 4105 → 4086 → 4060 → 4040
💖 BUY Scenario (priority according to the pattern)
Buy 4042–4040 │ SL: 4034
TP: 4075 → 4090 → 4100 → 4140 → 4200
⚠️ Important Notes
Trading according to the pattern is just an expectation trade, so it should be combined with candle signals on smaller timeframes (M15–M30) before entering a trade.
The upcoming FOMC meeting and NFP report, after a prolonged US government shutdown, could lead to very unpredictable volatility.
Reduce volume, avoid holding large positions through major news events.
🌷 Conclusion with LanaM2
The Head and Shoulders pattern on H4 is opening up beautiful opportunities for both short Sell and Buy according to the larger trend 💛
Be patient and wait for the price to reach the marked areas, be disciplined with SL, and don't FOMO before the news.
If you find this useful, please 💛 Like – 💬 Comment – 🔔 Follow LanaM2 to update the gold perspective with me every day ✨

GOLD Bullish Analysis (SMC)🟦 PROFESSIONAL BREAKDOWN
🔎 1. Market Context
Price creates a strong bearish displacement, leaving a clean FVG unmitigated.
Then a significant ChoCH forms at a demand zone, signaling the first shift in market intention.
🧱 2. Institutional Accumulation Zone
Between the OB-5M and the support zone, we see:
• Consecutive rejections
• Order absorption
• Indecision candles
All of this reveals institutional buyers defending the level.
📉 3. Liquidity Sweep & Manipulation (Fake Out)
Price temporarily breaks below support, generating:
• Sell-side liquidity
• Immediate buy-side absorption
• Clean return into the range
This follows the classic SMC blueprint:
Liquidity → Mitigation → Expansion.
📈 4. Bullish Confirmation
A clean BOS confirms internal bullish structure.
The sequence becomes:
1. ChoCH
2. Liquidity sweep
3. OB mitigation
4. Bullish BOS
5. Expansion towards targets
Perfect institutional flow.
🎯 5. Entry Zone
📍 BUY 4,015
Confluences:
• 5M Order Block
• Strong support zone
• Fake out with absorption
• FVG mitigation
• Structural confirmation (BOS)
🛡️ 6. Stop Loss
📍 SL 3,990
Placed below the liquidity sweep — beyond this level, the idea is invalid.
🎯 7. Take Profits
• TP1: 4,045 → first distribution target.
• TP2: 4,067 → major buy-side liquidity target where institutions offload positions.
🧠 Professional Conclusion
This setup is built on:
✔ Liquidity engineering
✔ Clear structure
✔ Mitigation principles
✔ Institutional rejection
✔ Organic expansion
A high-probability bullish setup, fully aligned with institutional price behavior.
💬 Motivational Message…
“Great traders don’t chase the market — they anticipate it. Trust your process, respect your levels, and execute with confidence. Consistency is built candle by candle.”

LiamTrading – XAUUSD H1 | Gold on a downward trend, hitting...💛 LiamTrading – XAUUSD H1 | Gold on a downward trend, hitting strong support around 4005 🎯
Gold has plunged from its peak, currently “visiting” the 4005–3990 zone, where trendline + POC/OB + large liquidity converge. This is a zone with potential for a technical rebound, but the short-term trend remains bearish, so all BUY orders need clear confirmation.
🔍 Fundamental Analysis
Goldman Sachs forecasts that during 2025–2026, central banks will purchase an average of ~80 tons of gold per month, a significant driver that could propel gold towards $4,900/oz by the end of 2026.
This keeps the long-term trend for gold bullish, but in the short term, deep corrections like the current one are normal to “shake out” positions before big money returns.
📊 Technical Analysis
Current trend:
H1 is still in a short-term downtrend phase (lower high – lower low), with prices below the 4080–4100 resistance zone and the nearest descending trendline.
Main support zones:
4005–3990: intersection of long-term ascending trendline, POC – OB, old VAH/VAL zone → critical support, potential for bottom-fishing buying force.
3975–3977: deeper support, coinciding with liquidity zone & recent bottom.
Key resistance zones:
4098–4100: confluence of resistance + trendline test → prime zone to watch for SELL retracement.
Above is the cluster 4011 – 4053 – 4077 – 4098–4100 acting as “steps” for scalping orders.
Volume Profile:
Heavy trading volume around the 4000–4020 zone → prices tend to revisit this area multiple times before leaving.
🎯 Suggested Trading Scenarios
SELL – following the downtrend (priority)
Entry: 4098–4100
SL: 4105
TP: 4082 → 4060 → 4035 → 4012
Price retraces to resistance + descending trendline.
Only activate when M15–H1 shows clear rejection candles (pin bar/bearish engulfing) around 4098–4100.
BUY – catching the rebound at strong support
Entry: 3975–3977
SL: 3970
TP: 3995 → 4025 → 4050 → 4080
Confluence support zone at channel bottom + POC/OB + liquidity.
Only BUY with strong rejection or clear reversal pattern (M15–H1).
⚠️ Price zones to watch for scalping
4011 – 4053 – 4077 – 3939
These zones are suitable for short scalps, prioritizing the main trend (currently bearish), quick exits – do not hold positions too long.
🧠 Risks & Invalidation
H1 closes above 4105 → reduces SELL priority, wait for new structure.
H1 closes below 3970 → unfavorable structure for BUY side, potential for further decline to lower zones.
Are you watching to BUY or SELL gold in this zone?
👉 Comment your perspective & Follow LiamTrading channel for daily XAUUSD plans.

XAUUSD – TWO MAIN SCENARIOS FOR THE DAY: MONITOR REACTIONS ...💛 XAUUSD – TWO MAIN SCENARIOS FOR THE DAY: MONITOR REACTIONS AT THE TRENDLINE 🎯
🌤 1. Overview
Hello everyone 💬
Gold is currently waiting at the H4 trendline, indicating the market lacks the volume to decide the next direction.
Although the price is adjusting after the drop from the 4,400 USD region, the larger trend is still supported by strong buying flows from central banks.
💹 Market Context
According to Goldman Sachs, the current decline is only temporary, as the demand for gold as a safe haven asset continues to rise:
U.S. bond yields are decreasing
USD is weakening
The U.S. economy is under pressure from unemployment and inflation
In September alone, central banks purchased 64 tons of gold, and forecasts suggest that November may continue the strong accumulation trend.
💹 Technical Analysis
📉 If Gold breaks below the trendline → the market will trigger strong selling pressure, pulling back to the 395x region, where there is low liquidity and significant support.
📈 Conversely, if the price holds the trendline and volume pushes up, a short-term upward structure will form.
📌 The 4068 level is a key point — if the price retests this area and falls back, Buy is only activated when it returns to 4034.
🎯 Reference Trading Scenarios
🔻 SELL – When breaking the trendline (priority if volume is strong)
Sell 4036–4038 │ SL: 4044
TP: 4010 → 3995 → 3970 → 3945
🔹 BUY – Strong support 395x
Buy 3952–3954 │ SL: 3957
TP: 3975 → 3995 → 4030
🔸 BUY to maintain trend (if price rebounds at 4068)
Buy at 4034 after confirmation signal
⚠️ Important Note
Volume is low, the market can easily sweep stops, so enter trades with small volume.
The larger trend is still supported by central bank flows, but in the short term, Gold can fluctuate strongly around the trendline.
Prioritize trading based on price reactions at key areas rather than predicting the direction in advance.
🌷Gold is in a sensitive phase at the H4 trendline 💛
If you find this useful, please 💛 Like – 💬 Comment – 🔔 Follow LanaM2 to receive daily gold analysis ✨

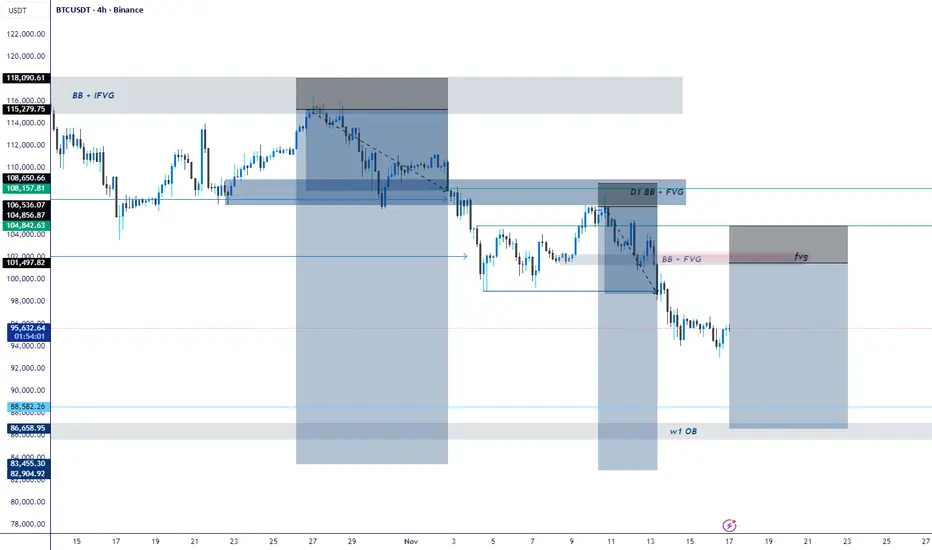
BTC Outlook: Premium Rejections, Clean Drawdown Targets, and KeyBTC continues to respect the higher-timeframe bearish order flow. Price tapped into the Daily Bearish Block + IFVG around the $104K–$108K premium zone, delivered displacement, and broke structure to the downside.
From there, the market formed a clean 3H Supply (BB + FVG) where sellers aggressively re-entered. Price rejected that imbalance and continued the markdown phase.
Structure remains bearish with lower-highs and lower-lows being printed. Current PA is consolidating below key structure, signaling that liquidity is being engineered for the next leg.
We still have an unmitigated Weekly OB at $83K–$86K, which aligns with the macro drawdown target. This zone remains the highest-probability area for a deeper corrective bounce.
K ey Levels
Premium Rejection Zone: $104K – $108K
3H Supply + FVG: $98K – $101K
Immediate Support: $92K – $95K
Major HTF Demand (Weekly OB): $83K – $86K
What I Expect Next
Retracement into the 3H FVG / inefficiency before another sell-off.
Liquidity below $92K likely to be swept.
High-probability macro reaction once price taps the weekly OB.
---------------------------------------------------------------------------------------------------------------------
CONFIRMATION ENTRY (Safer Approach)
Use this for precise execution:
Mark the 3H/1H supply zone.
Wait for price to tap the zone → no instant entries.
Drop to M15/M5 and wait for a clear CHOCH (shift) or BOS confirming sellers.
Enter on the pullback into the refined OB or FVG.
SL above the M5 POI that caused the break.
First TP at relative equal lows or clean inefficiencies.
This keeps you out of premature entries and filters manipulation.
LiamTrading – XAUUSD H1 | Continue to watch for SELL at the ...LiamTrading – XAUUSD H1 | Continue to watch for SELL at the start of the week – wait for price to retrace to the trendline & resistance for a perfect entry
Gold is experiencing a sharp decline as the global market faces liquidity pressure. The simultaneous drop in gold, stocks, and Bitcoin indicates that money is being pulled out of risky assets and even safe havens, similar to tense periods like the 2008 crisis or the early 2020 pandemic. Investors are selling profitable assets to cover losses elsewhere.
In the long term, gold typically recovers sooner, but in the short term, the downtrend still prevails.
On H1, the price is below the descending trendline, under the 4100 resistance, and is moving in a clear Lower High – Lower Low structure. This is a good signal to continue prioritizing SELL orders retracing to resistance.
🔍 Technical Analysis (Trendline • S/R • Fibonacci • Liquidity)
The descending trendline is the biggest barrier; each time the price touches the trendline, it is strongly rejected.
Main Resistance:
4098–4100: resistance zone + confluence with trendline.
4120–4130: stronger zone if price retraces deeply (close to Fibo 0.382).
Target Support:
4065: intermediate support – where the price has bounced slightly several times before.
4040 – 4025: large liquidity zone – confluence with the bottom of FVG H1.
3985–3995: the end zone of the down wave if selling pressure expands.
Liquidity Zone:
Many liquidity sweep bottoms continuously → indicating selling pressure still prevails.
The lower FVG zone (around 4025–4040) is highly likely to be filled this week.
📉 Trading Scenario (prioritize SELL retrace)
Scenario – SELL retrace to trendline + resistance (priority)
Entry: 4098–4100
SL: 4106
TP: 4088 → 4065 → 4040 → 4025
💡 Suggestion: Wait for M5–M15 to form a rejection candle (pin bar / bearish engulfing) before executing the order.
When to BUY?
Only BUY if:
H1 closes a candle above 4120, breaking the descending trendline → short-term trend phase change.
If this signal is not present → do not rush to buy against the trend.
⚠️ Important Note
The phenomenon of “selling everything to hold cash” may continue → gold may continue to face pressure in the short term.
Which price zone are you watching for today's session?
Comment below & Follow LiamTrading channel for the fastest updates!

XAUUSD – WEEKLY SESSION SCENARIO UPDATE 💛 XAUUSD – WEEKLY SESSION SCENARIO UPDATE 🎯
🌤 Overview
Hello everyone 💬
Gold prices at the start of the week remain mostly unchanged, the price structure on H4 is intact, so Lana continues to maintain the old trading strategy.
Currently, gold is weakly reacting around the mid-term resistance zone, not strong enough to break through – but also without clear reversal signals.
💹 Technical Analysis
📉 Price is moving within a narrow range between key liquidity zones:
Zone 4138–4140 is the nearby resistance, where the market has repeatedly reacted downwards.
Zone 4200 coincides with confluence fibo + descending trendline – strong resistance.
Zone 3990–3988 is a crucial support, also a lower liquidity area, suitable for technical rebound Buy.
Market liquidity is weak, reflected in the wicks and narrowing range.
🎯 Reference Trading Plan
💢 SELL (priority on adjustment rhythm)
4138–4140 | SL: 4146 | TP: 4120 → 4105 → 4089
4200 | SL: 4212 | TP: 4185 → 4160 → 4133
💖 BUY (strong support)
3990–3988 | SL: 3984 | TP: 4002 → 4032 → 4060
⚠️ Market Insight (Macro Insight)
Gold declines alongside US stocks and Bitcoin, indicating a lack of liquidity across the market.
This behavior is common during phases like:
2008 Financial Crisis
Early 2020 pandemic panic
Investors are forced to sell profitable assets to cover losses, causing gold – even as a safe haven – to decline. This reflects a strong increase in cash demand and widespread fear.
🌷 Conclusion with LanaM2
Gold is moving within a tight range and heavily reliant on liquidity 💛
If you find this useful, please 💛 Like – 💬 Comment – 🔔 Follow LanaM2 for daily gold analysis ✨

LiamTrading – XAUUSD H1 | Two scenarios for the new weekLiamTrading – XAUUSD H1 | Two scenarios for the new week: waiting for reactions at 4100 & Fibonacci zone – prioritizing bullish trades when the market recovers
Gold is completing a technical rebound after a sharp drop, and H1 is showing two clear scenarios for the new week. The medium-term trend remains a downward correction, but on H1, the price is in a recovery phase, so bullish trades will be prioritized – as long as the lower liquidity zones are maintained.
The key this week lies at 4100, the confluence of FVG, Fibonacci, and liquidity – this is the decisive point to see if gold will bounce up or continue to fall deeply.
🔍 Technical Analysis (Fibonacci • Trendline • Liquidity • Volume Zone)
Fibonacci H1: The price may recover to Fib 0.5 (~4140–4150) – a zone with high liquidity & likely to trigger a bearish reaction.
Fib 0.382 (~4120–4130) is currently the first short-term resistance.
Price Structure: The medium-term downtrend still exists, but H1 is creating a recovery wave → prioritize buying when the price pulls back at the support zone.
The descending trendline is still controlling the market. If it breaks the trendline + holds above 4130–4150 → the uptrend is more strongly confirmed.
Important liquidity zones:
4100: liquidity confluence + previous bullish resistance → strong reaction zone.
4085 and 4060: liquidity bottoms – if breached, will trigger a deep decline scenario.
4032: FVG + Fibonacci bottom – the "break or hold" zone for buyers.
Key resistance this week: 4161 – 4187 – 4138 – 4111
📈 TRADING SCENARIOS FOR THE NEW WEEK
Scenario 1 – Bullish trade (priority)
Logic: Gold is recovering; if it holds 4100 and pulls back strongly → target is the upper Fibonacci zone.
Entry: 4100–4111
SL: 4090
TP: 4138 → 4161 → 4187
Suggestion: Wait for strong signals like a pin bar or H1 engulfing to confirm the recovery bottom.
Scenario 2 – Bearish trade (when the market fails to hold the bottom)
Logic: If gold breaks the H1 bottom and retests 4100 without holding → the medium-term downtrend continues to activate.
Entry: 4100–4108 (retest after break)
SL: 4120
TP: 4085 → 4060 → 4032
Suggestion: Only enter when H1 closes below 4100.
🌍 Macro Analysis – Fed disrupts the market
According to the latest data from CME Watch:
54.1% chance Fed holds rates steady at 375–400 bps
45.9% chance Fed cuts rates
The ratio is almost balanced → the market is very uncertain, creating unpredictable volatility ahead of the 10/12 meeting.
In this environment, gold often reacts strongly to unexpected news, so prioritize trading at liquidity zones – wait for clear confirmations.
⚠️ Invalidation Conditions
Price closes below 4060 → fully prioritize bearish trades.
Price closes above 4161 → strong bullish trade activated, discard all sell setups.
What scenario are you preparing for the new week?
Comment & hit Follow on the LiamTrading channel to receive the earliest analysis every day!

XAUUSD – H4 SCENARIO FOR THE WEEK 17–21/11💛 XAUUSD – H4 SCENARIO FOR THE WEEK 17–21/11 🎯
🌤 1. Overview
Hello everyone, it's Lana here again 💬
The new week begins with a narrowing trading range on the H4 chart, signaling that gold is gearing up for a stronger move. The current medium-term trend needs to break the descending trendline above to confirm the buyers' return.
💹 Technical Analysis
📉 The end-of-week downtrend is entering a technical rebound phase, and there's a high possibility it still has room to continue declining around the 4000 trendline – where it converges with a strong liquidity zone.
🟣 Key price levels to watch include: 4138 – 4200 – 4212 – 4037. These are liquidity concentration points, expected to have clear reactions based on market sentiment.
🔹 Traders can use Fibonacci retracement to time their sell entries, combined with confirmation signals on smaller time frames (M15–M30).
🌐 Macro Context
The financial market is facing difficulties as U.S. tax policies change continuously, putting pressure on both Gold and Bitcoin.
The end of the year is also a characteristic phase of the economic slowdown cycle, where the market tends to adjust more strongly.
🎯 Reference Trading Scenario (Reference Trading View)
Prioritize selling according to the technical rebound, especially when the price enters confluence zones of Fibo + liquidity.
Consider buying only when the price reacts strongly at the 4000 trendline or the 4037 area.
🌷 6. Conclusion with LanaM2
Gold is in a zone preparing for a big move 💛
Be patient and wait for reactions at key liquidity zones to have a better and safer entry point.
If you find this useful, please 💛 Like – 💬 Comment – 🔔 Follow LanaM2 to receive daily gold analysis! ✨

LiamTrading –XAUUSD H1|Gold approaches trendline – ready to...LiamTrading –XAUUSD H1|Gold approaches trendline – ready to explode, waiting for a breakout to choose direction!
Gold is moving close to the lower trendline of the ascending channel, indicating an accumulation state – waiting to choose direction. The price has not broken the 4210 resistance zone, but neither has it breached the trendline, so today's fluctuation will revolve around this structure.
If the buying force is strong enough and closes the H1 candle above 4210, the upward trend will be reactivated with a broader target. Conversely, if the price breaks below the trendline, gold may fall to the POC area according to Volume Profile/Fibonacci around 4126–4130, where it will prioritize finding buy signals according to the main trend.
🔍 Technical Analysis (Volume Profile • Trendline • S/R • Fibonacci)
H1 Ascending Channel: Price is testing the trendline for the second time → a pullback bounce is likely if the selling force is weak.
Strong Resistance:
4210: hard resistance – needs to break to confirm an increase.
4230: extended area, coinciding with the channel peak – likely to have strong reactions.
Important Support:
4174: intermediate support; breaking this level will trigger a short-term decline.
4126–4130: POC + large liquidity according to Volume Profile – the best buying area if a deep correction occurs.
Market Signal: Weak candles in the 4180–4190 area indicate gold is waiting for USD information before making a move.
📈 Daily Trading Scenarios
Scenario 1 – Buy according to trend (priority)
Entry: 4126–4128 (POC + Volume Profile support)
SL: 4120
TP: 4140 → 4156 → 4180 → 4198
Suggestion: Wait for a rejection candle or reversal pattern at 412x.
Scenario 2 – Sell when breaking trendline (counter-trend)
Condition: H1 breaks below trendline + retest fails
Entry: 4174–4176
SL: 4182
TP: 4150 → 4135 → 4110
Note: Only sell when there is a confirmation candle; this is a short-term scalping order.
Scenario 3 – Buy when breaking and holding above 4210 (Break & Retest)
Entry: 4212–4216
SL: 4202
TP: 4230 → 4260 → 4285
🌍 Macro Analysis – USD under pressure from new tariff plans
President Trump is preparing to cut tariffs on goods from many Latin American countries (beef, bananas, coffee...).
Objective: reduce domestic food prices, lower import costs.
This could weaken the USD when officially announced → gold benefits in the medium term.
⚠️ Invalid Conditions
H1 closes below 4120 → loses upward structure, may slide to 4090–4100.
H1 closes above 4230 → cancel all sell orders, prioritize buying on breakout.
Which price area are you observing?
Please comment below & hit Follow on LiamTrading channel to receive the earliest analysis every day!

XAUUSD – H1: PRIORITIZE BUYING WITH PRICE CHANNEL, WATCH FOR...💛 XAUUSD – H1: PRIORITIZE BUYING WITH PRICE CHANNEL, WATCH FOR ADJUSTMENTS 🎯
🌤 Overview
Gold is maintaining its upward channel on H1 → main strategy: hold Buy longer than Sell.
The Asian–European sessions show multiple liquidity clusters suitable for scalping and optimizing entry points.
Fundamentals: DXY retreats around 99.15, market reduces expectations of Fed rate cuts in December; Fed Collins hints rates may remain unchanged longer → gold's range may experience short-term fluctuations.
💹 Technical (ICT view)
The H1 upward channel maintains a structure of higher lows; the lower trendline is the main support.
4163–4165: confluence of trendline + liquidity (ideal Buy entry point).
4130–4133: deeper support; below that is the 4100–4080 zone (medium-term support; around Fibo ext 1.618 ≈ 4114 and 2.618 ≈ 4054).
Nearby resistance: 4215–4225; a decisive break opens up to 4260.
🎯 Trading Plan Reference
Buy #1 (priority): 4163–4165 │ SL 4157 │ TP 4180 → 4195 → 4220 → 4260
Buy #2 (deeper support): 4130–4133 │ SL 4125 │ TP 4150 → 4175 → 4190 → 4220
Sell (only with confirmation):
Scenario A: M15/M30 gives strong rejection signals at 4215–4225 → SL 4230 │ TP 4200 → 4188 → 4165.
Scenario B: H1 closes below 4157 (breaks structure) then retests unsuccessfully → target 4135 → 4115 → 4100.
⚠️ Risk Management Notes
Prioritize Buy according to trend; Sell orders are only short-term reactions.
Use M15/M5 to time entries in the specified zones.
If H1 closes below 4125, consider narrowing Buy positions, wait for the 4100–4080 zone.
🌷 Conclusion
The H1 upward channel still guides the flow of funds 💛. Patiently wait for adjustments to 4163–4165 or 4130–4133 to buy according to the trend, manage orders tightly as prices approach 4215–4225.
If useful, please 💛 like – 💬 comment – 🔔 follow LanaM2 for daily gold updates ✨

GBP-CAD Free Signal! Sell!
Hello,Traders!
GBPCAD is tapping into a horizontal supply area after a strong bullish move, where premium pricing aligns with potential distribution. Smart money could drive a corrective phase next.
--------------------
Stop Loss: 1.8548
Take Profit: 1.8495
Entry Level: 1.8520
Time Frame: 2H
--------------------
Sell!
Comment and subscribe to help us grow!
Check out other forecasts below too!
Disclosure: I am part of Trade Nation's Influencer program and receive a monthly fee for using their TradingView charts in my analysis.

XAU/USD 13 November 2025 Intraday AnalysisH4 Analysis:
-> Swing: Bullish.
-> Internal: Bullish.
Analysis and bias remains the same as analysis dated 20 October 2025.
Price has printed as per previous intraday expectation by printing a bearish CHoCH which indicates, but not confirms, bullish pullback phase initiation.
Price is currently trading within an established internal range, however, I will continue to monitor price with regards to depth of pullback.
Intraday expectation:
Price to continue bearish, react at either discount of 50% internal EQ, or H4 supply zone before targeting weak internal high priced at 4,380.990.
Note:
The Federal Reserve’s sustained dovish stance, coupled with ongoing geopolitical uncertainties, is likely to prolong heightened volatility in the gold market. Given this elevated risk environment, traders should exercise caution and recalibrate risk management strategies to navigate potential price fluctuations effectively.
Additionally, gold pricing remains sensitive to broader macroeconomic developments, including policy decisions under President Trump. Shifts in geopolitical strategy and economic directives could further amplify uncertainty, contributing to market repricing dynamics.
H4 Chart:
M15 Analysis:
-> Swing: Bullish.
-> Internal: Bullish.
Price did not print according to my analysis. Price instead targeted strong internal high by printing a bullish iBOS.
This could potentially indicate H4 bearish pullback phase is complete.
Price has since printed a couple of bearish CHoCH's, however, I will not mark them as such due to very insignificant depth of pullback.
Intraday expectation:
Price to indicate bearish pullback phase initiation by printing a bearish CHoCH. CHoCH positioning is demoted with a blue horizontal dotted line.
Note:
Gold remains highly volatile amid the Federal Reserve's continued dovish stance, persistent and escalating geopolitical uncertainties. Traders should implement robust risk management strategies and remain vigilant, as price swings may become more pronounced in this elevated volatility environment.
Additionally, President Trump’s tariff announcements, particularly against China, are expected to further amplify market turbulence, potentially triggering sharp price fluctuations and whipsaws.
M15 Chart:

Bullish Analysis XAU/USD (Gold) 15M -SMC-📈 Breakdown…
1. Market Context
The market created a clear consolidation zone earlier in the session. This type of price behavior usually builds both sell-side and buy-side liquidity, preparing the next directional move.
After consolidation, price delivered a CHoCH followed by a BOS, confirming a shift in market structure and signaling bullish intention.
2. Liquidity Map
Price swept the Buy-Side Liquidity above the previous highs, creating a Fake-Out and trapping breakout traders.
This liquidity grab is typical before a deeper pullback into a discount zone, allowing institutions to accumulate long positions.
3. Mitigation Zone (Point of Interest)
Price retraces into a 15-minute Order Block aligned with a support zone.
This area represents your optimal entry zone, where the market likely mitigates institutional orders.
BUY level at 4,194 is perfectly positioned inside this zone.
4. Entry, Stop Loss & Risk Management
• Buy: 4,194
• Stop Loss: 4,172
• R/R: 1:2
The SL is set below the OB and structural low, keeping the trade protected while respecting the model.
5. Expected Reaction & Bullish Expansion
From the mitigation zone, we anticipate:
1. Rejection
2. Internal redistribution
3. Bullish expansion into higher liquidity
This aligns with institutional price delivery, as price usually creates a final internal correction before taking external highs.
6. Target (TP)
TP: 4,245
This target aligns with:
• Buy-Side Liquidity above previous highs
• A clean inefficiency zone
• Expected continuation model
This is a logical liquidity pool where institutions may off-load positions.
✅ Summary
✔ Liquidity sweep
✔ Market structure shift
✔ Mitigation in OB-15M
✔ Clean R/R
✔ Professional projection into liquidity
GOOD LUCK TRADERS 🫡🔥🖤

XAU/USD 11 November 2025 Intraday AnalysisH4 Analysis:
-> Swing: Bullish.
-> Internal: Bullish.
Analysis and bias remains the same as analysis dated 20 October 2025.
Price has printed as per previous intraday expectation by printing a bearish CHoCH which indicates, but not confirms, bullish pullback phase initiation.
Price is currently trading within an established internal range, however, I will continue to monitor price with regards to depth of pullback.
Intraday expectation:
Price to continue bearish, react at either discount of 50% internal EQ, or H4 supply zone before targeting weak internal high priced at 4,380.990.
Note:
The Federal Reserve’s sustained dovish stance, coupled with ongoing geopolitical uncertainties, is likely to prolong heightened volatility in the gold market. Given this elevated risk environment, traders should exercise caution and recalibrate risk management strategies to navigate potential price fluctuations effectively.
Additionally, gold pricing remains sensitive to broader macroeconomic developments, including policy decisions under President Trump. Shifts in geopolitical strategy and economic directives could further amplify uncertainty, contributing to market repricing dynamics.
H4 Chart:
M15 Analysis:
-> Swing: Bullish.
-> Internal: Bearish.
You will note how price remains contained in consolidation between a supply and demand zone. The rest of my analysis and bias remains the same as bias date 29 October 2025.
As expected, price has printed a bullish CHoCH to indicate bullish pullback phase initiation.
Price is now trading within an established internal range.
Intraday expectation:
Price to continue bullish, react at either premium of internal 50% EQ or M15 demand zone before targeting weak internal low, priced at 3,886.465.
Note:
Gold remains highly volatile amid the Federal Reserve's continued dovish stance, persistent and escalating geopolitical uncertainties. Traders should implement robust risk management strategies and remain vigilant, as price swings may become more pronounced in this elevated volatility environment.
Additionally, President Trump’s tariff announcements, particularly against China, are expected to further amplify market turbulence, potentially triggering sharp price fluctuations and whipsaws.
M15 Chart:

Bullish Analysis – XAU/USD 15M)- (SMC)📍 New Target: 4,180
🧩 Market Context..
Gold shows a clear accumulation phase after a long consolidation.
Following the ChoCh (Change of Character) and BOS (Break of Structure), the market confirms bullish intent, with institutional orders defending the support/OB zone around 4,113.
The fake out sweeps downside liquidity before rejection and a new bullish expansion toward Buy-Side Liquidity.
💥 Trade Plan
• Entry: 4,113
• Stop-Loss: 4,096
• First TP: 4,139
• Second TP: 4,155
• Final Target: 4,180
• Risk/Reward: 1 : 2.5
The projection shows OB mitigation, followed by distribution, and a final expansion phase toward the resistance zone at 4,180, which represents the institutional liquidity target.
📊 Technical Confirmations
• ChoCh and BOS confirm bullish structure shift.
• OB rejection and SMA 25 acting as dynamic support strengthen the setup.
• TP zones align with liquidity pools and potential distribution levels, where a correction could begin.
🧭 Conclusion
This setup perfectly follows the institutional cycle:
Accumulation → Mitigation → Distribution → Expansion.
The 4,180 target marks a key liquidity sweep and likely completion of the bullish leg.
A precise, high-probability setup with institutional confluence. 🚀
GOOD LUCK TRADERS 🦾😎☝🏻

GOLD ANALYSIS BASED ON REAL SMART MONEY ORDERS (11/10/2025)💛 Welcome to Trade with DECRYPTERS! ( 11/10/2025)
Your trusted source for Smart Money insights, Real-Time Levels & Market Direction.
Let’s decode what’s driving GOLD this week 👇
#GoldSurge #GoldPrice #SafeHaven #PreciousMetals #CentralBankBuy #USDIndex #GoldTrading #GlobalMacro #USChinaTrade #FedWatch #MarketPulse #TradeWithDecrypters
📊 Market Pulse
Gold surged +1.85% to $4,074.92/oz on Nov 10, 2025, rebounding sharply from Friday’s ~$4,000 close.
This move came amid US-China trade talks, geopolitical tensions, and reduced Fed rate-cut expectations — fueling another wave of safe-haven demand.
💹 DXY (~100.20) ticked higher but capped further gains as traders weighed mixed Fed signals and trade optimism.
🏦 Central Banks continued heavy accumulation, with Q3 2025 demand hitting 1,313 tonnes ($146 B) — led by China’s 11th straight month of buying and Poland’s diversification push.
These flows continue to support prices even as the dollar firms.
🌍 Geopolitics & Safe-Haven Demand
⚔️ U.S.–China tensions + Mideast conflicts are boosting gold’s safe-haven appeal.
📈 ETF inflows stand at +619 tonnes YTD, while physical bar & coin demand jumped +17% YoY to 316 tonnes in Q3.
Investors remain defensive, building exposure across multiple gold-linked assets as volatility picks up.
🔎 What to Watch Next
📅 Nov 12 – U.S. CPI Report (~3.0% core expected)
→ Hotter data = Fed pause → short-term pressure on gold
📅 Nov 13 – U.S. PPI & Jobless Claims
→ Softer labor data = higher rate-cut odds → bullish for gold
⚡ Bonus Triggers:
Any U.S.–China trade breakthroughs or Middle East escalations could spark quick volatility spikes off nearby support zones.
🧭 Technical Framework (Smart Money Map)
💰 Current Price: ~$4,075 (+1.85% / 24h)
📉 Volatility Range: $4,020 – $4,100
Smart Money Sell Area: $4,080 – $4,100
→ Institutional resistance cluster – watch for rejection
Scalp Sell Zone: $4,050 – $4,065
→ Ideal for short-term liquidity fades
Scalp Buy Zone: $4,020 – $4,030
→ Minor bounce region
Smart Money Buy Pool: $3,980 – $4,000
→ Key accumulation zone for institutional bids
🎯 Conclusion – Bullish Bias with Pullback Risks
Gold’s strong rebound shows safe-haven and central-bank support still dominate, even as DXY limits upside.
Trend bias remains bullish, but expect controlled pullbacks within the current consolidation.
📊 Above $4,100 → targets $4,200 +
📉 Below $4,020 → tests $3,980–$4,000 buy zone
💬 Trade Smart — Trade with DECRYPTERS ⚡
Gold surge, safe-haven demand, central-bank buying, USD index, U.S.–China trade, Fed rate-cut expectations, geopolitical risk, ETF inflows, physical bullion, Smart Money map.

XAU/USD 10 September 2025 Intraday AnalysisH4 Analysis:
-> Swing: Bullish.
-> Internal: Bullish.
Analysis and bias remains the same as analysis dated 20 October 2025.
Price has printed as per previous intraday expectation by printing a bearish CHoCH which indicates, but not confirms, bullish pullback phase initiation.
Price is currently trading within an established internal range, however, I will continue to monitor price with regards to depth of pullback.
Intraday expectation:
Price to continue bearish, react at either discount of 50% internal EQ, or H4 supply zone before targeting weak internal high priced at 4,380.990.
Note:
The Federal Reserve’s sustained dovish stance, coupled with ongoing geopolitical uncertainties, is likely to prolong heightened volatility in the gold market. Given this elevated risk environment, traders should exercise caution and recalibrate risk management strategies to navigate potential price fluctuations effectively.
Additionally, gold pricing remains sensitive to broader macroeconomic developments, including policy decisions under President Trump. Shifts in geopolitical strategy and economic directives could further amplify uncertainty, contributing to market repricing dynamics.
H4 Chart:
M15 Analysis:
-> Swing: Bullish.
-> Internal: Bearish.
You will note how price remains contained in consolidation between a supply and demand zone. The rest of my analysis and bias remains the same as bias date 29 October 2025.
As expected, price has printed a bullish CHoCH to indicate bullish pullback phase initiation.
Price is now trading within an established internal range.
Intraday expectation:
Price to continue bullish, react at either premium of internal 50% EQ or M15 demand zone before targeting weak internal low, priced at 3,886.465.
Note:
Gold remains highly volatile amid the Federal Reserve's continued dovish stance, persistent and escalating geopolitical uncertainties. Traders should implement robust risk management strategies and remain vigilant, as price swings may become more pronounced in this elevated volatility environment.
Additionally, President Trump’s tariff announcements, particularly against China, are expected to further amplify market turbulence, potentially triggering sharp price fluctuations and whipsaws.
M15 Chart:

Improving My Win Loss Ratio In Forex TradingWell, Some good news, actually great news. The experiment worked and in this video I show how I am improving my win loss ratio in Forex trading.
From a disastrous Win Loss ratio using only SMC now with combining the classical school along with the Stochastic I have been nailing it for the past 20 days with 22 trades and 8.6% increase on my balance.
In many cases, especially with advantageous RRR, it is Ok to have the win loss ratio in favor of the Loss, as the RRR will compensate and the balance would increase, but in this case I have the win rate higher and the RRR if it was calculated is also higher.
I depend on opening multiple trades and closing them all at once once they hit an acceptable percentage. In the video I said I will close them around 2%, but to tell you the truth, even if it was 1% I would close because no business I know of would bring 1% profit in a day.
The concern now with this Forex Trading Plan is that it does not use Stop Loss nor Take Profit. I feel that I am hanging in the air, which is not a good feeling and this might get me inside an emotional imbalance in the long run.
Still, the test is going on to evaluate all that.

why Us100 will Target 25800why Us100 will Target 25800
Order Flow Legs in 15 M Chart
Swing Low
CHOCH
FVG
