PreferForex Analysis on CADCHFCADCHF is in Bullish bias according to the higher time frame. Now it is heading toward a short term POI. Expecting further bullish after taping on the POI
Smctrading

📆🚀Exciting Next Week Planning! 📈💰 Trade USDCAD up and down!📆🚀 Exciting Next Week Planning! 📈💰
Get ready for some thrilling opportunities in the upcoming week! 🌟 Let's dive into the details and explore the potential of USDCAD, a ranging market with a range height of 160 to 200 pips. 📊💹
🔥 Ranging Market Analysis:
USDCAD is expected to trade within a range, offering opportunities for both long and short positions. This type of market environment can be advantageous for running Expert Advisors (EA) to potentially earn passive income. 💵💼
💼💹 Earning Passive Income:
By utilizing EA strategies, you can automate your trading and potentially generate income without constantly monitoring the market. This allows you to focus on other aspects of your life while your EA takes care of the trading operations. It's like having a dedicated trading assistant! 🤖💸
✨ Take Advantage of the Range:
With a range height of 160 to 200 pips, there is significant potential to capture profits during price oscillations within this range. It's crucial to set appropriate entry and exit points based on your trading strategy and risk tolerance, maximizing your chances of success. 📈🎯
🌟💪 Stay Informed and Adapt:
As with any trading endeavor, it's essential to stay informed about market developments, news events, and technical analysis. Keep an eye on key support and resistance levels, as they can provide valuable insights for your trading decisions. Remember, adaptability and continuous learning are key to success in the dynamic world of trading. 📚📰
🚀💰 Embrace the Opportunities:
Get ready to seize the potential of USDCAD's ranging market and leverage the power of EA trading to earn passive income. Plan your strategies, set your targets, and be prepared to take action when the right opportunities arise. The next week holds exciting prospects for traders! 💪💹💼
#NextWeekPlanning #USDCAD #RangingMarket #EATrading #PassiveIncome 🌍💱

ICT Long setup HK50, Daytrade📈💰 Day Trading Strategy on HK50 💱
🔥 Key Levels and Setups to Watch Out For 🔥
Let's explore an exciting day trading strategy with key levels and setups to keep an eye on! 🚀💹
⬆️ Buy Limit Levels:
🎯 16476
🎯 16450
🎯 16424
🎯 Take Profits:
TP1: 16416
TP2: 16424
🔑 Key Level - Support:
🛡️ 16475
❌ Stop Loss:
🛑 16400
💡 Trading Insights:
Today's trading strategy focuses on key levels and potential setups. The buy limit levels of 16476, 16450, and 16424 offer entry opportunities to join the market.
To maximize gains, consider setting take profit levels at 16416 and 16424. These targets can help secure profits as the trade progresses.
Keep a close eye on the crucial support level at 16475, as it may act as a significant turning point or provide additional buying opportunities.
To manage risk effectively, it is essential to set a stop loss at 16400. This will help limit potential losses and protect your trading capital.
Remember, analyze the market carefully, adapt your strategy as needed, and trade responsibly. Best of luck! 💪💹📈
#HK50 #DayTrading #TradingStrategy #KeyLevels #StopLoss #TakeProfit 🌍💱

EURUSD longs to take out 4H BSLQEXPECTATION: EURUSD on the 4H has made an iBOS. After an internal BOS we expect an internal pullback. There was no 4H supply mitigation, so I am expecting the BSLQ to get swept first, to then facilitate the pullback into 4H demand.

Analyze EURUSD in the M15 timeframe using the SMC method4H Swing is bearish => current is pullback up
M15 Swing is bearish => current is pullback
=> We can sell to the bottom of the swing weak

GOLD: Potential SELL OPpotunity (Harmonic BAT Pattern)Beautiful Harmonic has completed the D leg in a Potential Supply + OB, expecting a push to the downside. SL above SUPPLY zone.

EURGBP: Insights into Current Market Dynamics (Top Down)Right! I will keep it simple. EURGBP on the weekly timeframe currently resides within a DEMAND zone, indicating the possibility of an upward movement in price from this region. Additionally, on the daily timeframe, price has shown rejection at a supportive level. Furthermore, the hourly chart has transitioned from a bearish to a bullish stance, while the 45-minute structure also presents a bullish outlook. In light of these indicators, it is anticipated that price action will likely find support at the marked demand area as depicted on the chart. Goodluck!

USDCHF Analysis of PreferForexUSDCHF is in Bullish market Structure. It is now in retracing movement. Expecting the continuation of bullish moment after taping into the POI

EURNZD Analysis of PreferForexEURNZD is heading towards the POI. It moves down by collecting the liquidity and finally it is in the bottom of the swing point.

Preferforex Analysis on USDCADUSDCAD is heading toward the bottom of the recent swing point. We will observe the price when it tap on the POI, expected a bullish move from the POI

XAUUSD, waiting for intraday ICT Short setup Plan to trade on February 16
🔥 XAUUSD SELL zone 2020 - 2022
🔹SL 2025
🔹TP 2010 - 2000
XAUUSD H4 and Higher Timeframe in Downtrend 💵💵💵
Yesterday retraced up back to Fib. level 50% to 2008.25
So we are looking forward and M15 and H1 ICT short setup for trading.
Key Level target is 1993.6
Supply Zone 2008.2 to 2022.2
Demand Zone 1985.7 to 1922.4

EURUSDWaiting for the next leg of price to go short on EURUSD. There might be a bounce on 1.07440 to continue the sell. But overall that might form a liquidity to get early sellers in the market.

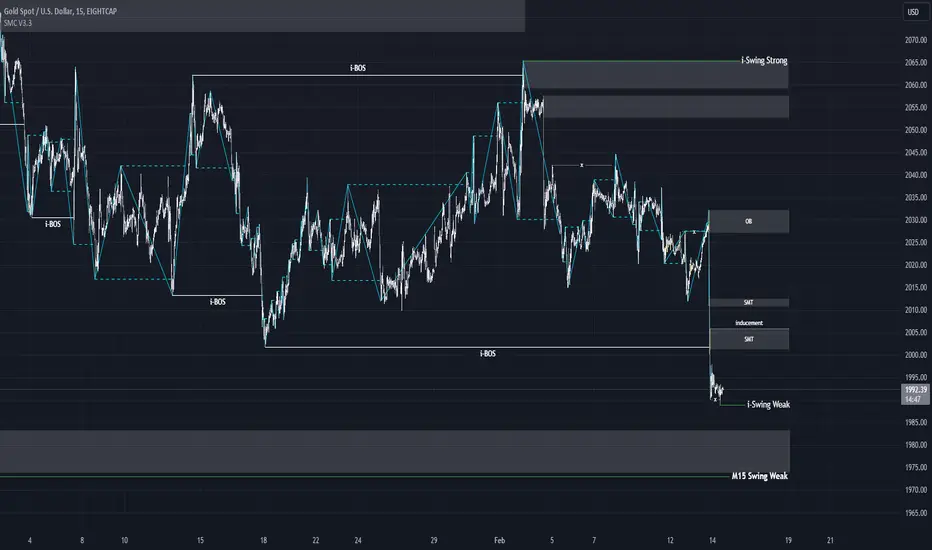
Analyze XAUUSD in the M15 timeframe using the SMC methodAnalysis of XAUUSD in the M15 timeframe using the SMC method
4H is bullish => currently is pullback dow
M15 is bearish => currently pullback up
We sell down when we reach the order block
GOLD: Will price fill the imbalance of 1983 region? Gold rejected at 2078 and dropped down to 2030 where it had some correction in the price movement. Today price touched $2050 and from that area we saw a strong selling pressure, if price do continue to drop, we may see it hitting 2020$ key level first and then 2000$ key level will be our second area of exiting the trade. Though 1980$ is our final target.
Second scenario is where we might see price filling the buy side price void area in the region of 2065$ if that is the case then it would likely to occur after the news volatility kicks in tomorrow.
So what do you think about gold future?

GBPJPY wave structure at 4H, 15M timeframeDay is uptrend => current is correction
4H is uptrend => current is correction
15M is dowtrend
Current price is in the demand zone of the 4H, Daily time frame.
There is a high possibility that the price will increase again.
To confirm the price increase again, we wait for the price to surpass the strong swing top of the 15M time frame

Wave structure of AUDUSD in time frame M15HAPPY NEW YEAR!
4H is uptrend => current is internal bearish
M15 is uptrend => Currently it is breaking through a strong low swing and turning into a downtrend
We can sell down to the Order block of the 4H time frame

Analyze EURUSD in the M15 timeframe using the SMC method4H Swing is bearish => current is pullback
M15 Swing is bearish => current swing is CHoCH up
=> We can buy when the price drops again

CADCHF Bearish Opportunity - Orderblock SMC FVG📉 CADCHF Bearish Trade Setup - Notable Orderblock SMC FVG Identified
🔍 Technical Analysis:
CADCHF presents a compelling bearish opportunity as it approaches the Orderblock SMC FVG zone.
Historical analysis suggests this area has served as significant resistance in the past.
Monitoring closely for potential bearish confirmation signals.
📊 Trade Plan:
Entry Point: Consider initiating a short position upon rejection or bearish confirmation within the Orderblock SMC FVG zone.
Stop Loss: Place above recent swing high to effectively manage risk.
Take Profit: Targeting potential support levels or prior lows.
🚨 Risk Management:
Employ sound risk management techniques, ensuring exposure is controlled.
Stay updated on economic events impacting CAD and CHF.
📈 Disclaimer:
This is not financial advice. Perform due diligence and trade responsibly.
👉 Note: Continuously monitor price action for real-time adjustments.
Happy Trading! 🌐💹


GOLD on HTF Hello! Traders hope you enjoying your weekend.
This is what I see on Higher Time Frame. Hope it will help !!!
So we shouldn't look for longs on HTF.
yeah but on our LTF we will have more opportunities on zig zags. ;)

US100 17486.5 +0.34 % SHORT IDEA MTF 🐻🐻🐻HELLO TRADERS
Hope everyone is doing great 🛑
A look at NASDAQ ahead of the day 📌
NASDAQ 4H TF
* Looking at US100 from the 4H we see a break above BSL
* FULL BODY closure above possibly signaling continuation.
* If we see momentum back into the range i would be looking for shorts.
* But for now NASDAQ is signalling some strong BULLISH momentum.
* Especially because of that body closure.
US 100 1H TF
* On the 1h alike, strong bullish momentum in play.
* Retracement into some of the internal LIQUIDITY possible.
* looking for some retracement into PD ARRAYS ( FVG + OB)
* & should they hold looking for continuations with the bulls.
NASDAQ 15 M TF
* ASIAN highs taken
* Possibly signaling a bullish NY
* TRADE IDEA
1. london open - short setup for asian lows
2. long set-ups NY session.
HOPE YOU ENJOYED THIS OUT LOOK, SHARE YOURS BELOW🛑
lets see how it goes.
IF THIS IDEA ASSISTS IN ANY OR IF YOU LIKE THIS ONE
SMASH THAT LIKE BUTTON & LEAVE A COMMENT.
ALWAYS APPRECIATED
____________________________________________________________________________________________________________________
* Kindly follow your entry rules on entries & stops. |* Some of The idea's may be predictive yet are not financial advice or signals. | *Trading plans can change at anytime reactive to the market. | * Many stars must align with the plan before executing the trade, kindly follow your rules & RISK MANAGEMENT.
_____________________________________________________________________________________________________________________
| * ENTRY & SL -KINDLY FOLLOW YOUR RULES | * RISK-MANAGEMENT | *PERIOD - I TAKE MY TRADES ON A INTRA DAY SESSIONS BASIS THIS IS NOT FINACIAL ADVICE TO EXCECUTE ❤
LOVELY TRADING WEEK TO YOU!

DXY 103.413 - 0.11 % SHORT IDEA MTF 🐻🐻🐻HELLO TRADERS
Hope everyone is doing great 🛑
A look at DXY ahead of the day 📌
DXY 4H TF
* Looking at DXY from the 4H we see a break above BSL
* Swept BSL but traded back into the range with some bearish momentum.
* If we see momentum back into the range i would be looking for shorts.
* Looking for some short ideas on the dxy.
* Especially because of that body closure back into the range.
DXY 1H TF
* On the 1h alike, strong bearish momentum in play.
* Retracement into some of the internal LIQUIDITY .
* looking for some retracement into PD ARRAYS ( FVG + OB & balance price range)
* & should they hold looking for continuations with the bears.
DXY 15 M TF
* ASIAN LOWS taken.
* Possibly signaling a bearish NY SESSION.
* TRADE IDEA
1. london open - bullish setup for asian highs
2. short set-ups NY session.
HOPE YOU ENJOYED THIS OUT LOOK, SHARE YOURS BELOW🛑
lets see how it goes.
IF THIS IDEA ASSISTS IN ANY OR IF YOU LIKE THIS ONE
SMASH THAT LIKE BUTTON & LEAVE A COMMENT.
ALWAYS APPRECIATED
____________________________________________________________________________________________________________________
* Kindly follow your entry rules on entries & stops. |* Some of The idea's may be predictive yet are not financial advice or signals. | *Trading plans can change at anytime reactive to the market. | * Many stars must align with the plan before executing the trade, kindly follow your rules & RISK MANAGEMENT.
_____________________________________________________________________________________________________________________
| * ENTRY & SL -KINDLY FOLLOW YOUR RULES | * RISK-MANAGEMENT | *PERIOD - I TAKE MY TRADES ON A INTRA DAY SESSIONS BASIS THIS IS NOT FINACIAL ADVICE TO EXCECUTE ❤
LOVELY TRADING WEEK TO YOU!

NZDJPY SHORT - Orderblock SMC FVGNZDJPY Short Trade Setup - Eyeing Orderblock SMC FVG
🔍 Technical Analysis:
NZDJPY is showing potential for a short trade as it approaches the Orderblock SMC FVG zone.
Historical analysis suggests this area has acted as significant resistance in the past.
Monitoring for potential bearish signals.
📊 Trade Plan:
Entry: Consider shorting upon rejection or bearish confirmation within the Orderblock SMC FVG zone.
Stop Loss: Place above recent swing high to manage risk effectively.
Take Profit: Targeting support levels or previous lows.
🚨 Risk Management:
Employ proper risk management strategies.
Stay informed about economic events affecting NZD and JPY.
📈 Disclaimer:
Not financial advice. Conduct own analysis. Trade responsibly.
👉 Note: Monitor real-time price action for adjustments.
Happy Trading! 🌐💹
