XAUUSD – LANA TRACKS MEDIUM-TERM WAVE 5 TOWARDS ATH REGION 4360 XAUUSD – LANA TRACKS MEDIUM-TERM WAVE 5 TOWARDS ATH REGION 4360
1. Fundamental Analysis
In the geopolitical context, President Putin continues to reiterate the conditions for a ceasefire between Russia and Ukraine. The possibility of a peace agreement remains open, but the tough statements indicate that the conflict risk cannot end soon. This keeps gold as a medium-term safe-haven asset.
On the other hand, in the US, Mr. Trump continues to emphasize the view that the stock market will continue to reach new highs and even mentions the possibility of abolishing most income taxes, replacing them with revenue from tariffs. These statements foster a "risk appetite" sentiment on stocks and the USD, creating a certain tug-of-war with gold in the short term.
In summary, Lana sees gold in the next 1–2 weeks still leaning towards a medium-term uptrend, but it is easy to see fluctuations as the market continuously re-evaluates geopolitical risks and policy expectations from the US.
2. Technical Analysis
The D1 frame is showing the Elliott wave 5 structure in the medium-term uptrend phase. Wave (4) has completed at an important support area, accompanied by a market structure shift (MSS) signal reversing upwards, paving the way for wave (5).
Using Fibonacci extension, the theoretical target for wave (5) can reach the 2.618 region around 4360, which is also a strong psychological resistance and near the ATH area – a region very prone to large profit-taking by buyers.
Along the way, the 4246 mark is an important resistance area:
If the price decisively breaks and closes the D1 candle above 4246, the uptrend will be more strongly confirmed, indicating that buyers are willing to push the price to new highs.
The downtrend line has been breached, then the price returned to test and bounced up, showing that buying power is regaining the advantage. The price retracing around the trendline & the 4133–4139 area will be an opportunity for Lana to find a buying point in line with wave 5 with a better R:R ratio.
3. Price Areas to Watch
Important resistance / medium-term profit-taking area:
4240 – 4246: intermediate resistance, needs to be broken to strengthen the uptrend.
4360: Fibonacci 2.618 region & potential ATH area of wave 5.
Support / potential buying area:
4133 – 4139: price area near the trendline, where Lana prioritizes watching for buying if a correction appears.
4124: technical stop-loss mark, below this area the short-term wave structure may weaken.
4. Trading Scenario
Buy 4133 – 4139
SL: 4124
TP: 4240 – 4280 – 4350
👉 Follow Lana on TradingView to read the earliest gold analyses. 💛
Smctrading

XAUUSD – LANA AWAITS CONTINUED BUYING IN THE UPWARD PRICE ...XAUUSD – LANA AWAITS CONTINUED BUYING IN THE UPWARD PRICE CHANNEL
1. Fundamental Analysis
Gold is maintaining its upward momentum as investors continue to monitor the Russia-Ukraine tensions and the conflicting peace signals.
President Putin's statements suggest that peace proposals could be the foundation for an agreement, but Russia is still ready to continue fighting if conditions are not suitable. This scenario creates a mixed risk state, reducing the short-term demand for safe havens while retaining geopolitical uncertainty that could pressure the USD in the medium term.
In this context, Lana prioritizes the scenario where gold continues in an upward trend, taking advantage of technical corrections to large liquidity areas to find opportunities to buy with the trend, rather than FOMO at high prices.
2. Technical Analysis
On the H1 chart, XAUUSD is moving in a clear upward price channel, currently near the channel's average line. The main trend remains upward, with no signals of structural break.
After a strong bullish candle, the market left a Strong Liquidity area just below, also creating a Gap below the channel – this is the area where Lana expects the price to return for a test before continuing upward.
The Buy zone coincides with the strong liquidity area around 4,166–4,167 (near the lower boundary of the price channel), suitable for a strategy of waiting for a correction and then buying continuation.
Using Fibonacci extension, key levels:
1.618: around the current price area – a temporary pause and accumulation zone.
2.618: area 4,210 – where Lana marks as Sell scalping for a short correction.
3.618: around 4,235 – 4,237 – a stronger Sell zone, likely to see significant profit-taking.
Level 4,155 is a critical boundary: if the price breaks down and holds below this area, Lana will stop prioritizing the long-term buying scenario, as the upward channel structure risks being broken.
3. Price Levels to Watch
Support / Buy zone & strong liquidity:
4,166 – 4,167 (near the middle line descending to the lower boundary of the channel)
The area around 4,155 is the boundary for the medium-term upward trend.
Resistance / Fibo extension & Sell zone:
4,210 – 4,213: Sell scalping area according to Fibonacci 2.618.
4,235 – 4,237: Strong Sell zone according to Fibonacci 3.618, near the upper boundary of the price channel.
4. Trading Scenarios
Buy 4166 – 4167
SL: 4160
TP: 4182 – 4195 – 4210 – 4250
Sell 4210 – 4213
SL: 4218
TP: 4200 – 4185 – 4160 – 4145
Sell 4235 – 4237
SL: 4243
TP: 4212 – 4200 – 4185 – 4160
👉 Follow Lana on TradingView to read the earliest articles. 💛

Bullish Analysis gold-SMCPROFESSIONAL BREAKDOWN
Step-by-step analysis – Gold (XAUUSD)
1. Initial accumulation + Buy-Side Liquidity
Price consolidated and built buy-side liquidity above previous highs—classic institutional preparation for expansion.
2. ChoCH + BOS confirming bullish intention
After sweeping liquidity, market structure shifted with a ChoCH followed by a BOS, validating the bullish scenario.
3. Perfect Fake Out + Precision POI
A clean manipulation (fake out) pushed sellers in, then price returned perfectly into our POI at 4,129, where we executed the entry.
4. Protected RR 1:4
Stop loss placed at 4,103, maintaining a disciplined 1:4 R/R exactly according to plan.
5. 4H FVG mitigation + Clean expansion
Price reacted beautifully and continued to fill the 4H FVG, fueling the bullish expansion.
6. TPs being hit one by one
• First TP – 4,171 ✔️
• Second TP – 4,202 ✔️
• Third TP – 4,230 ⏳ Just a couple pips away…
7. Expected mitigation at the HH
We’re approaching the final Higher High mitigation, the completion of the institutional target.
GREAT JOB TRADERS.. 🫡🖤

Gold H1 – Will 4212 Hold and Drop to 4160 Today?🟡 XAUUSD – Intraday Smart Money Plan | by Ryan_TitanTrader (27/11)
📈 Market Context
Gold is currently trading within a rising institutional channel after strong H1 displacement. The market is compressing into a liquidity-rich consolidation phase — a classic Smart Money trap environment before engineered expansion.
What Smart Money desks are targeting today:
• Expectation of USD strength shaping bearish bias
• Liquidity sweeps above internal range highs
• Consolidation fakeouts to induce retail mis-positioning
• CHoCH/BOS confirmation required before real directional move
The chart shows equal liquidity zones positioned at premium (sell opportunity) and discount (re-entry buy region).
🔎 Technical Framework – Smart Money Structure (H1)
Current state = Accumulation / Redistribution phase
Liquidity map highlighted zones:
• Premium liquidity zone: 4212 – 4214 (target for short trap)
• Discount liquidity origin zone: 4165 – 4163 (higher timeframe demand re-entry)
• Equilibrium / Chop zone: 4180 – 4195 (no trade unless displaced)
• Trendline support: ~4173 region (must break for downside continuation)
Expected sequence:
Sweep → CHoCH/MSS → BOS → Displacement → Retest (FVG/OB) → Expansion
🎯 Trade Plans for Today
🔴 SELL GOLD 4212 – 4214 | SL 4222
Thesis: Liquidity sweep at premium highs before bearish displacement
Entry activation rules (must wait):
• Price taps 4214 liquidity pocket
• Bearish CHoCH/MSS + BOS down on M5–M15
• Entry taken at FVG fill or order block retest after BOS
Targets:
1. 4200 (first reaction)
2. 4187 – 4185 (BOS retest zone)
3. 4170 (channel mid-equilibrium)
4. 4165 – 4163 (H1 demand retest / profit core)
🟢 BUY GOLD 4165 – 4163 | SL 4143
Thesis: Discount origin tap for impulse continuation buy
Entry activation rules (must wait):
• Price sweeps into 4163 pool
• Bullish CHoCH/MSS + BOS up on M5–M15
• Strong bullish rejection wick + FVG fill confirmation
Targets:
1. 4185 – 4187 reclaim zone
2. 4200+ institutional expansion target
3. 4212+ premium revisit
⚠️ Risk Management
• Avoid trading inside 4180 – 4195 unless displaced
• Do NOT interpret sweeps as trend entries — they are traps
• SL = structure invalidation, no averaging in consolidation
• Reduce size during monetary headlines unless MSS confirms
📝 Summary
Gold is currently in engineered liquidity mode. Expect either:
• Sweep 4214 → MSS/BOS down → drop into 4163 discount retest,
or
• Tap 4163 → bullish MSS/BOS up → expand toward 4200 – 4212+
Today = confirmation-based execution only, not trend chasing.
📍 Follow @Ryan_TitanTrader for daily Smart Money updates.

XAUUSD – H2: Discount zone has formed, just waiting for the ...XAUUSD – H2: Discount zone has formed, just waiting for the price to pull back to continue buying up
On the H2 frame, gold just had a strong break up to the 4.180+ zone after a period of narrow range compression. At the end of the week, coinciding with Thanksgiving, I only prioritize waiting for an adjustment to the discount zone to buy up, absolutely not chasing the price at the peak.
🎯 MAIN SCENARIO – BUY THE DIP AT FIBO & POC ZONE 4.163–4.160
Buy entry: 4.163 – 4.160
SL: 4.155
TP: 4.178 – 4.195 – 4.220
⭐️ ALTERNATIVE SCENARIO – BUY DEEP AT VAL ZONE + STRONG SUPPORT 4.139–4.136
Buy entry: 4.139 – 4.136
SL: 4.130
TP: 4.150 – 4.172 – 4.190 – 4.220
The total risk for each scenario I always keep within the range of 1–2% of the account.
Basic context
End of the week + Thanksgiving ⇒ thin liquidity, easy to shake at the end of the session.
Messages from Trump & credit data show the economic picture and the December interest rate path are not really clear.
This keeps gold still having a defensive role, but not enough basis to expect a straight upward move – so I prioritize trading according to technicals and specific price zones.
Technical analysis H2
Market sentiment & trading plan
After the break, the buyers are holding momentum, but the price moving sideways at the high zone shows the market is partially taking profits, waiting for liquidity.
Thin liquidity easily creates sweeps to the support zone before turning around, that's the move I want to take advantage of.
Plan:
Prioritize Buy at 4.163–4.160, only consider the 4.139–4.136 scenario if the price is deeply sold off.
All orders have a hard SL (4.155 and 4.130), do not widen the stop.
Take partial profits, move SL in a favorable direction as the price approaches TP levels.
If you find the analysis useful, follow TradingView and leave a comment about the price zone waiting for entry – I always read feedback to optimize future posts.

XAUUSD – SHORT-TERM TREND UNCLEAR, WAIT FOR PRICE TO REACH ...XAUUSD – SHORT-TERM TREND UNCLEAR, WAIT FOR PRICE TO REACH LIQUIDITY ZONE
1. Fundamental Analysis
In today's session, gold is maintaining a slight correction after hitting the highest price level in nearly two weeks. Market risk sentiment is somewhat more positive, with funds temporarily moving away from safe-haven assets, weakening demand for gold and prompting short-term profit-taking.
However, dovish expectations from the Fed continue to keep the USD weak, which is a foundational factor that could support gold in the medium term. Lana views the current phase primarily as a technical correction, prioritizing waiting for the price to reach important liquidity zones before taking action.
2. Technical Analysis
The H1 chart shows that after a strong upward move, the price is pausing and a confirmation down move is appearing from the resistance zone above. An upward trendline still supports the structure, indicating the larger trend has not been broken, but the upward momentum is slowing and the market is shifting to a state of hesitation. Below, the FVG demand zones around 4113–4111 and deeper at 4085–4088 act as liquidity zones where Lana expects buyers might return. Above, the 4194–4196 zone is a significant resistance, coinciding with the supply and liquidity zone above, suitable for a corrective Sell scenario if the price retests.
3. Price Zones to Watch
Upper Liquidity / Strong Resistance Zone:
4194 – 4196
Lower Liquidity / Support & FVG Zone:
4113 – 4111: first demand zone, near the upward trendline.
4085 – 4088: lower FVG zone, stronger support if a deeper correction occurs.
4. Trading Scenarios
Sell 4194 – 4196
SL: 4200
TP: 4175 – 4160 – 4122 – 4105
Buy 4113 – 4111
SL: 4105
TP: 4133 – 4155 – 4170 – 4190
Buy 4085 – 4088
SL: 4080
TP: 4095 – 4110 – 4133 – 4150 – 4185
👉 Follow Lana on TradingView to read the earliest gold analyses. 💛

Gold H1 - Can Gold reject 4167 and fall to 4133 today?🟡 XAUUSD – Intraday Smart Money Plan | by Ryan_TitanTrader (27/11)
📈 Market Context
Gold is trading inside an intraday consolidation after a strong H1 displacement. The session is now primed for liquidity engineering before the next leg.
Key narrative drivers traders must respect today:
• Stronger USD expectations continue to shape risk sentiment
• Institutional desks frequently exploit sweep zones during consolidation
• Range-bound conditions favor fakeouts → displacement → expansion mechanics
• Headlines around U.S. monetary tone amplify intraday volatility
The current chart highlights balanced liquidity both above and below structure, supporting a two-way SMC playbook.
🔎 Technical Framework – Smart Money Structure (H1)
Market is holding a rising channel, but internally ranging — a typical liquidity map scenario:
• Buy-side liquidity pocket: 4180 → 4182 (premium extreme)
• Sell-side liquidity pool: 4110 → 4133 (discount extreme / origin zone)
• Internal equilibrium zone: 4150–4170 chop region (no-trade area)
We expect this sequence:
Sweep → CHoCH/BOS → Displacement → Retest → Expansion.
🎯 Trade Plans for Today
🔴SELL GOLD 4180–4182 | SL 4190
Thesis: Premium liquidity sweep above local highs before downside displacement.
Activation rules:
• Price sweeps 4182 liquidity
• Bearish CHoCH/MSS + BOS down on M5–M15
• Imbalance retest / FVG entry after structure break
Targets:
• 4167 (nearest reaction)
• 4150 (equilibrium raid)
• 4135–4133 (discount retest)
🟢 BUY GOLD 4135–4133 | SL 4125
Thesis: Sell-side liquidity sweep into the origin zone before upside impulse.
Activation rules:
• Price taps 4133 pool (sweep below structure)
• Bullish CHoCH/MSS + BOS up on M5–M15
• FVG fill / bullish rejection wick confirmation
Targets:
• 4155+
• 4167 (reclaim zone)
• 4180+ (premium raid target)
⚠️ Risk Management
• Do NOT trade inside 4150–4170 without clear displacement
• Wait for CHoCH + BOS before execution
• Treat the upper and lower zones as liquidity traps, not trend entries
• Reduce size during news spikes unless structure confirms
• SL = wave invalidation, no averaging in chop
📝 Summary
Gold is in accumulation/redistribution mode. Desks may:
• Run buy-side liquidity at 4182, then displace down → retest discount
or
• Sweep sell-side liquidity at 4133, confirm CHoCH up → expand with impulse
Today is a liquidity session, not early trend chasing. Execute only after confirmation.
📍 Follow @Ryan_TitanTrader for daily Smart Money updates.

XAUUSD – Gold scenario awaiting trend confirmation at the 4...XAUUSD – Gold scenario awaiting trend confirmation at the 4,160–4,170 zone
Currently, gold has not shown a clear enough medium-term trend. The price is fluctuating around an important resistance zone, so instead of predicting the market, I wait for price reactions at key zones before making a decision.
Today's main axis is the 4,160–4,170 zone – where the market will choose to continue the upward trend or start a deeper correction.
🎯 Scenario 1 – SELL AT RESISTANCE 4,162–4,165 (PREFERRED IF NO CLEAR BREAKOUT)
Sell: 4,162 – 4,165
SL: 4,173
TP: 4,140 – 4,122 – 4,110 – 4,100
The 4,162–4,165 zone on H1 is resistance coinciding with fibo + supply zone near the old peak, also close to the short-term uptrend line.
If the price hits this zone and shows signs of weakening (upper shadow, reversal candle, unsupported volume), I prefer to sell short down to the 4,140 zone, deeper possibly to the liquidity cluster around 4,110–4,100 as shown on the chart.
The risk for this scenario is limited to 1–2% of the account, absolutely no holding the order if the price closes above 4,173.
⭐️ Scenario 2 – BUY WHEN PRICE BREAKS THE PEAK, CONFIRMING CONTINUATION OF THE UPWARD TREND
Buy: 4,171 – 4,173 (after clearly breaking the old peak)
SL: 4,163
TP: 4,188 – 4,200 – 4,215
In case the price decisively breaks the 4,170 zone and holds above it, this is a signal confirming the buyers continue to control. At that time, I switch bias to buy according to the breakout, targeting the higher resistance zone around 4,200–4,215, further expansion possible if the upward momentum is maintained.
Note: only Buy when the breakout is real – large body candle, closing above the 4,170 zone, not a stop sweep then sharply pulling back down.
1. Basic context
The DXY index is slipping below the 99.50 mark, currently around 99.45, indicating continued downward pressure as the market increases expectations for the Fed to cut interest rates in December.
General monetary easing expectations support gold, as the opportunity cost of holding gold decreases.
However, initial US jobless claims have fallen to the lowest level since April, indicating the labor market is still quite strong. This may cause investors to struggle between expectations of rate cuts and the actual strength of the US economy, creating "jerky" fluctuations around news release times.
In summary, the fundamentals are slightly leaning towards supporting gold, but not enough to completely ignore technical adjustments.
2. Technical analysis & price structure
On the H1 frame, after the recent strong increase, gold is creating an accumulation zone just below the 4,160–4,170 resistance.
The 4,162–4,165 zone is a confluence area: horizontal resistance + old supply zone + price zone where strong selling pressure previously appeared.
The 4,140 zone is the "confirmation of adjustment decrease" threshold – if breached and the price closes below here, the market is likely to want to return to the large liquidity cluster around 4,110–4,100, where many Buy stop losses are waiting.
Therefore, the current structure allows for two-way trading, but each scenario requires clear confirmation from price behavior at the 4,160–4,170 zone before entering an order.
3. Market sentiment & action plan
Both buyers and sellers are looking at the same price zone – 4,160–4,170. This makes this area likely to become a thick liquidity zone, where stops from both sides can be "swept" before the market chooses the real direction.
If the price drops sharply from this zone, it is likely a sell-off phase of late Buy orders near the peak.
Conversely, if buyers are strong enough to keep the price above 4,170, many Sell orders will be trapped, creating momentum for a short squeeze to higher resistance zones.
My plan:
Do not enter orders in the middle of the zone, only wait:
Sell at 4,162–4,165 if clear reversal signals appear.
Buy at 4,171–4,173 after the price breaks the peak and holds above this zone.
Always set a hard SL, do not widen the stop when the order goes against.
If the price strongly breaks both scenario zones without giving clear signals, I accept to stay out, wait for a new structure, do not try to "guess the direction".
I always read feedback to optimize sharing in future posts.

XAUUSD – Inverted Head and Shoulders Pattern Not Fully Played...XAUUSD – Inverted Head and Shoulders Pattern Not Fully Played Out, Continue to Prioritize Buying at POC
I maintain the view: the current main trend is to buy according to the inverted head and shoulders structure, the upward wave is not yet complete. The plan is to wait for the price to adjust to the POC area to re-enter the trend, not to chase buying at high levels.
🎯 Main Scenario – BUY THE DIP AT POC
Buy: 4.133 – 4.130
SL: 4.123
TP: 4.155 – 4.178 – 4.200 – 4.250 – extend if the trend remains strong
For me, the total risk for each order does not exceed 1–2% of the account. A good order with poor capital management is still a wrong order.
1. Basic Context
Gold is maintaining its upward momentum, trading near the highest levels in about two weeks.
The USD weakens as the market increases bets on the scenario of the Fed cutting interest rates soon, following data showing that inflation continues to cool down.
Lower yields and USD mean the opportunity cost of holding gold decreases, supporting the trend of money flow returning to safe-haven assets like gold.
In this context, I do not prioritize looking for large sell orders. Every adjustment is mainly seen as an opportunity to accumulate buying positions.
2. Technical Analysis & Market Sentiment
On the H1 frame, gold has formed and activated an inverted head and shoulders pattern, confirming the upward reversal phase.
The price is returning to test the POC area around 4.133–4.130, coinciding with the previous accumulation area – where the market once absorbed a large number of sell orders. This is the area I prioritize waiting to buy.
Below is a deeper FVG area that acts as a secondary support; I do not wait for the price to go too deep to avoid missing the main rhythm of the pattern.
Regarding price behavior, recent adjustments have been quickly absorbed, with continuous wick candles appearing, showing that buyers still hold the initiative. I wait for a neat pullback to the POC, with a strong enough buying reaction to trigger the entry scenario.
3. Action Plan
Only start disbursing when the price reaches the 4.133–4.130 area, absolutely no FOMO chasing buys.
Take partial profits at levels 4.155 – 4.178 – 4.200 – 4.250, leaving the rest open if gold continues to expand the upward wave.
If the price breaks through 4.123 and closes below this area, I decisively cut losses, stand aside to re-evaluate the structure – do not hold onto a view when the market has changed.
If this analysis is useful to you, please follow the TradingView channel and leave a comment with your perspective. I always read feedback to adjust and improve the way I share in future posts.

LANA_M2 XAUUSD – WAIT FOR ADJUSTMENT TO BUY WITH THE UPWARD...LANA_M2 XAUUSD – WAIT FOR ADJUSTMENT TO BUY WITH THE UPWARD TREND
1. Fundamental Analysis
Gold prices are maintaining an upward momentum and have just reached the highest level in nearly two weeks as expectations for the FOMC to soon cut interest rates continue to be reinforced.
Weaker U.S. economic data, cooling bond yields, and pressure on the USD are benefiting gold from both a real yield perspective and as a safe-haven demand.
In this context, Lana prioritizes the scenario of gold making a slight adjustment and then continuing to follow the upward wave, rather than chasing sales when prices have reached high levels.
2. Technical Analysis
On the H1 frame, the price structure has shifted to an upward trend with a series of consecutive BOS, confirming that buyers are in control.
The FVG demand zones below around 4100 and 4080 are acting as support buffers, coinciding with important bottoms after BOS.
The price zone above around 4180–4200 is the FVG supply area, as well as the resistance/premium zone where the market may react with a downward adjustment.
When combined with Fibonacci, the zones 4103–4105 and 4086–4088 are near the 50–61.8% cluster of the most recent upward move, suitable for a strategy of waiting for adjustment to Buy with the trend.
3. Price Zones to Watch
Support / discount zone (demand & FVG):
4103 – 4105
4086 – 4088
Resistance / premium zone (supply & FVG):
4165 – 4194 – 4202
4. Trading Scenarios
⭐️ Priority Scenario – Buy with the trend
Buy entry: 4103 – 4105
SL: 3998
TP: 4115 – 4130 – 4165 – 4190
⭐️ Supplementary Scenario – Buy deeper at the lower FVG zone
Buy entry: 4086 – 4088
SL: 4080
TP: 4100 – 4125 – 4146 – 4170 – 4190
⭐️ Short-term Reversal Scenario – Sell at the premium zone
Sell entry: 4194
SL: 4202
TP: 4177 – 4150 – 4132 – 4110
👉 Follow Lana on TradingView to read the earliest gold analyses. 💛

LiamTrading – XAUUSD H1 | Gold follows the head-and-shoulders...LiamTrading – XAUUSD H1 | Gold follows the head-and-shoulders pattern, watch for a pullback to POC to enter trades
Gold is completing the final upward move of the head-and-shoulders pattern on the H1 timeframe. The price has now reached the Fibonacci zone (combining both retracement and extension), coinciding with the resistance cluster – POC of the Volume Profile, so a tug-of-war reaction is understandable. My plan is to take advantage of this pullback: prioritize short-term buying according to the current wave, then wait to sell at the strong resistance above.
Macroeconomic context
Russia continues to launch missiles into Kyiv right after the US – Ukraine reached a “19-point plan,” causing the prospect of peace talks to fall into a deadlock again.
However, secret negotiations between the US, Russia, and Ukraine in Abu Dhabi are still ongoing, with key terms yet to be finalized.
The situation of “war not stopping – negotiations not finished” keeps global risk sentiment tense, thereby continuing to be a catalyst for the demand to hold gold in the medium and long term. However, in the short term, prices can still fluctuate strongly around important technical zones before choosing a clearer direction.
Technical analysis H1 – Head-and-shoulders pattern, Fibonacci, Volume Profile
The head-and-shoulders pattern has formed quite clearly, the price is currently in the completed upward move of the right shoulder, approaching the upper resistance zone.
The current price zone of gold is:
Touching the Fibonacci retracement of the previous downward move.
Simultaneously coinciding with the Fibonacci extension of the short-term upward wave → reactions and fluctuations are likely to appear.
Below the price, the 4090–4093 zone is a small support/POC zone during the day, where the Volume Profile thickens, suitable for short-term buying according to the current upward trend.
Above, the 4185–4187 cluster is strong resistance:
Confluence of potential right shoulder peak + old supply zone + Fibonacci extension level.
This is the zone I prioritize watching for a SELL when the pattern completes.
Notable support/FVG zones: 4122–4116 (near support), 4169–4210 (FVG/medium-term resistance).
Reference trading scenarios
1. Buy according to the current upward wave (short-term)
Buy: 4091–4093
SL: 4085
TP: 4120 → 4145 → 4170 → 4190 → 4220
Logic: Buy at the confluence support zone + small POC, take advantage of the price push to complete the right shoulder/pattern. When the trade reaches about +1R, move SL to breakeven to protect the account.
2. Sell at head-and-shoulders pattern resistance (medium-term priority)
Sell: 4185–4187
SL: 4193
TP: 4170 → 4155 → 4130 → 4110
Logic: This is a strong resistance zone, coinciding with the peak of the supply zone and Fibonacci extension. Only activate the SELL order when H1/M15 gives a clear rejection signal (pin bar, bearish engulfing, weakening volume) around 4185–4187.
Additional price zones to note
Support – FVG: 4122–4116
Resistance – FVG: 4169–4210
Can be used as a short scalp zone, but the main scenario should still be prioritized:
Buy below 409x when not yet reaching major resistance.
Sell around 418x when the head-and-shoulders pattern shows signs of completion.

Bullish Analysis – XAU/USD (15M) SMC🇺🇸 FULL BREAKDOWN
In this new setup I’m following the same institutional sequence that the market has been respecting. Price first took liquidity with a clean bullish ChoCH, giving me the first shift in intent. Then we got a BOS, confirming the structural break to the upside.
Price entered a consolidation phase, the typical stage where institutions accumulate orders while inducing liquidity on both sides. That consolidation trapped buyers above and sellers below, setting up the perfect fake out.
After that trap, price comes right back into my POI at 4,129, a zone that aligns with:
• Previous order block
• Institutional support
• Resting liquidity
• The origin of the previous impulse
That’s where I expect the institutional rejection, ideally followed by a bullish ChoCH or BOS on lower timeframes to confirm upward intent.
From that point, the projection is clear: a clean bullish expansion mitigating higher-timeframe imbalances.
My three targets are based on real liquidity:
TP1 – 4,171
First logical mitigation area and minor imbalance.
TP2 – 4,202
Expansion level where the second leg of the push usually completes.
TP3 – 4,230
Final and most important objective: the 4H FVG and the previous Higher High, where institutions typically offload positions.
The setup carries a 1:4 R/R, totally professional and realistic.
Structure, intent, and narrative are all aligned with bullish continuation.
If price respects the POI and confirms on LTF, this becomes an A+ setup, fully aligned with current gold behavior. GOOD LUCK TRADERS…

Brian – Gold game plan for the US sessionBrian – Gold game plan for the US session
Gold’s rally yesterday shook a lot of traders out of position – the move was slow, steady and unforgiving, making it hard both to get in and to get out. For now, the short-term trend is clearer on H1, while H4 is still in transition.
Fundamental view – the Fed is confusing everyone
Fed expectations for December have been on a roller-coaster:
The market went from pricing a 25 bp cut in December at over 90%,
Then collapsed those odds to below 30%,
And has now swung sharply back again – all within about a month.
That kind of violent repricing in rate expectations usually creates two things for gold:
underlying support as soon as the market believes in easier policy again, and
choppy two-way volatility around each new data print or Fed comment.
So the macro backdrop still leans supportive for gold, but you do not want to ignore intraday whipsaws.
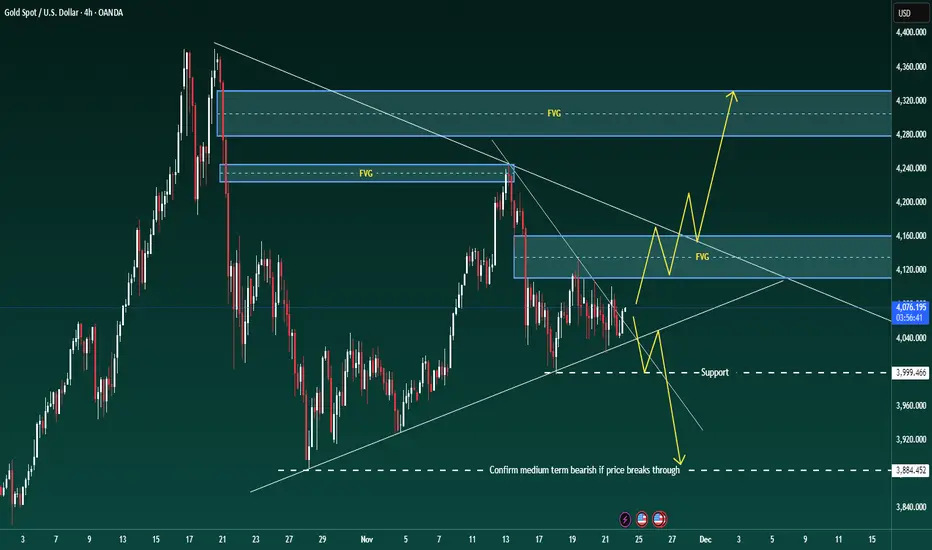
Technical view – H1 bullish, H4 testing the top of structure
On the H4 chart: Price is trading above the rising medium-term trendline from late October, keeping the broader structure constructive as long as 4,000 holds.
We are now pushing up towards the descending trendline and a H4 supply/FVG band between roughly 4,160 and 4,200.
Higher up sits a larger FVG / resistance block around 4,280–4,330 – if price ever accepts above the current downtrend line, that zone becomes a realistic upside magnet.
On H1: Structure is clearly bullish with higher highs and higher lows after yesterday’s impulsive move.
The current leg is extended, so I prefer to buy dips into support or a clean retest, rather than chase at the top of the candle.
Core bias: still prefer buys with the trend. Shorts are tactical, only at clear reaction zones.
Key levels Resistance / sell zones
4,167–4,169: short-term reaction zone at the descending trendline and FVG
4,200–4,220: upper part of the same supply area
4,280–4,330: major H4 FVG / supply above
Support / buy zones
4,110–4,113: intraday support and potential retest area
4,080–4,070: minor support from recent consolidation
4,040–4,020: deeper pullback zone
4,000: key structural support; a break here would damage the bullish case
3,884: level that would confirm a medium-term bearish shift if price breaks and holds below
Trade scenarios (reference only, not financial advice)
Scenario 1 – Primary long: buy the dip into 4,110
Idea: stay with the bullish H1 structure, use the first decent pullback to get a better entry.
Entry: 4,110–4,113
Stop: 4,105
Targets: 4,125 → 4,140 → 4,180 → 4,200
I want to see price pull back into this zone after a push higher, ideally with a rejection wick or bullish candle confirming buyers are still in control.
Scenario 2 – Tactical short: fade the trendline at 4,167–4,169
Idea: counter-trend scalp from a clean confluence of resistance and FVG.
Entry: 4,167–4,169
Stop: 4,175
Targets: 4,155 → 4,140 → 4,120 → 4,105
This is not a swing short – it is a tactical trade against the intraday trend. Size should be smaller, and I would look to lock in profit or move to breakeven quickly if price reacts in our favour.
Scenario 3 – Breakout long if the trendline gives way
If gold pushes through the descending trendline and holds above the 4,170–4,180 zone:
I will shift back to a breakout-continuation mindset, looking to buy pullbacks above the broken trendline.
The next upside magnets then become 4,220 first and eventually the 4,280–4,330 FVG.
As long as 4,000 holds, I respect the upside and prefer to position with the trend, not against it. If we ever see a daily close below 4,000 and then 3,884, the whole story flips and I’ll start treating rallies as selling opportunities.
Trade the structure in front of you, not the headline noise. Manage risk around the shifting Fed expectations, and let the levels do the heavy lifting.
If this breakdown helps with your game plan, follow Brian for more gold updates during the US session and drop your own view in the comments so we can compare scenarios.

XAUUSD – TUESDAY PRIORITIZE BUYING ON BREAKOUT, WATCH FOR ...💛 XAUUSD – TUESDAY PRIORITIZE BUYING ON BREAKOUT, WATCH FOR REACTION AT FIBO 1.618–2.618 🎯
🌤 Overview
Hello everyone, Lana here 💬
After several days of being compressed in a triangle pattern, gold has broken the downtrend line on H1, reclaimed liquidity around the FVG area, and continues to hold above the breakout zone. This indicates that the money flow is prioritizing a short-term upward scenario, targeting the upper Fibonacci extension areas.
Today the market awaits a series of important data: CPI, PPI, sales figures… – these numbers can cause strong volatility, especially when gold is in an "overcrowded trade" state. If US consumer data is positive, the price may experience a deep correction after sweeping liquidity.
💹 Technical Analysis (ICT perspective)
On H1, the price has: Broken the downtrend line of the accumulation triangle.
Retested the FVG area + liquidity repurchase around 4.101–4.105 and bounced back.
The 4.133–4.135 area is now a resistance that has been breached and is turning into support – suitable for a buy on dip strategy.
Technical target: Fibonacci Extension 1.618 of the current upward move is around 4.16xx,
Fibonacci Extension 2.618 + large liquidity zone is above the 4.23xx–4.24xx area, coinciding with the old peak – where a strong reaction from sellers is likely to occur.
Overall, as long as the price remains above the 4.10–4.11 area, the short-term upward structure is maintained.
🎯 Reference Trading Plan
💖 BUY Scenario – prioritize following the trend
Buy on breakout – current price area
Entry: 4.130–4.133
SL: 4.125
TP: 4.150 → 4.175 → 4.198 → 4.230
Buy when price retests deeper
Entry: 4.100–4.103
SL: 4.095 (you may consider a tighter SL instead of 3.995 to optimize R:R)
TP: 4.125 → 4.150 → 4.175 → 4.198
💢 SELL Scenario – only a short-term reaction at resistance
Sell: 4.167–4.169
SL: 4.175
TP: 4.150 → 4.133 → 4.110 → 3.990
This Sell order is only for scalping against the trend, prioritize quick profit-taking when reaching nearby TP areas.
⚠️ Important Notes
Today there are CPI, PPI, sales figures, and other US data – spreads may widen, prices can swing both ways.
Gold is a crowded trade, so after hot upward moves, a deep sell-off is likely to shake off weak positions.
Reasonable strategy: Prioritize buying with the trend at identified support areas.
Reduce volume before news time, do not hold through the release of important data.
Sell should only be considered as a short, quick trade.
🌷 5. Conclusion & Interaction – with LanaM2
In summary, the breakout from the triangle on H1 supports the scenario of gold continuing to rise towards the Fibo 1.618–2.618 area, as long as the price stays above the 4.10–4.11 area 💛
Today, focus on finding a good buying point instead of chasing the price, and be especially cautious when CPI, PPI data is released.
If you find this useful, please 💛 Like – 💬 Comment – 🔔 Follow LanaM2 to update the gold perspective with me every day on TradingView ✨

Analysis & outcome – XAU/USD (15M)🇺🇸 BREAKDOWN GOLD
This setup played out exactly as projected from the beginning. Price executed the full institutional sequence: first a clean sell-side liquidity sweep, creating a false bottom to induce shorts. Right after that, we got a bullish ChoCH, giving us the first confirmation of intent.
Then price left an unmitigated FVG, followed by a manipulative bearish BOS, a classic move to trap sellers before pushing higher. That manipulation brought price straight into the 15M Order Block, the same zone we marked as high-probability demand.
My entry was placed at 4,039, right at the OB and support zone. Price reacted EXACTLY there but missed triggering us by just a few pips. Even though we didn’t get activated, the analysis played out perfectly:
• Clean institutional rejection
• Structure confirmation
• Strong bullish expansion
From that point, price respected both targets:
• TP1: 4,073 → FVG mitigation + liquidity grab
• TP2: 4,101 → Higher timeframe imbalance mitigation
Price even extended beyond TP2, confirming that the institutional narrative was spot on.
Even though we didn’t enter, this is the type of setup that shows the accuracy of reading structure, liquidity, and manipulation. And as always—better to miss a trade than to chase it outside the optimal entry zone.
This analysis confirms we’re aligned with how the market actually delivers.

How I Managed To Achieve 13.83% By Improving My Win Loss RatioThe SMC model that I used provided a beautiful mechanical system for me but did not provide a win loss ratio. The account balance would keep going down inspite of the great RRR.
I added the classical school and the Stochastic to see if I can get better results by those filters. What happened is that the daily stochastic became my major indicator and all the others, including the SMC model, became support confirmations.
The last thing that I added was the opening trades mechanism. I would open multiple trades during the day and once I am satisfied of the positive result I would close all trades. I might close all on the same day of opening.
In four weeks of testing this methodology I was able to turn my win loss ration from a disaster to even the wins exceeding the losses, and not one single batch was closed negative. All trade batches were closed on the positive.
This is a great method not only to increase my balance but also to increase my confidence.
I am not preaching that my plan is great, what I want to concentrate on is the value of education and continuous learning.

Brian – Gold Money Flow Map for the US Session TodayBrian – Gold Money Flow Map for the US Session Today
Technical analysis – trendline, FVG, and two clear scenarios
On H4, gold is still maintaining a medium-term uptrend line drawn from the end of October. The decline in the Asian session this morning was not strong enough to break the structure; the price touched the trendline and then bounced up, indicating that the sellers have not yet "crushed" this support area.
Current structure: The price is accumulating around the 4,050–4,080 area in a sideways candle cluster, lying on the uptrend line and above the 4,000 support.
Above, the 4,120–4,170 area is an FVG + important supply zone; higher is a larger FVG around 4,280–4,330 – if "filled," it is a potential area for a strong profit-taking move.
Below, the 4,000 mark is a key support; losing this mark, the price could quickly slide to the 3,884 area – marked on the chart as the level confirming a medium-term downtrend if breached.
Until 4,000 is broken, I consider this an accumulation area with a high possibility of "fake breaks" on both sides – so prioritize trading according to the trendline, not guessing tops and bottoms in the noise area.
Key levels
Resistance / sell zone: 4,100–4,110: buy confirmation zone, if rejected will become short-term supply
4,170–4,173: FVG / supply, medium-term short zone
4,280–4,330: large FVG above
Support: 4,048–4,050: trendline + intraday breakout zone
4,022–4,005: next support if the price slides off 4,040
4,000: psychological and structural support
3,884: final support; breaking down will confirm a medium-term downtrend
Trade scenarios (for reference, not investment advice)
1. Sell break intraday – follow the trend if the trendline breaks
Entry: sell when the price breaks the short trend at 4,048–4,050
SL: 4,056
TP: 4,040 → 4,022 → 4,005
Idea: if the price breaks below the current accumulation cluster and short trendline, I want to follow the initial selling force, targeting the adjacent support area 4,022–4,005. When the order goes right, SL can be moved to BE around 4,040.
2. Sell “premium” – short at the upper FVG zone
Entry: 4,170–4,173
SL: 4,178
TP: 4,160 → 4,145 → 4,122 → 4,100
This is a price zone I consider "beautiful" for medium-term trading if the market gives a deep retracement. FVG + H4 resistance converge; if the price is strongly rejected here, the TPs are successively the lower demand zone and the current range bottom.
3. Buy only after clean breakout – do not rush to catch the bottom
I am only interested in buy orders when the market structure truly confirms:
Trigger: H1/H2 candle closes clearly above 4,100
Entry: buy right around 4,100 after breakout
SL: 4,092
TP: medium-term towards the 4,145 → 4,170 → 4,230+ depending on momentum
This scenario considers 4,100 as the "exit door" from the current accumulation area. If this area holds as new support, buyers will have a clearer advantage and the money flow could push the price up to gradually fill the upper FVGs.
LiamTrading – XAUUSD H1 | Monday Scenario LiamTrading – XAUUSD H1 | Monday Scenario
Wait for gold to retest the upper trendline before choosing a direction
Quick Overview
On the H1 chart, gold is still oscillating within a triangle pattern with a descending upper trendline and a gradually rising lower trendline. In my opinion, the price still needs an upward move to retest the upper trendline – coinciding with the FVG + POC Volume Profile area – before deciding to create a new trend (either breaking upwards or continuing to decline).
Regarding the USD, many Fed officials have started signaling a potential rate cut, but remain very cautious. UBS and Barclays both lean towards the scenario of the Fed cutting rates in December if upcoming data continues to be weak. This makes it difficult for the USD to break out too strongly, creating room for gold to technically rebound to resistance areas.
Technical Analysis H1
Current structure: price is moving sideways accumulating, with lower highs following the descending trendline, and lows supported by the lower trendline.
Area 4079–4081:
FVG + POC Volume Profile.
Coinciding with the upper trendline → a very strong resistance convergence area, suitable for a sell scenario based on reaction.
Nearest support area: around 4040–4035; if this area breaks, the likelihood of the price returning to test 4010–4000 is quite high.
A clear bullish reversal signal is only evident if the Dow structure increases again, at least when the price breaks above and holds above 4061 and then surpasses the descending trendline.
Reference Trading Scenario
Sell at FVG + POC + trendline (priority)
Entry: 4079–4081
SL: 4086
TP: 4060 → 4045 → 4010
Logic: The price is expected to be pushed up to fill the FVG and touch the POC/trendline before sellers return. This area converges many technical factors, so the win rate is better compared to selling in the middle of the sideways range.
Buy when the bullish structure is confirmed
Condition: price breaks above 4061 and closes the H1 candle holding above this area, while also escaping the descending trendline.
Reference Entry: 4061–4068 (retest the breakout area)
SL: 4050
TP: 4095 → 4130 → 4150
At that point, the triangle pattern is broken upwards, the Dow increase returns, prioritizing buying according to the new trend instead of trying to sell the top.
Trading Notes
Areas for short scalping: 4060, 4040, 4010, 4130 – always wait for clear candle reactions on M5–M15 before entering orders.
Each order should only risk 0.5–1% of the account; when the order reaches about 1R, move SL to breakeven to protect capital.
If you have a different scenario for XAUUSD H1 today, leave a comment and follow the LiamTrading channel to update the daily gold plan on TradingView.

Gold Nonfarm: Buy OB 4030, Target Break 4111🔍 Market Context – November 20, 2025
Gold initially dropped nearly 70 pips at the start of the day but quickly rebounded sharply from the 4030–4032 zone, demonstrating strong buying pressure and a refusal to decline further.
The market structure on the H1–H2 timeframe is forming a classic, well-defined Inverse Head & Shoulders pattern—a quintessential bullish reversal pattern—signaling a potential upward expansion if the neckline is successfully broken.
📅 Key News Events Today:
🇺🇸 Non-Farm Payrolls (NFP)
📉 US Unemployment Rate
🏛 FOMC Meeting Minutes
🗣 Speeches by Trump, Barkin, Williams
🧾 Initial Jobless Claims
⚠️ These events could trigger sharp volatility and will determine the confirmation or rejection of the reversal pattern.
📊 Technical Analysis
🛒 BUY SETUP – Primary Priority
✅ Entry: 4030 – 4032
🛡 Stop Loss (SL): 4027
🎯 Take Profit (TP):
TP1: 4039
TP2: 4047
TP3: 4059
💡 Rationale: Price bounced strongly at the OB + SSS zone. This is a crucial technical support area and the base of the Inverse H&S pattern. The objective is to break the neckline to trigger the uptrend.
🔻 SELL SETUP – Short-Term Strategy
📍 Entry: 4093 – 4095
🛡 SL: 4098
🎯 TP:
TP1: 4088
TP2: 4077
TP3: 4060
TP4: 4033
💡 Rationale: This strategy is only applicable if the price forms a false breakout of the BSL zone and reverses. This is an ideal entry point for quick scalping if the market reacts negatively to the news.
🔑 Key Price Zones
Buy Zone (OB + SSS): 4030 – 4032
→ Strong demand zone, the base of the Inverse Head & Shoulders pattern, confirming the reversal signal if held.
Breakout Neckline Zone: 4101 – 4111
→ The neckline of the Inverse H&S pattern. Breaking this zone will open up opportunities for a sharp rise.
Final Resistance Zone: 4133 – 4140
→ The final target if the breakout is successful and the bullish pattern is confirmed.
✅ Strategy Conclusion
🎯 Main Strategy: Priority is to BUY in the OB zone 4030–4032.
🩸 SELL is only for short-term scalping if there is a signal of rejection at the BSL zone.
🕓 Caution: Be careful entering trades near the Nonfarm news release time—wait for price action to confirm the direction.

LiamTrading – XAUUSD H1 | Gold breaks upward trend, short...LiamTrading – XAUUSD H1 | Gold breaks upward trend, short-term decline prevails
Gold has dropped more than $20 in a short time, down over 1% on the day and is approaching the area below 4,030. The previous upward structure has officially been broken, 4040 can no longer hold, today's focus continues to be on selling according to the trend until the support area 4000–398x shows a clear reaction.
Macro Analysis
Gold prices fall simultaneously with weakening expectations of a December rate cut: JPMorgan no longer forecasts the Fed will cut rates in December, unlike the previous scenario of a 25 bps cut.
Some other organizations still believe that rising unemployment and weak economic data may force the Fed to cut rates by 25 bps in the next meeting.
The market is pricing the possibility of a December rate cut at nearly "50–50", creating significant uncertainty and putting short-term pressure on gold, although in the long term it still benefits if the rate cut cycle occurs.
Technical Analysis H1 – Declining structure, price channel, and support area
After breaking 4040, the price creates a series of Lower High – Lower Low, confirming the Dow declining structure on H1.
A falling channel is forming; the upper boundary of the channel coincides with the short-term resistance area 4050–4060.
Area 4000: important psychological bottom. If decisively broken, the medium-term structure may shift to a deeper correction phase.
Buy zone 3987–3989:
Strong support confluence + Fibonacci extension area (1.618/2.272) of the current decline.
Optimal area to watch for a rebound if there is a clear reversal signal.
Main resistance of the day:
4052–4054: retest area of old support + upper boundary of the falling channel → suitable for a sell rebound scenario.
Today's Trading Scenario (LiamTrading)
Scenario 1 – SELL according to the downtrend (priority)
Entry: 4052–4054
SL: 4060
TP: 4030 → 4015 → 3990
Logic: Price rebounds to resistance area + upper boundary of the falling channel, suitable to continue selling according to the trend. Priority when M15 shows rejection candles (pin bar/bearish engulfing) around 405x.
Scenario 2 – BUY at strong support area 398x (catching the rebound)
Entry: 3987–3989
SL: 3980
TP: 3999 → 4014 → 4040 → 4080
Logic: Area 398x is a strong support confluence; only activate when there is a clear price reaction (long lower wick, reversal pattern on M15–H1). This is a counter-trend order, so reduce volume and take partial profits.
Note risks and invalidation
H1 closes above 4060: short-term declining structure weakens, need to pause all sell orders and reassess.
H1 closes below 3980: buy zone fails, risk of further decline to lower areas; at this point, only prioritize selling.
Always keep risk per order at 0.5–1% of the account, reaching about +1R should move SL to breakeven.
Are you leaning towards continuing to sell according to the trend or waiting to catch the bottom at 398x? Leave a comment and follow LiamTrading channel on TradingView for daily XAUUSD updates.

XAUUSD–FRIDAY BEFORE PMI: MAINTAINING HEAD AND SHOULDERS PATTERN💛 XAUUSD – FRIDAY BEFORE PMI: MAINTAINING HEAD AND SHOULDERS PATTERN, WAITING TO BREAK RANGE 4132–3998 🎯
🌤 1. Overview
Hello everyone, it's Lana here again 💬
Today is the last Friday of the week, the market is waiting for PMI and preparing to enter a phase with a lot of important data in December.
Meanwhile, BTC has been rising faster than XAU in recent weeks, indicating that speculative money is leaning towards crypto, while gold is temporarily moving sideways accumulating.
The US Department of Labor will release the November employment report on December 16, which is 6 days after the December Fed meeting. In other words, the Fed is in a "blackout" state regarding labor data for nearly another month – this forces the market to price in advance, making gold's volatility range wide but lacking a clear trend.
💹 2. Technical Analysis – Range & Head and Shoulders Pattern
On the H3/H4 frame, gold is fluctuating within the large range of 4132 – 3998.
The price wave is gradually narrowing towards the end of the triangle, represented by:
Lower highs,
Higher lows,
→ When one of the two boundaries is broken, a new trend is likely to explode in the direction of the breakout.
The inverse Head – Shoulders – Head pattern has not been broken:
Left shoulder – Head – Right shoulder are all above the rising trendline.
For the final wave of the pattern to follow the rhythm, the price needs to confirm surpassing 4109:
When closing a candle above 4109, the short-term uptrend is confirmed,
At that point, gold can aim for higher liquidity areas such as 4132 → 4145 → 4200.
Conversely, if gold breaks 3998, this will be both:
breaking the range bottom,
and negating the Head and Shoulders pattern,
→ opening the possibility of a deeper decline to the 3960–3920 area.
🎯 3. Reference Trading Scenarios
💖 BUY Scenario – following the pattern & range bottom support
1️⃣ Buy at support 3998–4000
Entry: 3998–4000
SL: below 3990 (depending on risk management)
TP: 4025 → 4040 → 4078
2️⃣ Buy when confirmed above 4109
Condition: Price closes a candle above 4109, confirming the Head and Shoulders pattern is maintained.
Entry: around 4100–4105
SL: 4090
TP: 4132 → 4145 → 4200
💢 SELL Scenario – trading the upper boundary of the range
Sell: 4130–4132
SL: 4138
TP: 4110 → 4095 → 4070 → 4045
Selling should only be considered as scalping against resistance within the range, not the main trend if the Head and Shoulders pattern is still valid.
⚠️ 4. Notes & Risk Management
Range 4132–3998 is still controlling the market:
Above 4109 → prioritize Buy according to the short-term uptrend.
Below 3998 → consider shifting bias to Sell following the breakout.
PMI, Fed expectations, and upcoming employment data may trigger unexpected volatility, therefore:
🌷Gold is at the intersection of technical patterns and macro stories 💛
Be patient and wait for reactions at 3998 and 4109, as these are the two key points that determine whether we enter a new upward wave or a deeper decline.
💛 Like – 💬 Comment – 🔔 Follow LanaM2 to follow gold with me every day ✨

USDJPY – Waiting for H1 CHoCH After Daily Supply RejectionAfter reacting from the Daily Supply Zone, USDJPY is now showing signs of slowing momentum on H1. This region is the decision point: either we see a confirmed structural break (CHoCH), or price continues pushing upward into unmitigated liquidity.
Execution Plan:
– Wait for an H1 candle-body close below the last bullish swing high
– Let price retrace into the newly-formed H1 supply
– Refine on M15/M5 for entry
– No shorts without structural confirmation
If price reclaims the high instead of breaking down, the bearish idea becomes invalid and the bullish trend continues, and we can look at the further SO POINT.
Patience here is key.

LiamTrading – XAUUSD H1 | A bearish structure has formed...LiamTrading – XAUUSD H1 | A bearish structure has formed, waiting for confirmation signals in the European session
Overall, gold is in a corrective phase after the previous upward move. On H1, a clear Dow bearish structure (lower highs, lower lows) has formed, but the support area around 4,030 and the Fibonacci cluster below are still potential zones for a reversal buying force. Today's European session will be crucial to confirm: whether to continue a deep decline or bounce back according to the head and shoulders pattern forming on H4.
Macro – Fundamental Brief
The October Fed meeting minutes show a strong internal division:
One group opposes rate cuts, wanting to maintain the current level.
The other group supports cuts, even proposing further reductions in the December meeting.
This lack of consensus reflects a high degree of monetary policy uncertainty, keeping defensive capital flows interested in gold. In the long term, gold only surges when confidence in the financial system weakens – the peak gold price is not a sign of prosperity, but a warning signal.
Technical Analysis – H1 (trendline, Fibonacci, liquidity)
The price is fluctuating below the short-term descending trendline, confirming the bearish phase is still in effect.
The 4,082–4,090 zone is an “important liquidity zone” – where the price has reacted multiple times, currently acting as near resistance.
The 4,029–4,031 cluster is crucial support:
Coincides with technical support area + Fibonacci retracement level.
Start of a large FVG running down to the 3,985 zone (Fibo 1.618 + psychological support).
Above, the 4,129–4,130 zone is strong resistance (strong resistance on the chart); if the price surpasses and holds above this area, the Dow bearish structure will weaken significantly.
Trading Scenario Reference
BUY Scenario – buy at support / Fibonacci zone
Logic: Price holds above support – Fibonacci, bottom-fishing capital appears.
Entry BUY: 4,029–4,031
SL: 4,022
TP: 4,040 → 4,065 → 4,090 → 4,120
Only prioritize when the price reacts well at 4,029–4,031 (wick or clear reversal candle appears on M15–H1). If H1 closes below 4,022, this BUY scenario should be canceled.
SELL Scenario – follow the current bearish structure (prioritize when trendline is not broken)
Logic: Price retraces to retest resistance + descending trendline and is rejected.
Entry SELL: 4,098–4,100
SL: 4,105
TP: 4,088 → 4,070 → 4,035 → 4,000–3,985
Only enter when the price hits the 4,098–4,100 zone and a clear rejection signal appears (pin bar/bearish engulfing). If H1 closes above 4,105 and breaks the trendline, stop all sell orders and reassess the structure.
Notable Price Zones for Scalping
4,082 – 4,060 – 3,985 – 4,129
These zones can be used for short-term scalping based on price reactions, but reduce volume and close quickly.
Important Note
If the price is confirmed to close stably above the descending trendline and holds above the 4,090–4,100 zone, the priority will gradually shift to BUY setups, as a head and shoulders pattern (bullish reversal) is forming on H4.
Conversely, if the 4,029–4,022 support is decisively broken, gold is likely to continue falling towards the FVG and Fibonacci 1.618 zone around 3,985.
Which scenario are you leaning towards for gold today – retrace up to sell further or hold the bottom to bounce back? Leave a comment below the post and follow the LiamTrading channel for daily XAUUSD updates on TradingView.
