What is Equilibrium in SMC. Balance and Imbalance in Forex Gold
Equilibrium is one of the core elements for understanding market liquidity.
In this article, we will go through the essential basics of liquidity in Forex trading with Smart Money Concepts SMC.
You will learn the interconnections between supply and demand and I will explain how to easily identify balance and imbalance on any market.
Let's start our discussion with understanding how forex pairs move.
The price of an asset goes up if the market demand is stronger than the market supply. The excess of buying activity make the markets update the highs. In smart money concepts, such an event will also be called a buying imbalance.
Look at a strong bullish rally on Gold.
The price is going up because of a buying imbalance.
A strong buying activity creates a massive amount of buyers with unfilled orders.
To entice sellers to start selling, they must offer a higher-better price.
At the same time, if the price of an asset goes down , it means that the market supply is stronger than a demand. The excess of supply will make the markets update the lows. In smc, it will be called a selling imbalance.
That is exactly what is happening with GBPUSD forex pair.
A strong selling activity and the shortage of demand makes the price go down.
The excess of supply or demand on the market can not be eternal.
The lower the price becomes, the more buyers will start buying, and the more sellers will start closing their positions.
At some moment, the surplus of supply will be absorbed by the buyers.
That will be a moment when the market will find equilibrium , the balance between supply and demand.
A strong bearish imbalance on USDJPY made the price drop significantly.
The falling price made 3 things:
It attracted more buyers, because the lower the price the more profitable is buying USDJPY.
It discouraged some buyers from buying, considering that the price is already "too low".
It encouraged some buyers to close their positions in profit.
Because of that, USDJPY stopped falling and found a balance in supply and demand. That is what we call Equilibrium .
In a bull run, the higher the price will go, the more sellers will start selling.
At some moment, buying imbalance will be absorbed by the bears and supply & demand will eventually balance.
Such an event will be called the equilibrium .
EURGBP was rallying strongly.
The higher the price went, the more sellers started to sell, considering selling the pair more and more profitable.
And the same time, fewer buyers were buying and the more started to close their buy positions in profits.
At some moment, the entire excess of the market demand was absorbed by a supply. The market stopped growing and equilibrium was found.
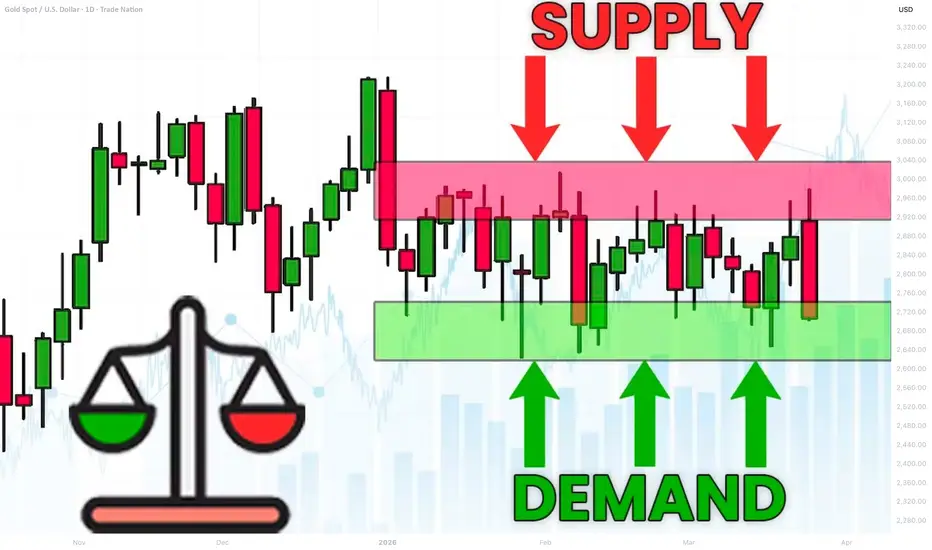
One of the main characteristics of a market equilibrium is sideways price movement and a termination of a formation of new highs or new lows.
Usually, such a sideways price action will form a horizontal range.
That's a real example how a CAD JPY pair found an equilibrium after an extended bearish movement. A formation of a horizontal range confirmed a balance between a supply and a demand.
Please, note that these ranges will form on any time frame that you analyse.
The rule is that the higher is the time frame of the range, the stronger is the market equilibrium.
Above, I have 3 different charts:
USDJPY on a daily time frame, EURJPY on a 4H and GBPUSD on 15 minutes.
All the pairs found an equilibrium in horizontal ranges.
An equilibrium on USDJPY will signify intra week or even intra month balance,
while on EURJPY it will mean intraday/intra week balance.
On GBPUSD, it will signify intraday equilibrium.
Market equilibrium can not last forever.
Fundamentals news and changing market conditions, make the market participants constantly reassess a fair value of an asset.
A violation of the range and a breakout of one of its boundaries will be a trigger of an occurrence of an imbalance .
A bullish violation of the upper boundary of the range will signify a buying imbalance and a highly probable rise to the new highs.
While a bearish violation of the lower boundary of the range will mean a selling imbalance and a highly probable fall to the new lows.
Please, study how GBPCHF was moving for a week on an hourly time frame.
The periods of balance were changed by the periods of bullish or bearish imbalances, that found a new equilibrium on higher/lower price levels.
Understanding of basic principles of supply and demand in trading is essential for profitable trading smart money concepts.
Learn to recognize the periods of imbalance and equilibrium.
It will provide you the edge in understanding and trading any forex pair.
❤️Please, support my work with like, thank you!❤️
I am part of Trade Nation's Influencer program and receive a monthly fee for using their TradingView charts in my analysis.
Smctradingbasics
What is Bullish/Bearish Breaker Block & How to Find It Easily
Breaker blocks are easier to find than you think.
In this article, I will share with you very efficient price models for the identification of Order Blocks and Breaker Blocks.
You will learn their meaning, how to draw and use them in trading Smart Money Concepts SMC.
Bullish Trend Model & Breaker Block.
Let's start with an essential theory .
Please, examine a following price model:
In a classic bullish structure where the price consistently updates Higher Highs HH and Higher Lows HH, a bullish order block zone will be the area based on the last Higher How.
I will explain how to draw that zone in the examples below.
In some instances, a bullish order block zone will fail to deliver a bullish wave. Its bearish breakout will follow after its test instead.
It will be a critical event that is called a market structure shift in Smart Money Concepts SMC.
A formation of a new low will signify a violation of a bullish trend and a highly probable change of the market sentiment.
A broken bullish order block zone will turn into a Bearish Breaker Block.
The zone from where the next bearish wave will most likely follow.
It will provide a very safe place to sell from.
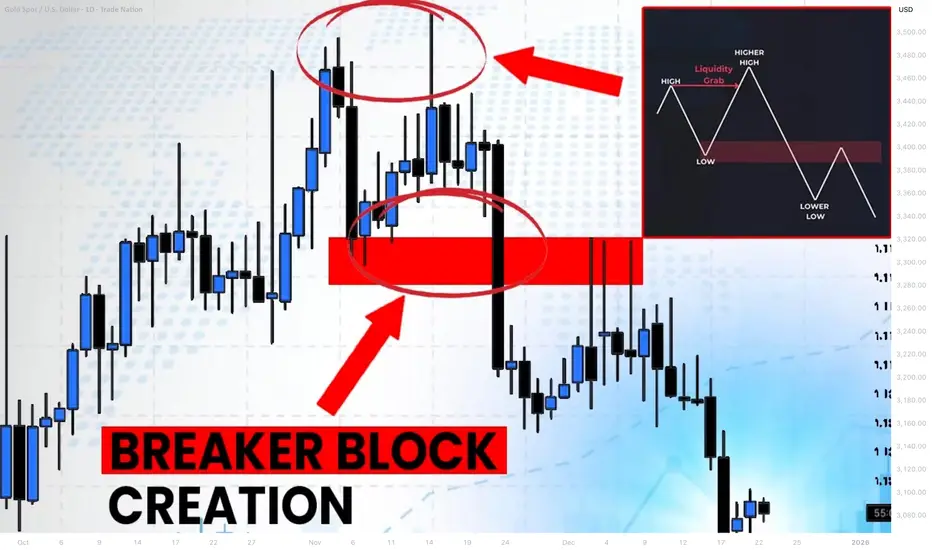
Market structure shift in a bullish trend is not a random event.
It usually occurs after a test of a significant supply zone with a liquidity grab.
It can help you to predict the change of the sentiment way before it happens.
That's an example of such a price model on GBPAUD forex pair.
We see a confirmed bullish liquidity sweep in uptrend after a test of a historic supply zone.
A bearish wave followed then and a bullish order block zone was broken.
To draw Order Block Zone, I picked the level of the last higher low as its lower boundary and a low of a body of that candlestick as the upper boundary.
After a breakout, it turned into a Bearish Breaker Block.
A bearish continuation occurred after its test.
Bearish Trend Model & Breaker Block.
Please, check this model:
In a classic bearish structure where the price consistently updates Lower Lows LL and Lower Highs LH, a bearish order block zone will be the area based on the last Lower High.
In some instances, a bearish order block zone will fail to deliver a bearish wave. Its bullish breakout will follow after its test instead.
It will be a significant event that is called a bullish market structure shift in Smart Money Concepts SMC.
A formation of a new high will signify a violation of a bearish trend and a highly probable change of the market sentiment.
A broken bearish order block zone will turn into a Bullish Breaker Block.
The zone from where the next bullish wave will most likely follow.
It will provide a very safe place to buy from.
Market structure shift in a bearish trend is not a random event.
It usually occurs after a test of a significant demand zone with a liquidity grab.
That's a real example of such a price model on WTI Crude Oil.
A bearish structure was violated after a test of a demand zone.
A bearish order block was broken, and it turned into a Bullish Breaker Block Zone then.
(Drawing a bullish order block zone, I picked the level of the last lower high as its upper boundary and a high of a body of that candle as its lower boundary )
A bullish movement followed after a deep test of that.
A proper combination of structure mapping and liquidity analysis will help you to predict a market structure shirt and a breaker block creation before they happen.
The models that I shared will help you to confirm bullish and bearish breaker blocks trading Forex or any other markets with Smart Money Concepts SMC ICT.
❤️Please, support my work with like, thank you!❤️
I am part of Trade Nation's Influencer program and receive a monthly fee for using their TradingView charts in my analysis.
How to Find Order Block on Any Forex Pair & Gold (SMC Basics)
Order block is easier to find than you think.
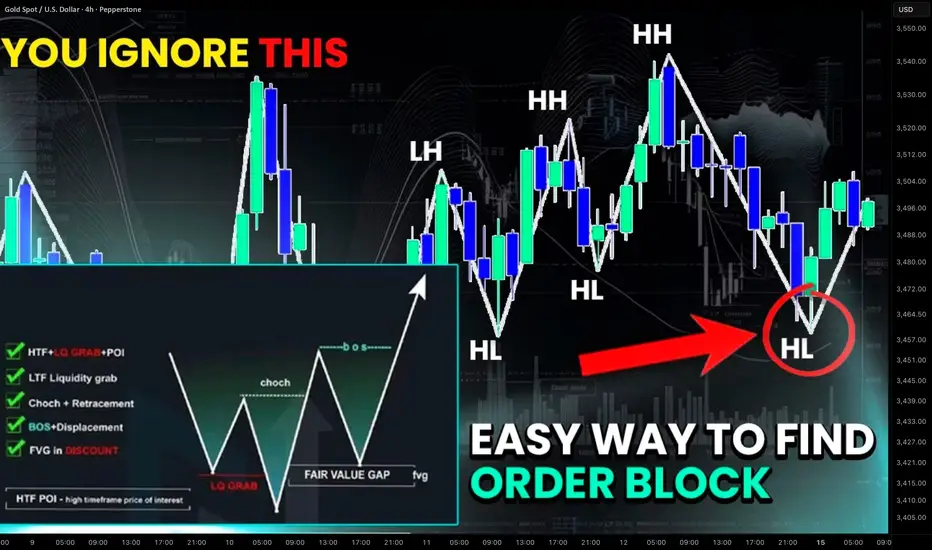
I am going to reveal 2 simple price models that will help you find strong bullish and bearish order block zones on any Forex pair.
Discover how to identify OB and how to draw it properly in Smart Money Concepts SMC trading.
To effectively spot Order Block, you will need to learn basic Structure Mapping.
To find a bullish order block, you will need to learn by heart a classic bullish trend model.
According to the rules, that market is trading in a bullish trend if the price consistently updates Higher High HH and Higher Lows HL.
Such a price action confirms an uptrend .
The last higher low in that will be your Bullish Order Block.
Let me share with you a definition of a bullish order block so you could better understand its deep meaning.
Bullish order block is a significant price zone or a level where large market players (banks, institutions, hedge funds) have previously placed a high volume of buy orders, creating a strong imbalance in demand.
And what is a proof of this strong demand?
A consequent break of structure and a formation of a new higher high demonstrate a clear strength of a bullish wave that was initiated because of the activity of Smart Money.
As the market continues updating Higher Highs , remember to update Order Block. It will strictly be based on the LAST Higher Low.
Examine a price action on NZDUSD forex pair on a daily time frame.
The trend is bullish and our Order Block will be based on the last Higher Low.
To properly draw Order Block zone, its low should be based on the lowest low of a Higher Low. Its high should be based on the lowest daily candle close above a low of a Higher Low.
We will assume that huge volumes of buying orders will accumulate within that zone.
That area will provide a safe zone for us to buy the market from.
Alternatively, its violation will signify an important shift in a market sentiment.
To find a bearish order block, you will need to understand a classic bearish trend model.
According to the rules, that market is trading in a bearish trend if the price consistently updates Lower Lows LL and Lower Highs LH.
Such a price action confirms a downtrend .
The last lower high in that will be your Bearish Order Block.
And here is what exactly is a bearish order block.
Bearish order block is a significant price zone or a level where large market players - Smart Money have previously placed a high volume of sell orders, creating a strong imbalance in supply.
And what is a proof of this strong supply?
A consequent break of structure and a formation of a new lower low demonstrate a clear strength of a bearish wave that was initiated because of the activity of Smart Money.
As the market continues updating Lower Lows, remember to update Order Block. It will strictly be based on the LAST Lower High.
Please, check a price action on NZDCHF forex pair.
The market is trading in a downtrend.
Our bearish order block will be based on the last lower high .
The high of this zone will be the highest high of the last lower high.
Its low will be the highest daily candle close below the last lower high.
That zone will be a critical resistance.
Large selling volumes will be distributed within.
Once that area is tested, we can sell the market from that.
Alternatively, its bullish violation will signify a significant shift in the market sentiment.
Of course, these 2 models will not reveal all the order block on a price chart, BUT it will show you one of the most significant ones that you can rely on for safe entries for your trades.
Just learn a structure mapping in smart money concepts and use that you find powerful order block zones on any forex pair.
❤️Please, support my work with like, thank you!❤️
I am part of Trade Nation's Influencer program and receive a monthly fee for using their TradingView charts in my analysis.
Break of Structure VS Liquidity Grab. How to Identify Valid BoS
The main problem with break of structure trading is that you can easily confuse that with a liquidity grab.
But don't worry.
There is a secret SMC price model that will help you to confirm a break of structure in a second.
Learn smart money concepts trading secrets and a simple strategy to trade break of structure on any forex pair.
Let's study a break of structure that I spotted on AUDUSD forex pair.
We see that the market is bullish on a daily time frame and the price has just violated a previous high with a break of structure.
The issue with that is the fact that such a violation can easily be a liquidity grab and a bullish trap .
Buying the market immediately after a BoS, we can incur a huge loss .
We need something that would help us to accurate validate that.
Fortunately, there is a simple price model in SMC that will help.
After you spotted a break of structure on a daily time frame,
use a 4h time frame for its validation.
After a BoS on a daily time frame, the market usually starts retracing , setting a new local high.
To confirm that it is not a trap, you will need a break of THAT structure on a 4H time frame.
It will increase the probabilities that the entire bullish movement that you see on a daily is not a manipulation.
Here is what exactly we need.
After the price violated a daily structure and closed above that, we see a minor intraday retracement on a 4h time frame.
A bullish violation of the last high there is our BoS confirmation and a clear indicator of the strength of the buyers.
You can execute a buy trade, following a simple strategy then.
Set a buy limit order on a retest of a broken high on a 4H,
a stop loss should be below the last higher low,
a take profit is based on the next supply zone on a daily.
To avoid the traps, a single time frame is not enough for profitable trading break of structure.
Learn to integrate multiple time frames in smart money concepts trading. It will help you make thousands of pips weekly.
❤️Please, support my work with like, thank you!❤️
I am part of Trade Nation's Influencer program and receive a monthly fee for using their TradingView charts in my analysis.
Market Manipulations. Bullish Trap (Smart Money Concepts SMC)
In the today's article, we will discuss how smart money manipulate the market with a bullish trap .
In simple words, a bullish trap is a FALSE bullish signal created by big players.
With a bullish trap, the smart money aims to:
1️⃣ Increase demand for an asset, encouraging the market participant to buy it.
2️⃣ Make sellers close their positions in a loss .
When a short position is closed, it is automatically BOUGHT by the market.
Take a look at a key horizontal resistance on AUDCHF.
Many times in the past, the market dropped from that.
For sellers, it is a perfect area to short from.
Bullish violation of the underlined zone make sellers close their position in a loss and attracts buyers.
Then the market suddenly starts falling heavily, revealing the presence of smart money.
Both the sellers and the buyers lose their money because of the manipulation.
There are 2 main reasons why the smart money manipulates the markets in a such a way:
1️⃣ - A big player is seeking to close a huge long position
When a long position is closed, it is automatically SOLD to the market.
In order to sell a huge position, smart money needs a counterpart who will buy their position.
Triggering stop losses of sellers and creating a false demand, smart money sell their position partially to the crowd.
2️⃣ - A big player wants to open a huge short position
But why the smart money can't just close their long position or open short without a manipulation?
A big sell order placed by the institutional trader, closing their long position, can have an impact on the price of the asset. If the sell order is large enough, it can push the price downward as sellers outnumber buyers. Smart money are trying to balance the supply and demand on the market, hiding their presence.
It is quite complicated for the newbies and even for experienced traders to recognize a bullish trap.
One of the efficient ways is to apply multiple time frame analysis and price action.
Remember, that most of the time bullish traps occur on key horizontal or vertical resistances.
After you see a breakout, analyze lower time frames.
Quite often, after a breakout, the market starts ranging .
After a breakout of a key daily resistance, gold started to consolidate within a narrow range on an hourly time frame.
Bearish breakout of the support of the range will indicate a strength of the sellers and a highly probable bullish trap.
Remember, that you can not spot all the traps, and occasionally you will be fooled by smart money. However, with experience, you will learn to recognize common bullish traps.
❤️Please, support my work with like, thank you!❤️
I am part of Trade Nation's Influencer program and receive a monthly fee for using their TradingView charts in my analysis.

Learn Best Change of Character CHoCH Model in Trading with SMC
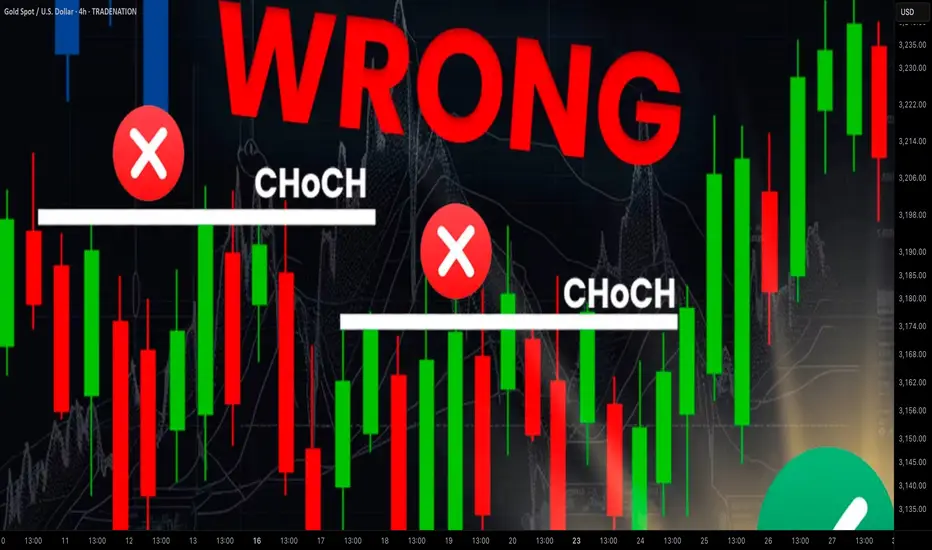
Most of the SMC traders get Change of Character CHoCH WRONG!
In this article, I will share with you Change of Character models that have a low accuracy and better to be avoided.
I will teach you the best CHoCH model for Forex Gold trading and show you how to identify it easily.
Let's start with the basic theory first and discuss what Change of Character signifies.
Change of Character in Bearish Trend
In a downtrend, Change of Character CHoCH is an important event that signifies a violation of a bearish trend.
CHoCH is confirmed when the price breaks and closes above the level of the last lower high.
Above, is a text book Change of Character model in a bearish trend.
For the newbie traders, such a price action provides a strong signal to buy while it fact it is NOT .
One crucial thing is missing in this model to confirm a bullish reversal.
According to basic trend analysis rules, we say that the market trend is bullish if the price forms a bullish impulse, retraces and sets a Higher Low HH , forms a new bullish impulse with a new Higher High HH.
Only then, we can say that the market is trading in up trend.
CHoCH model above confirms a bearish trend violation BUT it does not confirm a trend change.
Such a model may easily signify a deeper correction.
Look what happened with GBPNZD.
Though the price formed a confirmed bearish CHoCH, it was a false signal and just an extended correction.
That's a perfect bullish reversal model.
It combines CHoCH and conditions for a bullish trend.
Such a union is extremely accurate in predicting up movements.
Examine a price action on USDJPY.
Not only the price formed a confirmed CHoCH but also we see a start of a new bullish trend.
Change of Character in Bullish Trend
In an uptrend, Change of Character CHoCH is a significant event that signifies a violation of a bullish trend.
CHoCH is confirmed when the price breaks and closes below the level of the last higher low.
Above is a typical model of a bearish CHoCH.
For many traders, that is the signal to open short.
However, it is not that accurate and one important component is missing there.
According to basic price action rules, the market trend is bearish
if the price forms at least 2 bearish impulses with Lower Lows LL and a pullback between them with a Lower High LH.
Only when these 3 conditions are met, a bearish trend is confirmed .
Perfect bearish Change of Character model should include both CHoCH and a bearish trend price action. That will confirm a violation of a bullish trend and start of a new bearish trend.
EURCAD has a very strong potential to continue falling:
not only we see a valid bearish Change of Character but also
a start of a new bearish trend based on a price action.
Next time when you identify CHoCH on forex market, make sure that you check the preceding price action. It will help you to more accurate assess reversal probabilities and make a wiser trading decision.
❤️Please, support my work with like, thank you!❤️
I am part of Trade Nation's Influencer program and receive a monthly fee for using their TradingView charts in my analysis.