BNBUSDT M15 HTF FVG Rejection and Bearish Continuation📝 Description
BINANCE:BNBUSDT is trading within a broader bearish structure after a strong impulsive sell-off. The recent upside move appears corrective, with price reacting into a higher-timeframe Fair Value Gap, suggesting a potential continuation of the dominant bearish trend.
________________________________________
📉 Signal / Analysis
Primary Bias: Bearish below the H1 FVG
Preferred Setup:
• Entry: 847.07
• Stop Loss: Above 852.07
• TP1: 842.80
• TP2: 838.00
• TP3: 833.20
________________________________________
🧠 ICT & SMC Notes
• Strong bearish displacement confirming downside market structure
• Price trading below previous liquidity highs (LH failure)
• Reaction into H1 Fair Value Gap aligns with premium sell zone
• Clear SMT with TOTAL3
________________________________________
📌 Summary
As long as price remains below the 852–856 resistance area, the bearish continuation scenario remains valid. The current retracement is viewed as a corrective move within a larger downside trend, targeting deeper liquidity pools below.
________________________________________
🌍 Fundamental Notes / Sentiment
Broader risk-off sentiment across crypto markets and declining momentum in large-cap altcoins continue to weigh on BNB. Without a strong bullish catalyst, downside continuation remains the higher-probability scenario.
________________________________________
⚠️ Risk Disclosure
Trading involves substantial risk and may result in capital loss. This analysis is for educational purposes only and does not constitute financial advice. Always apply proper risk management, predefined stop-loss levels, and disciplined position sizing aligned with your trading plan.
SMT

GBPUSD | Long IdeaLooking for GBPUSD to continue it's uptrend this week.
First zone I would be interested in is being tested as we speak. GBPUSD is testing the Asia low, would be interested in taking a long position here but not really convinced right now.
Looking for price to go a little deeper before taking longs.
Let me know what you think!
Do your own due diligence, this is not investment advise!

AUDUSD | Long IdeaLooking for AUDUSD to make a move up from this Asia low here.
Other USD pairs making the same move at the moment so momentum is on my side here.
Let me know what you think!
do your own due diligence, this is not investment advise!

GBPUSD (6B) Long: Bullish SMT + Footprint ConfirmationI am looking for a high-probability reversal on 6B (GBP Futures) based on a clear Bullish SMT Divergence.
The Logic: While the British Pound (6B) swept its session lows, the Euro (6E) held a higher low. This divergence at a key liquidity level suggests institutional absorption and a "Stop Hunt."
The Target: I expect price to rebalance into the 1H Fair Value Gap (FVG) at 1.3540 – 1.3550. Once this gap is filled, I will re-evaluate for a potential short continuation.
The Execution Plan:
Entry: Only AFTER a Footprint confirmation.
I am waiting for a Stacked Buying Imbalance (3+ rows of aggressive buying) or a Finished Auction (Zero Print) at the low to confirm the bottom is in.
Stop Loss: 1.3425 (Below the sweep).
Take Profit 1: 1.3485 (Mid-range/vPOC).
Take Profit 2: 1.3540 (1H FVG).
Disclaimer: This is not financial advice. This post represents my personal analysis and trading idea for educational purposes. Always manage your risk.

Bitcoin - Can we hit the target at $91.000 This BTC technical analysis shows that Bitcoin is currently in a waiting phase. Price is trading around $87,500 and continues to move within a clearly defined range. Although a recent bounce has occurred, there is still a lack of a convincing impulse to define the next larger move. As a result, liquidity and fair value gaps remain the primary guiding factors.
4h bullish FVG
Within the bullish 4-hour FVG, a significant amount of liquidity is still present. This makes the zone around $86,000 to $86,500 an interesting area for a potential retest. As long as this liquidity has not been fully collected, there remains a strong possibility that BTC revisits this region. A deeper test of this FVG could actually provide a stronger foundation for a subsequent upward move.
4h bearish FVG
On the upside, the 4-hour bearish FVG forms a clear and strong resistance. This zone around $91,000 to $92,000 serves as the first logical target for a bounce originating from the lower range. There is substantial supply and prior rejection in this area, making a reaction highly likely. Only a convincing breakout would allow Bitcoin to shift focus toward higher price levels.
FInal thoughts
In summary, Bitcoin remains technically neutral to slightly bullish as long as the bullish 4-hour FVG continues to hold. The market appears to be gathering liquidity before committing to a direction. This BTC technical analysis emphasizes that patience is essential, as it first needs to become clear whether BTC will collect liquidity on the downside or move directly toward the bearish FVG for another test.

AUDCAD | Short ideaLooking for AUDCAD to continue it's downtrend for the week.
Next Pio where I am interested in for looking into short positions is the Asia high.
Looking for a test and a nice close under this level.
If I see this I am planning on placing stop well above the wick that candle would have and a target somewhere above the PDL.
I have placed a random stop loss for now just so you could see what I would be looking for RR wise.
If I don't see any rejection I don't enter and will look for setups on other pairs.
Stay safe out there and do your own due diligence, this is not investment advise!

GBPJPY | Long IdeaLooking for GBPJPY to make a move up this week to continue it's brutal uptrend.
GBPJPY bounced from Monday low this morning and making a nice move up.
Retest could still be possible if you haven't entered yet.
Stay safe out there and do your own due diligence, this is not investment advise!

Bitcoin - Can it reclaim $89.000?Bitcoin (BTC) is currently trading in a crucial zone after the recent decline, positioned between a bullish 4-hour FVG around the lower $85,000 region and a 4-hour bearish FVG just below resistance. This BTC technical analysis focuses on whether Bitcoin can reclaim the lost trendline and the associated FVG, or whether the market instead opts for a deeper correction.
Bullish 4H FVG
The bullish 4-hour FVG around approximately $85,500 is holding for now as an important support level. From this zone, BTC recently initiated a modest bounce, indicating that buying interest is still present. As long as price continues to close above this FVG, there remains technical room for a larger recovery move toward the higher resistance zones.
Bearish Scenario
The bearish scenario centers on a rejection within the 4-hour bearish FVG that aligns with the previously broken ascending trendline. If BTC only revisits this area as a retest and is subsequently sold off, it would confirm that former support has turned into resistance. In that case, lower prices become likely again, with potential targets below the recent lows and deeper into the $80,000 range.
Bullish Scenario
The bullish scenario requires a convincing reclaim of both the trendline and the 4-hour bearish FVG above it. If BTC manages to close above this cluster and then successfully retest it as new support, market sentiment would shift back in favor of the bulls. In that case, BTC would likely revisit the recent highs near the major resistance zone. This BTC technical analysis therefore emphasizes that the reaction around the converging trendline and FVG will be decisive for the next larger move.
Conclusion
BTC is currently at an important crossroads between a still-holding bullish 4-hour FVG around $85,500 and a critical 4-hour bearish FVG at the broken trendline. A rejection at the upper levels increases the probability of further downside, while a clear reclaim of both the trendline and the FVG would open the door for a retest of the highs.

EURCHF | Long ideaLooking for EURCHF to continue it's uptrend today.
We are at Asia lows now and we are seeing a reaction.
Looking for price to bounce here and reach PDH.
Stay safe out there and do your own due diligence, this is not investment advise!

USDCHFSmall trade, looking for USDCHF to continue it's uptrend.
USDCHF found support here multiple times. Would need to fully close under the green zone on one of the higher time frames for me to cancel.
Stay safe out there and do your own due diligence, this is not investment advise!

EURJPY | Long IdeaEURJPY testing my zone once again.
the zone lines up with the Previous Monthly High and has been testing a few times last week.
Kind of surprised that EURJPY is here once again that quick.
Looking for price to hold this level and find it's way back up.
If price closes under on the 2-4h chart I don't really see another zone I would be interested in in buying so I'll let it do it's thing and see if any price action later this week looks interesting to me.

GBPNZD | Long IdeaGBPNZD Showing double bottom on lower time frames at key point.
Expecting a bounce here.

BTCUSD | Waiting for breakoutBTCUSD has been ranging for quit a while now.
Bitcoin failed to close above the upper purple line, and price dropped further down throughout the week and dropped even more in the weekend.
Bitcoin held to previous Sunday swing low and already showed a bounce today.
Waiting for Bitcoin the break either purple line. I am fine with either one :').
What are your thought on bitcoin?
Let me know in the comments!
Stay safe out there and do your own due diligence, this is not investment advise!

Bitcoin - Can the ascending triangle be broken?Introduction
Bitcoin is currently consolidating within a well-defined structure after weeks of volatile movement. Despite several failed attempts to break higher, the market continues to compress just beneath a major resistance zone. This type of tightening price action often signals a larger move approaching, as liquidity begins to build on both sides of the range. The chart highlights two key elements that will likely determine BTC’s next direction: the ascending triangle formation and the liquidity level resting below current price. Understanding how price reacts to these areas will be essential for anticipating the next significant impulse.
Ascending Triangle
BTC is forming an ascending triangle pattern, characterized by rising lows meeting a relatively horizontal zone of resistance. This resistance band, highlighted on the chart, has repeatedly capped upward attempts. Each time BTC pushes into the zone, it is met with selling pressure, but the higher lows reveal that buyers are steadily gaining ground. This pattern typically suggests accumulation and a potential bullish breakout once enough pressure builds.
If BTC can break above the upper boundary of this triangle with strength and volume, the move would likely target higher liquidity pools above recent highs. Such a breakout often leads to an impulsive leg upward, as trapped short positions are forced to cover and momentum buyers join in. For now, the ascending trendline remains a key structural support that defines the bullish side of this pattern.
Liquidity Level
Below the current range lies a clear liquidity zone, created by a cluster of equal lows and untested downside levels. This area is marked on the chart and represents where stop-loss orders and resting liquidity are likely positioned. Markets often revisit such zones before making a decisive breakout, particularly in triangle structures where liquidity builds on both sides.
A sweep of this liquidity, combined with a tap into the ascending trendline, would be a textbook setup for buyers to step back in. If BTC dips into this zone and rebounds strongly, it would further strengthen the market structure and increase the likelihood that the eventual breakout takes place to the upside. However, if this liquidity level fails and price breaks below the trendline, the bullish structure would be invalidated, opening the door for a deeper move down.
Final Thoughts
BTC is approaching a decision point, with price tightening inside an ascending triangle while liquidity pools gather below. As long as the ascending trendline continues to act as support, the market maintains a bullish bias, and a breakout above the resistance zone becomes increasingly likely. Still, a liquidity sweep to the downside before any major rally remains a strong possibility. Traders should pay close attention to how BTC reacts if it dips into the liquidity zone, as this response will reveal whether buyers are prepared to defend the structure. A clean breakout above the resistance band would confirm the next bullish leg, while a breakdown below the ascending trendline would signal weakness and shift the outlook.

XAUUSD ExpansionMarket Outlook: Bullish / Long
Analysis: Gold has confirmed a classic Market Maker Buy Model (MMBM) on the H1/H4 timeframe. We have successfully completed the Sellside Curve, swept the lows at 4180, and confirmed a Smart Money Reversal via a clear Market Structure Shift (MSS).
The Setup: Price is currently in the "Buy Side Curve" expansion phase. I am monitoring the retest of the Bullish Order Block & Rejection Block (-RB/+OB) zone between 4280 - 4300.
Confluence: The entry zone aligns with the 50% OTE and fills the recent Balanced Price Range (BPR).
Validation: The market has reclaimed the Original Consolidation zone (4211 - 4245), turning it from resistance into support.
Targets:
TP1: 4350 (Internal Range Liquidity)
TP2: 4375 (1D HTF Buyside Liquidity / Key Level 4H)
Invalidation: A 4H candle close below the 4270 Order Block invalidates the immediate bullish continuation.

EURUSD EURUSD had a bounce up early morning and got rejected by Friday highs a little later.
EURUSD finding some resistance in the upper green zone.
Looking at how EURUSD reacts and will try to anticipate a move!
Let me know what you think!
Stay safe out there and do your own due diligence, this is not investment advise!

EURGBP | Move down Expecting a move down from this zone to continue the downtrend.
Price has been rejected from the red zone multiple times and wee see a reaction now.
Let me know what you think!
Stay safe out there and do your own due diligence, this is not investment advise!

GOLD | Short ideaGold tapped into the previous monthly high and since then been trending down.
Now it is at a key level where I expect Gold to reject and make a move down.
A reaction has been there already, it is very volatile so tread carefully.
Let me know what your analysis is!
Stay safe out there and do your own due diligence, this is not investment advise!

EURCAD | Move DownLooking for EURCAD to continue the downtrend.
EURCAD is at a key level at the moment testing PDH.
If it breaks this level I expect EURCAD to move further up trying to find liquidity to fuel the next leg down.
Let me know what your analysis is on EURCAD!
Stay safe out there and do your own due diligence, this is not investment advise!

USDCHF | Long IdeaUSDCHF tapped into Previous Weekly Low and showed a reaction.
I am bullish on this so these are the POI's I look for to make entry.
If price closes under this level, I will be looking for lower POI's to find a new entry points.
Let me know what you think.
Stay safe out there and do your own due diligence, this is not investment advise!

EURUSD | Into The Next WeekLooking for a bullish continuation into the next week for both EURUSD and GBPUSD. Both looking strong.
I have 2 best case possibilities shown on the chart.
we either see a direct move to the upside, will be looking for bullish setups for the rest of the week.
Or we see a small drop first into the lower time frame support, and again a move up.
Let me know what your outlook is on EURUSD!
Stay safe out there and do your own due diligence, this is not investment advise!

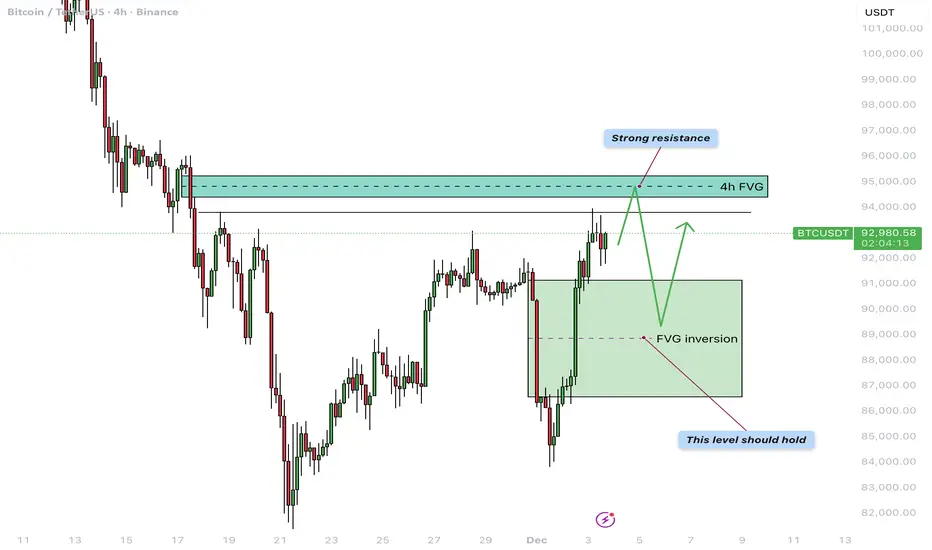
Bitcoin - $95.000 before a correction?Bitcoin finds itself at an important turning point once again after a sharp decline followed by a strong recovery. In this update, we will cover the reaction to the previous 4H bearish FVG, the newly formed 4H FVG inversion acting as support, the next resistance level around 95,000 dollars, and the recent liquidity sweep.
4H Bearish FVG Inversion
Two days ago, BTC made a strong downward move that reversed a large part of the earlier rally and collected deep liquidity beneath local lows. During this drop, a clear 4H bearish FVG was formed, acting as a supply zone. Yesterday, however, BTC reclaimed this entire FVG with conviction: the price broke through it and closed multiple candles above the zone. This shift flips the area from supply into demand, meaning the former bearish FVG has now transformed into a 4H FVG inversion. The green box on the chart now represents the primary support zone, ideally holding during any pullback.
4H Bearish FVG Around $95,000
Above the current price lies the next 4H bearish FVG around roughly 95,000 dollars, aligning with a previous consolidation and distribution phase. This region acts as strong resistance and is the next logical magnet for the ongoing recovery move. As long as the FVG inversion beneath price holds, it is reasonable to expect BTC to gradually move toward the 95k area. A clear reaction is likely once this zone is reached—ranging from a brief rejection and sideways consolidation to a potentially larger reversal if sellers become aggressive again.
Liquidity Sweep
Recently, BTC briefly pushed above a local high and pulled back immediately afterward, creating a clear liquidity sweep on the chart. This move wiped out the stops of late shorts as well as breakout longs but did not yet lead to immediate continuation to the upside. After such a sweep, the question becomes whether the market can gather enough buyers to fuel the next impulse toward the higher FVG, or whether price will first drop back toward the inversion support to gather liquidity there. The reaction at current levels will therefore provide important insight into short-term direction.
Conclusion
Because of today’s liquidity sweep, a direct correction from the current price is very possible, especially if short-term traders take profit after the strong bounce. However, the base scenario remains that BTC could still make one more push upward toward the 4H bearish FVG around 95,000 dollars, where a more significant reaction is expected. Such a move would fit perfectly within a structure where resistance is tested first, followed by a pullback to retest the new inversion support—confirming whether the recent reversal has real strength behind it.
-------------------------
Thanks for your support. If you enjoyed this analysis, make sure to follow me so you don't miss the next one. And if you found it helpful, feel free to drop a like 👍 and leave a comment 💬, I’d love to hear your thoughts!
EURUSD Short Term Sell OpportunityQuick Summary
Price may offer a sell setup around 1.16462 after a strong bullish push that left a liquidity void behind. A retracement to fill that void is likely, and the presence of SMT with GBPUSD strengthens the bearish correction scenario before any continuation upward.
Full Analysis
The EURUSD has climbed aggressively, gaining more than 55 pips in a short span of time. While this strong bullish move confirms market strength, it also left a clear liquidity void. Such voids are typically revisited, as the market often seeks to rebalance inefficiencies before continuing its main direction.
The level at 1.16462 stands out as an attractive zone for a short term sell. This area aligns with the point where price may exhaust its immediate bullish impulse and begin correcting downward to mitigate the inefficiency created during the rapid move up.
Adding to this, there is an SMT divergence forming between EURUSD and GBPUSD. While GBPUSD pushed higher, EURUSD did not fully follow with equal strength. This imbalance between the two correlated pairs often signals a potential reversal or corrective move
