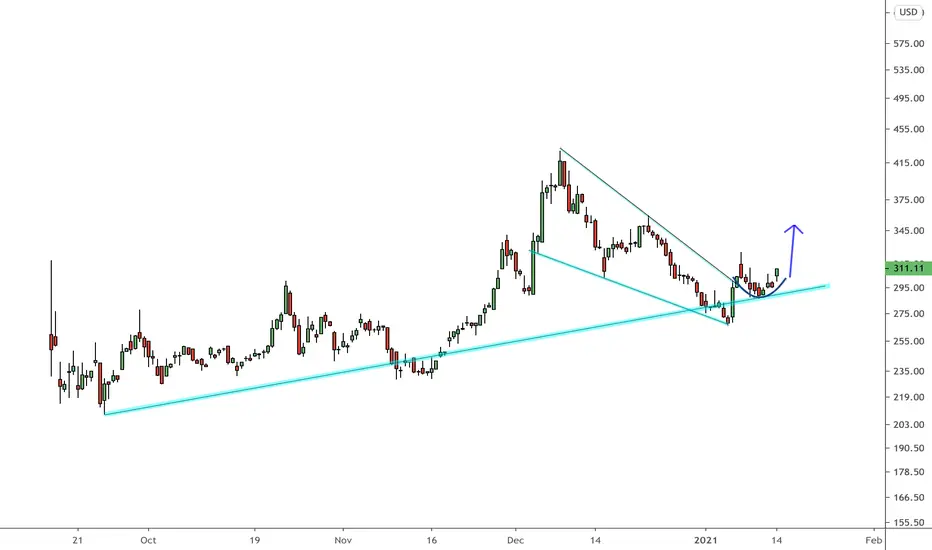
SNOW (Snowflake Inc) Long to 428Snowflake has found support at 265 putting in a recent double bottom.
Current resistance would be 318, with support at 298.
Targets above 318 would be the golden mean reversal at 341, 360, 390, and eventually a retest of the all time highs at 428
We've broken the supply line with clear bullish divergence on the oscillators.
Volume has slowed to the downside and short interest is also decreasing.
Retesting for support, and its my opinion she'll be on her way!
Under 285, id be bearish until we see a new swing high
SNOW

SNOW...ANOTHER LEG UP... 52%SNOW could be getting ready for another move up...target is $462 (52%)...just breaking out of another descending wedge pattern...currently trading back above the 50 day moving averages...macd is preparing for a bullish crossover...and hidden bullish divergence in the oscillators (yellow circles)...IT'S YOUR MONEY, DYOR!!

US stock - SNOWFLAKE reversal chartIn US stock market, SNOW have some reversal pattern.
- Stand above 21EMA now
- 2 Pull back (around 19% - 30%) and strong support level around 264.5
- Volume is increasing when the price going up on yesterday
- Lowest ATR since Nov
- We can see there may have a reversal and go back to a higher price
My buy point: 298.8
This is not financial advice. Just my point of view.


Here is why snowflake inc. will hit $330 soon The harmonic pattern is completing so we expect the bull run very soon. I will keep this chart updated. Thank you for the support.

Possible target price for SNOWGetting out of the wedge, it is ready to test 360, and 429 once again..!
Pullback to upper line of the wedge is possible..!
I always try to present the charts in a simple comprehensive format to prevent any confusion.
This is just my technical view, neither a fundamental comment,nor a recommendation to trade..!
Please review my track record and calculate the odds for yourself..!
Don't forget to like, comment, and Follow to encourage me to continue this.
You can send TradingView coins to support me publishing high quality ideas..!
Stay tuned great live stream and quality content videos coming soon..!
I would appreciate if you share my analysis on your own social media with your friends and beloved ones.

SNOW coming out of a wedge along a demand curveSNOW has a lot of potential from here. Also looks very good intraday today.
SNOW rebound forming! NYSE:SNOW
keep close eye on SNOW, currently on the last wave of five, and 4 hr MACD already shows divergence, if Tech rebound, SNOW will form a pretty support for the days to come!


SNOW READY FOR A BLIZZARD !1! Snow on the daily is getting squeezed by a bullish pennant . MACD is looking ready to flip along with squeeze momentum finally finishing its sell off. With declining sell volume as well and SNOW consistently holding up its long term support line we could see SNOW gap up to its first price target of $330. Along with the trend analysis as seen we also have to take into account NASDAQ:MSFT earnings report released today stating that they had a 17% revenue increase because of cloud business. The future is SaaS and SNOW is looking ready to snow some cash !


DDOG to 120?DDOG - Currently in a a flat correction and looking for a breakout of the triangle to retest ath. With earnings approaching (mid February) we could see a nice run up to retest ATH. This company has shown strong growth and has generated great returns since its IPO in 2019, nearly quadrupling it's IPO price in 2020. DDOG reported a 61% increase in revenue for Q3 and an outlook of a 62% increase in the year of 2020. Trading Plan annotated in the chart.
Options Ideas
--------------------
110 C 1/29 (High risk: High reward) day trade option
120C C 2/12 (Medium Risk: High Reward) High OI

SNOW Supply demand zones.Please do your own charting im new trader.
If you have some tips feel free to leave them in comments thank you.


SNOW Short I love this IPO but I am currently bearish!
Expect some healthy profit-taking to occur with a proper correction.
As. always informational only GL to all.

Let it snow2\19 350c
~pt 1: sell half at +100% to cover the trade
~pt 2: +200%
~pt 3: +300%
(duration: 14 days)

SNOW day/swing tradeBreak out of this small triangle and holding the retest and lower trend line. Sitting right at the 20 day EMA too. Great risk to reward. Expecting a strong move higher today and over the next few days/weeks.

Is $CRWD ready for an $ABC correction to $195Is $CRWD ready for an $ABC correction to $195
CRWD is definitely a leader in its space but this run looks a bit extended and exhausted along with a potential corrective wave to $195.
Use options to define risk as premium paid.
Suggested options to use: Feb 5 Weeklies $200 put trading at $4 a contract.


Called bottom on SNOW last week; now found support on the 50-emaSNOW started a reversal after hitting a fib retracement level mid last week, where I called the bottom (see linked chart) and bought some shares. Here is a summary of the current chart and my trading strategy:
BUY SIGNALS
1. +DI crossed above -DI (green line above red line) and ADX line (white) is flat but starting to curl up after the drop (signals a trend may be about to start; an uptrend in this case).
2. MACD curling up
3. Support on 50-ema, which coincides with the .618 fib extension. Seems to be strong at the moment.
TRADING STRATEGY
Now, it is not because these indicators are pointing to a bullish move that that move has to happen, after all there is only so much the charts can tell us. So to protect your capital (if you buy), you could buy at current levels with a tight stop loss just below the .5 fib level, around $293. Take into account there is support on emas on lower time frames (4hr and 1hr) between the current price and the.5 fib level so those could potentially hold the price if it breaks below the 50-ema on the daily chart. That is why you want to place your stop loss below those moving averages so you are not stopped out too early. That's what I am doing anyway. If the price falls and still triggers your stop loss but then bounces back up you can always jump back in if indicators and volume point to and upward trend. If the price continues going down you are saved from further losses. This is as minimal risk as it gets.
OTHER CONSIDERATIONS
1. Also keep in mind that millions of new shares were release from lockup last week so there may be more sellers waiting the price to move up to unload their shares. However, because we are right on support, this trade would present minimal risk if you place your stop loss accordingly.
2. Also, this analysis is contingent on how SNOW opens tomorrow. If it opens way below the current price or way above, the trading strategy might need to be adjusted. Please use your diligence if either scenario is presented.
Safe trades!
***If you get anything out of this TA, please like and follow for future updates and more TA. Thanks a lot!***
***THE IDEAS SHARED HERE ARE MY OPINION. THIS IS NOT FINANCIAL ADVISE TO PLACE TRADES. PLEASE DO YOUR OWN RESEARCH AND ANALYSIS BEFORE BUYING/SELLING STOCKS.***

Let it snowSnowflake has been a widely discussed stock over the past couple of months due to its huge move right before and after coming public. The stock has given up a lot since the highs of November and has entered into the larger range from the highs and lows of September. I am going to take a shot a buy here/ within the green rectangle with a stop below $266. I am looking for a breakout above the range around $320.

Long SNOW finally? MACD heading upStrong day for SNOW and other tech stocks today, could be the start of a good run, MACD heading up outside of oversold.
