Is the steady rate bullish for stocks?Hello community. The Fed's goal is to promote maximum employment and stable prices. So in recent times the Fed has rapidly hiked rates by 5-¼ percentage points while also reducing their security holding by $1 trillion to help influence inflation expectations.
Large companies like Amazon, Meta, Alphabet, Microsoft, Salesforce and many more began cutting their workforce in order to adjust to extant economic conditions. While price stability is key, it must not be at the detriment of conducive labor conditions. The past monetary policy tightening periods came with job losses that negatively impacted the economy. The Fed is beginning to carefully hold rates at restrictive levels so as to avert similar economic damage.
Moving from an environment of low rates to rising fed rates caused stock prices to fall rapidly. So now that the Fed is pausing the hike and giving favorable projections, investors are beginning to increase their stock holdings. Things may be coming back to normal considering the large capital raised in the recent ipos.
We project a new all time high to be made after the correction that started in January 2022 is completed.
Trade set up
Buy entry price: 4229.46
Target price: 4677.76
Stop price: 4022.85
As the trade progresses we will update the idea and indicate the time to move stops to break even. Please like and share if the idea is helpful.
Nedium Team
Snp500

#ES_F Day Trading Prep Week 2.18 - 2.23Shortened week ahead, lets break down structure and areas of interest to lean on this week.
Last Week :
We opened the week above VAH and under Key HTF Edge, we knew that this is the area where we can see size sellers step in and an area where size longs could be taking profits which creates different sets of sellers to give more pressure to the lower levels, as mentioned this could be the Edge that will stop our run at least for time being.
Market consolidated above VAH, pushed into the Edge, tagged 5066.50 to the tick and failed to take it out which gave a nice sell back into VAH. Tuesday before the data we knew we had Supply trapped above and if Key Support gets taken out we can see a move lower and if we followed down level to level we ended up testing the bottom Edge, taking out one of the weak lows but we only had enough to barely take it and found buying again. By end of the week we ended up back in 5013.75 - 5066.50 Range and Friday we balanced inside under the Key Resistance without tagging it and with a few Key Support tests.
This Week :
Market closed on Friday inside Key Support with what looked like end of day break but Globex opened and pushed away from Key Support again keeping us inside 5013.75 - 5066.50 Range for now. We have a shorter week coming and question is will we stay consolidating in this Current Range and try to push out of VAH towards the Edge again or will the market stay inside Value with a possible move through the Mean towards VAL.
If we end up holding under VAH under 5048.75 - 45.75 // 34-31 areas could bring in weakness once enough supply builds up to break Current Key Support and if that happens we could target move to lower levels towards VAL, we have to be careful looking for too much downside unless Key Levels break and market shows continuation because we could stay balancing inside our Value unless stronger volume comes in. First targets under to watch would be 5001.75 - 97.75 and VAL top at 4988.25 - 84.25 which could find buying to hold us over, if not we have Key Support at 4972 - 67 which we would need to take out for any continuation towards bottom Edge.
If we do end up holding this range and can't take out Current Key Support, we can see more balance in Current range again and if enough buying comes in and we can take out upper Resistance areas at 5034-31 we would need to hold over 5041.50 and take out 5048.75 - 45.75 to see another attempt at the upper Edge. We would need to take out and accept over 5066.50 - 60.75 for any more upside from this range and above target would be towards the top of the Edge where we could watch for failure or continuation.
Area over 5066.50 - 60.75 is big Resistance for now and if we finally have selling from size longs and shorts don't need to pay over Value too much then we could continue to hold under so need to be careful with any pushes over 34 - 41.50 area as they may not hold unless we get strong buying through them.
Levels to Watch :
Current Resistance 5034 - 31 // 5048.75 - 45.75
Key Resistance 5066.50 - 60.75
Targets if above 5086.25 - 81 - 77.75
Current Key Support 5019 - 13.75
Targets below 5001.75 - 97.75 // 4988.25 - 84.25 Needs to break for attempt lower
Key Support 4972 - 67 Would need to hold under for any continuation towards lower Edge.

#ES_F Day Trading Prep Week 02.11 - 02.16Lets check out market structure from last week and see what we can lean on this week.
Last Week :
Last week started off at VAL of current HTF Range, market opened Sunday over Key area but wasn't able to hold over which provided sells back towards the Edge but was only able to hit a couple lower targets before it found more buying at and over the Edge which told us we weren't ready to continue lower from there. Once we got over and held 72-67 area as Support which brought in more buying, we took out 88-84 Resistance which trapped shorts below and gave a nice push towards higher targets. We hit resistance at Key Area of 5019-13.75 but market again wasn't able to get back under the mean and instead we created a cost basis, got over Key Resistance and pushed to test VAH. First VAH Test in Pre-market gave a nice sell back into previous Key Resistance but failed to break making it our Support, once selling over 28.50-34 area ran out we were able to continue to next level up at 48.75-45.75 which provided Resistance for the day.
This Week :
So far Friday market was able to hold VAH and gave a push over it end of day. Going into this week we have a Cost Basis at the Mean area of the HTF Range and we have our Key HTF Edge right above us which is a great spot for profit taking from size longs.
This to me is kind of hinting on possible balance action inside our new range which is 5013.75 - 5066. Cost Basis at the Mean could provide the needed Support and the selling from/under the Edge could provide the needed resistance to keep us inside this range until we either have enough Supply/Volume to break back under and continue towards VAL or give another consolidation and if more buying comes in try to push through the Edge.
I feel like this Edge is the one that will kind of stop this train from going further, of course we never know and can continue if buying comes in but if not this is a perfect spot for market to find good HTF Resistance and start a distribution process under it filling in the shorts who got trapped on the way up, holding the market here will also bring in new buyers as well who will be looking for continuation higher towards 5100 but if they aren't strong enough to actually push us through this area then that would be our Supply when we are ready to accept back in Value and head for VAL. This might take time to play out and wont be surprised if we spend the whole week in this current Range without acceptance over/under for now. We could see tests out of Key areas but need to be careful for continuations from them.
I will be looking to trade back and forth level to level inside this 5066 - 5013.75 Range until I see acceptance over/under.
Levels to Watch:
Current Resistance 5048.75 - 45.75
Key Resistance 5065.75 - 60.75
IF Accept Over Next Level up is 5077.75-81 Area
Current Support 5034 - 31 - 28.50 Area
Key Support 5019 - 13.75
Would need to hold under to see anything lower
IF it does levels under are 5001.75 - 4997.75 // 4988-84.25

Combined US Index potential breakdown imminentHere is how I see it...
1. MACD Bearish divergence on both MACD and VolDiv and being extended further, increases probability of a retracement happening;
2. Sequential counts completed... retrace ent could begin within the next 5 candles;
3. Candlestick pattern shows a toppish doji;
4. SG10Y heads up for volatility and retracement incoming,
So there... heads up!!! Going down for a good bit.

SG10Y suggesting another round of volatility Track record of tracking the SG10Y yields in giving heads up to the S&P500 or US market direction has been quite uncanny...
This time, the technical outlook for the SG10Y is suggesting a breakout, and in doing so, should see market volatility to the downside.
MACD is suggesting a potential breakout, as is a recent close to the high and breaking the Fibonacci fan resistance.
Any quick pop up would be confirmation of market volatility being imminent.

S&P 500 2024-2025 OutlookSP:SPX is not going to crash in the Q1 or Q2 2024. I have measured that we will continue the rally atleast until the resistance zone around 5200-5800.
I used fibonacci retracement to determine the rally target and the pullback target. If we topped at 5200-5800, we will most likely drop to the support area around 3500-3200. I highlighted some area in the RSI graph, if we reached that area we most likely will have a pullback. Another case is if we still continue the rally up until 7000-8000, an economic bubble perhaps, the crash would be more deadly.
Overall i think 2024 will be good for people to make money and prepare for a major crash. Stocks & crypto will be making new all time highs, the first two quartals should be fine for us. Fourth quartal will be the most decisive because of US election, could turn very good or very bad. My advice is to also follow all the latest news about geopolitical tension, we might have a world war 3 or at least a major war that will play a very big factor on the economy in general.
Prepare.

buy microsoftmicrosoft is doing good with gamepass and chat gpt also.
This bad boy is about to blow to 315 soon>
I see some exciting pattern from the chart.
Looks like earning will be nice also.

✅SPY BULLISH BREAKOUT|LONG🚀
✅SPY is trading in an
Uptrend and now we are
Seeing a bullish breakout
Of the key horizontal level
Of 479.88$ and the breakout
Is confirmed which reinforces
Our bullish bias and makes us
Expect a further move up
LONG🚀
✅Like and subscribe to never miss a new idea!✅

S&P 500 Rally InboundOverall Order Flow is Bullish, And With this Market Maker Buy Model I see it rallying Today,
And with that Breaker in Mind I can see it Trading Down into that Creating a Judas Swing,

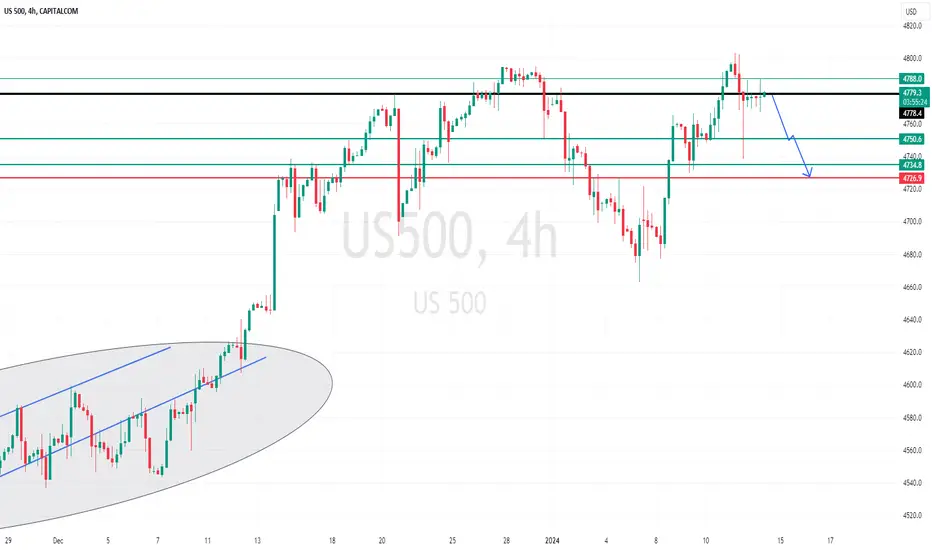
US500. high are placed? or not?#US500 (S & P)... market sustain from lat couple of 4 hours candle.
and as we discussed in our perveious us500 analysis that 4780 is market resistance area.. market break it but did not sustain above that area,
now again that is our resistance area if market hold it then now drop expected from here,
keep in mind guys that is market key level 4780.
manage accordingly.
trade wisely
good luck
sharp fall is expected in global marketI analyzed s&P500 index today but it includes all of global markets.
dollar index's power is gaining strongly.
Biden's economic strategy with china seems not working well and USA and China's bond are too tight since 2008 financial crisis. the second possible Lehman brother's crash is on the way.
I don't know which banks will lead the crash but this time it will be wider and wild.
MACD is getting weaker and Russia's sharpy raising interest 350bp hikes is also the issue.
The too much unsolved disasters are on the way which is not good for all traders.
Higher high, the Lower low.

SNP likely flipping lower...looking for shorts on h1 etc...Hello fellow traders , my regular and new friends!
Welcome and thanks for dropping by my post.
Flipping on the index to the downside, correlating with the strengthening in USD?Let's see...
Do check out my stream video for the week to have more explanation in place.
Do Like and Boost if you have learnt something and enjoyed the content, thank you!
-- Get the right tools and an experienced Guide, you WILL navigate your way out of this "Dangerous Jungle"! --
*********************************************************************
Disclaimers:
The analysis shared through this channel are purely for educational and entertainment purposes only. They are by no means professional advice for individual/s to enter trades for investment or trading purposes.
*********************************************************************

US500/S&P hold his resistance ? keep close#US500.. well guys now a deep look on us500 chart. market smoothly trade with higher high pattern and now market is at his upside resistance area,
4780 will be our resistance area if market hold it then now a dip or retrace expected from here.
keep close it and don't be lazy here,
if not hold then upside areas will update in our next idea about s S&P
trade wisley
good luck

SPY Will Go Down! Sell!
Hello,Traders!
SPY went up to retest
A horizontal resistance level
Of 480$ from where I think
We will see a local
Bearish correction
Towards the horizontal
Support level below at 460$
Sell!
Like, comment and subscribe to help us grow!
Check out other forecasts below too!

✅SPY POTENTIAL SHORT🔥
✅SPY price grew again to retest the resistance of 480.00$
But it is a strong key level
So I think that there is a high chance
That we will see a bearish move down
SHORT🔥
✅Like and subscribe to never miss a new idea!✅

SPY Bullish Breakout! Buy!
Hello,Traders!
SPY is trading in an uptrend
And the price broke the key
Horizontal level of 460$
Which is now a support and
After the pullback and retest
I will be expecting a
Bullish continuation
Buy!
Like, comment and subscribe to help us grow!
Check out other forecasts below too!

S&P500 Retracement 07.12.2023The U.S. benhmark indices are currently experiencing high volatility and large deviations from the mean.
Yesterday the S&P500 dropped heavily and has not retraced fully after reaching the important support at near 4550 USD. This might be completed today with the index price reaching the 61.8 Fibo level at least as indicated by the arrow.
__________________________
Information Regarding Important News and Figures can be found here in our Economic Calendar: mau.bdswiss.com/economic-calenda...
Risk Warning: Trading in CFDs is highly speculative and carries a high level of risk. It is possible to lose all of your invested capital. These products may not be suitable for everyone, and you should ensure that you fully understand the risks taking into consideration your investment objectives, level of experience, personal circumstances as well as personal resources. Speculate only with funds that you can afford to lose. Seek independent advice if necessary. Please refer to our Risk Disclosure.
BDSwiss is a trading name of BDS Markets and BDS Ltd.
BDS Markets is a company incorporated under the laws of the Republic of Mauritius and is authorized and regulated by the Financial Services Commission of Mauritius ( FSC ) under license number C116016172, address: 6th Floor, Tower 1, Nexteracom Building 72201 Ebene.
BDS Ltd is authorized and regulated by the Financial Services Authority Seychelles (FSA) under license number SD047, address: Tenancy 10, Marina House, Eden Island, Mahe. Payment transactions are managed by BDS Markets (Registration number: 143350).

Data-Driven Bearish Option SentimentTo complete the image, it is necessary to encourage the bulls with the sharp upward movement. After a drop below 4500 occurs, it will indicate the beginning of a correction.

✅SPY TIME TO SELL|SHORT🔥
✅SPY is set to retest a
Strong resistance level above at 459$
After trading in a local uptrend for some time
Which makes a bearish pullback a likely scenario
With the target being a local support below at 452$
SHORT🔥
✅Like and subscribe to never miss a new idea!✅

SPY Potential Short! Sell!
Hello,Traders!
SPY has almost reached
A horizontal resistance
Level of 459$ and the
Index is locally overbought
So a local bearish correction
Is to be expected I think
Sell!
Like, comment and subscribe to help us grow!
Check out other forecasts below too!

ES 6H OverviewOverview
ES is currently trading within a range from 4541 to 4508. Should the levels of 4500-4508 remain supportive, the next upward target is the supply zone around 4555. If it falls below 4500, a noteworthy area is approximately at 4485. Further down, there's a significant break and retest zone at around 4430.
Key Levels
Range: 4508-4541
Supply: 4555
Area of Interest: 4485
Break and Retest: 4430

SNP500 & My BIG SHORT - Recession TradeSPX is destined to drop hard, back to 2009 lows.
I decided to go short, to catch the next Market Crash.
It's the previous Wave 4 of a lesser degree.
If you know Elliott Wave as I do, then you are getting ready too.
In my opinion SPX500USD has topped a Wave 5 of a large degree.
More info on that in my Full Wave Count for that 150y old chart.
Here's a picture on that SPX500 / US500 Monthly Chart:
Now, what are the main reasons behind my BIG SHORT on US500.F ?
1. The Volatility Index (VIX) is showing a Fractal, the 2007-2009 same/exact sequence.
2. The United States Consumer Confidence Index (USCCI) is telling me that Consumers are entering the Fear Period.
3. The Federal Reserve Funds Rate (FEDFUNDS / FRED) has broken out of an important Downtrend.
4. The US Inflation Rate (USIRYY) is saying that a full-blown war has started.
5. The 10y Treasury Note Yield (TNX) just broke out of a 40y Downtrend.
6. The US 10y Government Bonds (US10 / US10Y / USB10YUSD) finalized a big bearish leg.
7. The Crypto Market Cap (TOTAL) & Bitcoin (BTCUSD) : The Golden King is taking over.
I know what you might be thinking: SPXUSD could actually do one last Bullish move, an overshoot in the last of the last 5th, right?
In this case, the Wave Count on ES1! could be one step behind, and the Impulse Extension in the 5th of 5th was left out.
Yes, that could be a scenario as well, and I will get burnt.
However, I do not think that's the case, so I am loading my Shorts on SPX500USD !
I could not help but noticing that SPX500 is doing the same Fractal Sequence it did on the previous 2007-2009 Recession.
My Sell Orders & Trading Signals on the SPX Market Crash:
* Aggressive Entry: @ Market Price ($3960)
* Moderate Entry: @ $4500 with SL @ 4900
* Conservative Entry: @ 4700.0 with SL @ 5400
* Position Trading: Sell Stop @ 3700.0 with SL @ 4800.0
* Targets @ : $3200 / $2750 / $2500 / $2200 / $1800 / $1400 / $1100
* Safety measures: when in the green, moving SL @ BE.
Good luck and many pips ahead!
Richard, the Wave Jedi.

The Expected Bounce was on Queue. Tomorrow We Drop.Traders,
We have been batting 1000 lately when it comes to the SPY. Might as well make another bold prediction. It would seem that the greatest probability of price action is outlined in the chart. An inverse H&S is forming and the right shoulder has yet to start.
I predicted the target down from the last H&S pattern to be 410. That was hit, almost to the dollar. I then predicted a huge bounce. We have that now. In fact, 7 days of green candles! Amazing. I even predicted the timing of the bounce. The charts gave me all of this data. I just had to read it correctly.
Now, the chart is telling me that it's time for a bit of a pause. If correct, we should see the right shoulder from that inverse H&S drawn now begin to form. If we're lucky we stay in my outlined green channel by using that 200 day ma near the bottom of the channel as support.
Blowoff top underway!
LFG!
Stew
