SNX : SIGNALHello friends
Given the good growth we had and the arrival of buyers, now that the price is correcting, there is a good opportunity to buy in steps with risk and capital management and move towards the specified goals.
*Trade safely with us*
SNXBTC

#SNX/USDT — Recovery Mode?#SNX
The price is moving within a descending channel on the 1-hour frame, adhering well to it, and is heading for a strong breakout and retest.
We have a bearish trend on the RSI indicator that is about to be broken and retested, which supports the upward breakout.
There is a major support area in green at 1.20, representing a strong support point.
We are heading for consolidation above the 100 moving average.
Entry price: 1.30.
First target: 1.37.
Second target: 1.45.
Third target: 1.55.
Don't forget a simple matter: capital management.
When you reach the first target, save some money and then change your stop-loss order to an entry order.
For inquiries, please leave a comment.
Thank you.

SNX Rebuy Setup (12H)Before anything else, pay attention to the timeframe.
From the point marked Start on the chart, it appears that a bullish phase has begun on SNX.
Currently, it seems we are at the end of Phase A. After some time correction and price consolidation, we can expect another bullish wave forming Wave C.
In the green zone, we can look for buy/long positions.
Targets are indicated on the chart.
If a daily candle closes below the invalidation level, this analysis will be invalidated.
For risk management, please don't forget stop loss and capital management
When we reach the first target, save some profit and then change the stop to entry
Comment if you have any questions
Thank You

#SNX/USDT Fast Money Moves — SNXUSDT SCALP Setup#SNX
The price is moving in a descending channel on the 1-hour frame and is expected to break and continue upward.
We have a trend to stabilize above the 100 moving average once again.
We have a downtrend on the RSI indicator that supports the upward move with a breakout.
We have a major support area in green that pushed the price higher at 1.14.
Entry price: 1.21.
First target: 1.20.
Second target: 1.230.
Third target: 1.264.
To manage risk, don't forget stop loss and capital management.
When you reach the first target, save some profits and then change your stop order to an entry order.
For inquiries, please comment.
Thank you.

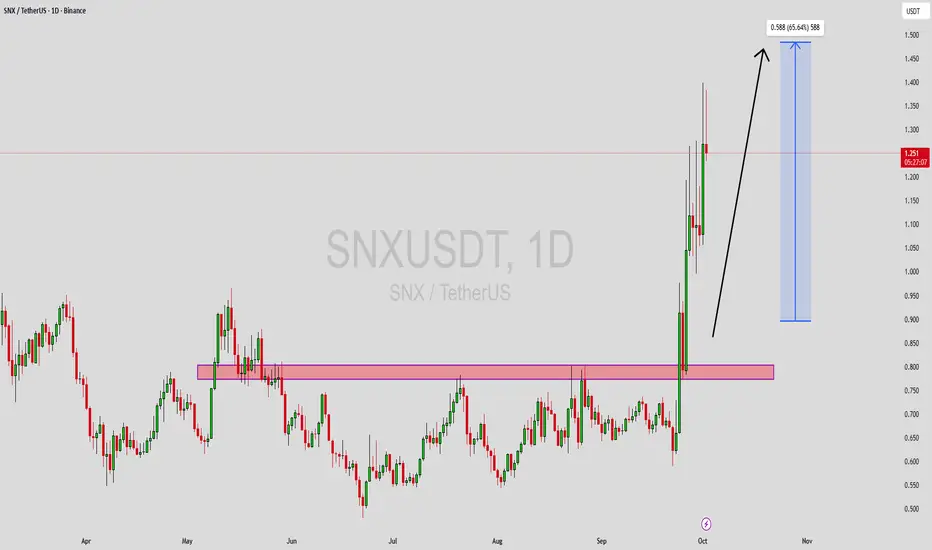
SNXUSDT Forming Bullish MomentumSNXUSDT has recently shown a strong bullish breakout, pushing above its key resistance zone with solid momentum and good trading volume. This breakout suggests that the pair could continue its upward trajectory, with expectations pointing towards a potential 40% to 50% gain in the coming sessions. The market structure is favoring the bulls, and the consistent buyer interest indicates growing confidence in this project.
The chart highlights how SNX has reclaimed a critical price level that had previously acted as resistance. Holding above this zone strengthens the bullish outlook, as it confirms that investors are actively accumulating positions. With healthy liquidity and rising participation, this setup aligns well with the technical breakout structure.
Investor sentiment is also improving, and the potential upside remains strong if volume continues to support the current rally. As long as the price sustains above support levels, SNXUSDT could become one of the more attractive plays in the current crypto market environment.
✅ Show your support by hitting the like button and
✅ Leaving a comment below! (What is You opinion about this Coin)
Your feedback and engagement keep me inspired to share more insightful market analysis with you!
SNX ; BEARISH!!!Hello friends
Given the growth we had, you can now see that the price ended the trend at the ceiling of a large candle and the sellers covered it with another large candle.
Now we have a resistance area in the middle of this candle from which the price is expected to correct and move to the specified targets.
*Trade safely with us*

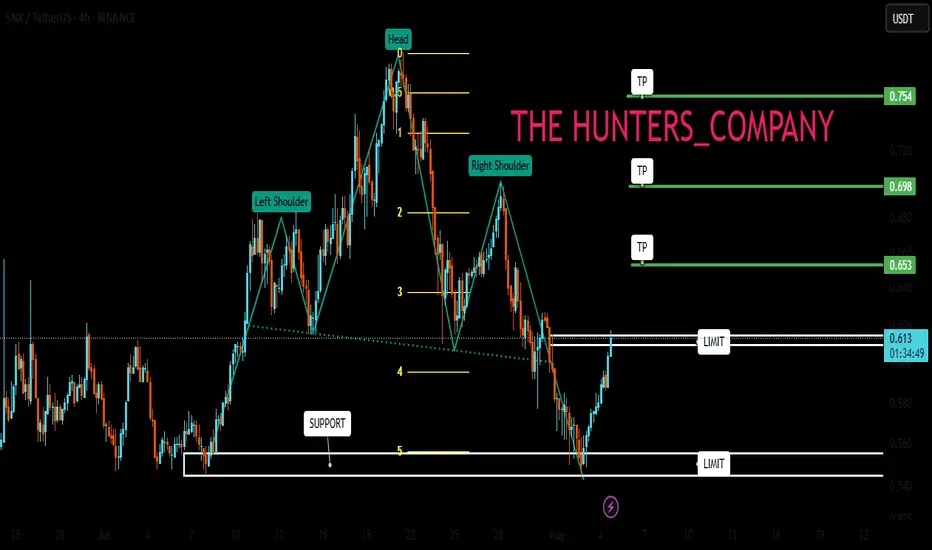
SNX : Has the climb started?Hello friends🙌
👀According to the shoulder and shoulder pattern that was formed and then the price fell in the support area that we identified for you with Fibonacci, buyers entered and provided good support for the price, which also broke our resistance, which creates a good opportunity to buy, of course with risk and capital management.
🔥Follow us for more signals🔥
*Trade safely with us*
#SNX/USDT#SNX
The price is moving within a descending channel on the 1-hour frame, adhering well to it, and is heading for a strong breakout and retest.
We are seeing a bounce from the lower boundary of the descending channel, which is support at 0.827.
We have a downtrend on the RSI indicator that is about to break and retest, supporting the upward trend.
We are looking for stability above the 100 moving average.
Entry price: 0.880
First target: 0.900
Second target: 0.943
Third target: 0.977

#SNX/USDT#SNX
The price is moving within a descending channel on the 1-hour frame, adhering well to it, and is heading for a strong breakout and retest.
We are seeing a bounce from the lower boundary of the descending channel, which is support at 0.711.
We are seeing a downtrend on the RSI indicator that is about to break and retest, supporting the upward trend.
We are looking for stability above the 100 Moving Average.
Entry price: 0.744
First target: 0.765
Second target: 0.785
Third target: 0.811

SNXUSDT Bouncing from Channel SupportSNXUSDT Technical analysis update
SNXUSDT has been trading inside a clear descending channel for the last 1700 days. Recently, the price touched the lower support of the channel and is now showing signs of a bounce.
If the current momentum continues, SNX could move upward toward the upper resistance of the channel. A breakout above the upper trendline would be a strong bullish signal. Until then, the price may stay within the channel.
Price could move 100%-250% in a few months.

SNX Analysis (1D)SNX has broken an old trigger line and is also forming a CP within a channel.
We are looking for buy/long positions in the Demand zone.
Targets are marked on the chart.
A daily candle closing below the invalidation level will invalidate this analysis.
Do not enter the position without capital management and stop setting
Comment if you have any questions
thank you

#SNX/USDT#SNX
The price is moving in a descending channel on the 1-hour frame and is expected to continue upwards
We have a trend to stabilize above the moving average 100 again
We have a descending trend on the RSI indicator that supports the rise by breaking it upwards
We have a support area at the lower limit of the channel at a price of 2.16
Entry price 2.20
First target 2.24
Second target 2.31
Third target 2.40

#SNX/USDT
#SNX
We have a bearish channel pattern on a 12-hour frame, the price moves within it, adheres to its limits well, and is expected to break it upwards strongly.
We have a support area at the lower border of the channel at $2.50 from which the price rebounded
We have a tendency to stabilize above moving average 100
We have a downtrend on the RSI indicator that is about to break higher, supporting the price higher
Entry price is 2.60
First goal 3.26
The second goal is 3.60
The third goal is 4.20

SNXUSDT Signals Bullish Move AheadSNXUSDT Technical analysis update
BINANCE:SNXUSDT has been ranging at the bottom for the last 120 days. The price has now broken out above the resistance line with high volume and is trading above the 100 EMA, signaling a bullish trend. This breakout indicates the potential for a strong bullish move in the coming days.
Buy zone : Below $1.77
Stop loss : $1.50
Take Profit 1: $1.99
Take Profit 2: $2.40
Take Profit 3: $3.30
Thank You
Hexa🧘♀️

SNX buy setup (12H)SNX seems bullish. We have iCH on the chart and important trigger lines have been broken and it has stabilized on the upper orderblock range.
By keeping the last OB, you can move towards the targets.
Closing the daily candle below the invalidation level will violate this analysis.
Do not enter the position without capital management and stop setting
Comment if you have any questions
thank you

SNX looks ready tooLot of great setups on the market now... lot of super bullish structures and SNX is one of them.PA and TA is pure bullish. Target red MA. GL. If you have any questions, let me know in comments.
NOT A FINANCIAL ADVICE + MANAGE YOUR RISK AND USE STOPLOSS

SNX mid-term analysisSNX is trading below a bearish trend line.
The big SNX structure is completely bearish.
It is expected to reach the demand range in the medium term and then move upwards.
We are looking for buy/long positions in the demand range.
Closing a weekly candle below the demand range will violate the analysis.
Note that the financial market is risky, so:
Do not enter a position without setting a stop and capital management and confirmation and trigger.
When we reach the first TP, save some profit and try to move the stop continuously in the direction of your profit.
If you have any comments please post them, comments will help us improve our performance
Thanks

#SNX/USDT#SNX
The price is moving within a descending channel pattern on the 4-hour frame and broke it upwards after adhering to it significantly
We have a downtrend on the RSI indicator and it was broken upwards and we have a trend to stabilize above it
We have a major support level in green at a price of 1.60
We have a trend to dot higher than the moving average 100
Entry price 1.72
First target 1.88
Second target 1.98
Third target 2.11

SNX buy setupSNX seems to be getting ready to move to the supply side.
A bullish CH and hitting higher bottoms is a bullish sign that we have on the chart.
The target is supply
Closing a daily candle below the invalidation level will violate the analysis
Note that the financial market is risky, so:
Do not enter any position without confirmation and trigger.
Do not enter a position without setting a stop.
Do not enter a position without capital management.
When we reach the first TP, save some profit and try to move the stop continuously in the direction of your profit.
If you have any comments please post them, comments will help us improve our performance
Thanks

#SNX#SNX
The price is moving in an upward trend on a 4-hour frame, and the price is about to bounce back higher
We have a Resin support area at $4.34
We have a downtrend on the RSI indicator that is about to touch it again
We have a higher stability moving average of 100
Entry price 4.34
The first target is 4.65
Second goal 4.91
Third goal 5.17

$SNX typical market cycle (psychology)Pretty clean chart for $SNX.
- years of wyckoff accumulation
- higher lows
- riding weekly MAs
in my opinion it appears to be a typical market cycle progressing within the defi space. it's kind of doing its own thing while retail speculates on other coins. This is one of those set it and forget it type of charts. Looks like it wants to break out in the coming months. I recommend more of a position trader mindset.
invalidation under 3 bucks (if it decides to turn back over).
doesn't hurt to give this one a chance.
will you take it?

SNX has formed a bullish flagSNX has formed a bullish flag
🔵Entry Zone 4.476 - 4.605
🔴SL 4.233
🟢TP1 5.158
🟢TP2 6.078
🟢TP3 8.018
Risk Warning
Trading Forex, CFDs, Crypto, Futures, and Stocks involve a risk of loss. Please consider carefully if such trading is appropriate for you. Past performance is not indicative of future results.
If you liked our ideas, please support us with your likes 👍 and comments.

SNX ANALYSIS (4H)On the chart, from where we entered "START", we seem to see a correction.
This correction seems to be a diametric.
There was a suitable place for the termination of the F wave on the chart, which we marked with red color.
If the price reaches this range, you can enter a sell/short position.
For risk management, please don't forget stop loss and capital management
When we reach the first target, save some profit and then change the stop to entry
Comment if you have any questions
Thank You
