Synthetix SNXUSDT - Bullish Head and Shoulders + Strong coin- Last 3 month we had a consolidation (Head and Shoulders pattern)
- Now we are breaking up to new all time highs
- Next target can be 1.618 fib extension (Around 14 USD)
- RSI looks great on the daily chart
If you want more of these ideas, hit the like button and follow me, so you don't miss any update!
Also, check my signature down below ↓
SNXUSD

Synthetix SNXUSDT Head and ShouldersHead and shoulders formation really impressive with impressive volume
buy the breakout above 5.8 $ and hold
630 million market cap very big market not like other shit coin
huge market cap still looks good for trade

SNX Price at Supportprice at support zone
good buy area
Buy : 2500 - 2530
Stop : 1800 sats
Target : 2650 , 2800 , 3000 , 3300 , 3500

✳️Synthetix Network/USDT (8/12) View + Trading Plan #SNX $SNXSNX is on a very strong recovery after falling from 5.5$ to 3.5$ and currently SNX is consolidating the 5-5.5$ zone as a springboard for a breakout to the 6.5$ zone and even the 9$ and 10$ zone this December
However, if SNX is still rejected at 5.5$, it will correct to 4.5$ and then rebounds. The 4.5$ zone is the last support zone for this uptrend.
📈BUY- LONG
-Buy: 5.5-5.75$ if A. SL if B
📉SELL-SHORT
-Sell: 6.5-6.75$ if B. SL if A
-Sell: 8.75-9$ if B. SL if A
-Sell: 10-10.5$ if B. SL if A
♻️BACK-UP
-Sell: 5.5-5.75$ if B. SL if A
-Buy: 4.25-4.5$ if A. SL if B
-Sell: 4.25-4.5$ if B. SL if A
-Buy: 3.5-3.75$ if A. SL if B
-Sell: 3.5-3.75$ if B. SL if A
-Buy: 2.25-2.5$ if A. SL if B
❓Details
Condition A : "If 1D candle closes ABOVE this zone"
Condition B : "If 1D candle closes BELOW this zone"

SushiSwap and Synthetix lead DeFi tokens in recovery
The cryptocurrency market is in consolidation but SNX and SUSHI are flying the bullish flag high.
Synthetix is poised for a 60% upswing above the ascending triangle pattern.
The cryptocurrency market is awfully quiet since the week started. The weekend session saw some considerable movement, amid the push by the bulls to recover from the losses incurred last week. However, SushiSwap (SUSHI) and Synthetix (SNX) appear to have broken away from the rest to post the biggest double-digit gains among the top 50.
SushiSwap breakout eyes $3
SUSHI/USD is up 13% in the last 24 hours. Recovery was significant after the dip to levels slightly under $2. An ascending parallel channel has come into the picture and even boosted the price action after the middle boundary resistance was broken.
Meanwhile, SushiSwap is trading at $2.6 while dealing with the uphill battle of breaking above the channel's upper boundary. The Relative Strength Index seems to have reinforced the bullish outlook with its movement into the overbought region. SUSHI is likely to continue with the upward motion until the RSI starts to reverse due to overbought conditions.
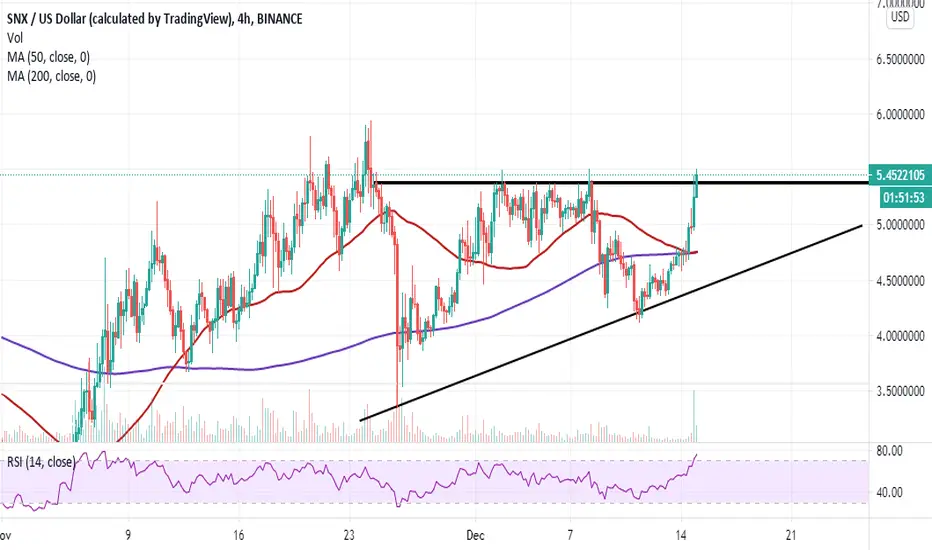
Synthetix rally is in the initial stages
Synthetix has rallied over 16% in the last 24 hours. The decentralized finance token is trading at $5.45, as bulls push to sustain gains above the already broken x-axis of the ascending triangle pattern. The RSI is in tandem with the upward momentum, moving higher within the overbought region.
If the breakout above the triangle is sustained, Synthetix could swing upwards by 60% to trade close to $10. For now, rising above the hurdle at $6 is key for the continuation of the uptrend. On the downside, a correction will seek refuge at $4.75, a region highlighted by the 50 SMA and the 200 SMA.
What if SNX breaks through the Structure? Can we expect 100% Up?What if SNX breaks through the Structure?
SYMBOL: SNX,SNXUSD,SNXUSDT,SNXUSDTP,CRYPTOCURRENCY
Trade close manually when: the above ribbons turns Yellow or better Red.
I appreciate your like or comment. Welcome to share your idea here.
DISCLAIMER
This is only a personal opinion and does NOT serve as investing NOR trading advice.
Please make your own decisions and be responsible for your own investing and trading Activities.

Snxusdt triangleBuy a breakout of the triangle and a close above the yellow line
Tp on the green lines

SNXAlso longed this one.
Break above range mean and I think range high and that clean high around $5.8 are next.
George1 Call


SNXUSDT and easy trade to followIm bullish sorry for being bullish, is this one get rejected on the first vertical or horizontal resistance or if this one loose the vertical support that is maintaning the bullish trend STRONG BUY ZONE but better be on the train with risk managment than be outside good potencial R/R.

SNX (Y20.P5.E1).Stalking a breakout tradeHi All,
Looking at the 12 HRLY chart, and waiting for the 3 touch and a breakout after that.
SNX has huge potential
Close up
12 HRLY chart
Potential macro targets if it breaks through
2 day indicators are bullish, as it doesn't have much history to gather larger time frames
Ensure you have alerts set on via Tradingview.
All the best,
S.SAri

SNX Synthetix Network Token Trendline - snxbtc snxusdt snxusdSNX Synthetix Network Token Trendline - snxbtc snxusdt snxusd

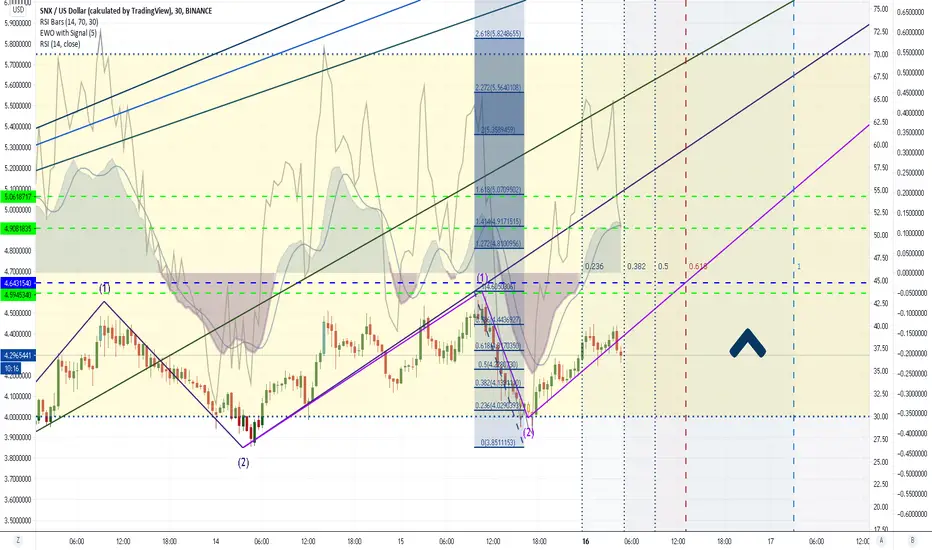
Synthetix about to go Supernova. SNXUSDOn the Binance chart, it just looks like have too many started fractals to count. I have confirmed pivot (blue line), so all this potential growth is that much more real. Yet, still in early stages confirmed by 1-2 1-2 patterns. I suppose my preliminary goals would by first W1max then FibExtensions at 1.4 then 1.6. Either way, strong evidence that we are going up on this one. Some preliminary targets are painted in in green, and invalidation in red as always. Good luck, traders - and remember nothing I ever say is financial advice. Do your own work and make up your own mind.
✳️Synthetix Network/USDT (1/11) #SNX $SNX #SNXUSDTAfter breaking the Descending Triangle pattern, SNX is now heading to the 1.5$ zone. However, there is likely to be a significant buying force in the 2.5-2.75$ zone and we can believe in for target 3.5$.
If the 1D candle closes above the 3.5-3.75$ zone, the SNX easily rises to the 5$ zone.
📈BUY- LONG Strategy
- Buy: 2.5-2.75$. Stoploss if B
📉SELL-SHORT Strategy
- Sell: 3.5-3.75$. Stoploss if A
- Sell: 5-5.25$. Stoploss if A
♻️BACK-UP Plan
- Sell close to 2.75-3$. Stoploss if A
- Buy: 2.5-2.75$. Stoploss if B
❓Details:
Condition A : "If 1D candle closes ABOVE this zone"
Condition B : "If 1D candle closes BELOW this zone"

Synthetix SNXUSDT - Rectangle and bearish triangle- Looking terrible for this alt coin
- The price is currently moving sideways, forming this bearish rectangle - continuation pattern
- The price is below 2 trend lines, which is bad
- Expecting lower prices in short term
If you want more of these ideas, please hit the like button and follow me, so you don't miss any update!
Also, check my signature down below ↓

Snx/usdt break support level soon ?Snx/usdt tested this strong support 4 times before
And every time it touched it ...it give good bounce
Now its the 5th time and i expect it will break the support this time as repeated test same support makes it weaker
Also btc Dominance now is in increase and this one can do good profit in shorting
Wait close below that level if looking for more confirmation and short when retest as a resistance
Next potential support the can give some bounce is around 2.9$ - 2.7$

SNXUSDTSNXUSDT brokedown below the descending triangle support.
Bearish signal ⬇️
RSI breakdown confirmation 🔽.

Synthetix SNXUSDT - Descending triangle is breaking down!- Looking very bad for SNX coin right now
- The descending triangle is already broken, so we can expect much lower prices in the immediate short term
- You can profit by using futures market (short position)
If you want more of these ideas, please hit the like button and follow me, so you don't miss any update!
Also, check my signature down below ↓

Synthetix SNXUSDT - descending triangleYou can short SNX on crypto futures market, if you want to profit from upcoming crash. There is an descending triangle, which is a bearish pattern. Also, the major trend line is broken and bulls could not defend the trend line.
Please, hit the like button and follow me for more of these ideas!
Also, check my signature down below ↓

Speculative SNXUSDT longAlthough lower timeframe presents a lower high, this is a very speculative long based on:
Support from a 2W high
Using Binance Funding and Premium Index as a leading indicator
Importantly, DXY not pumping

SNX Buy opportunityat this time, SNX will be short to 4$ area, after that 4$ area could perfect for long to 6.5$
let's see what's happens?
plz share & comment your opinion here.
if you like this, i appreciate to following for viewing my next analysis.

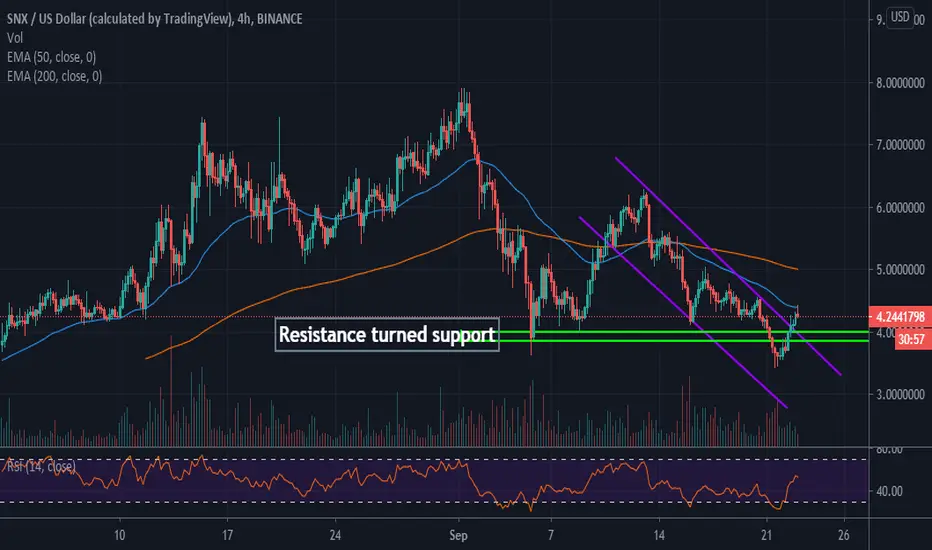
Synthetix Technical Analysis: SNX Flips Resistance Into Support
Synthetix price bounces off support at $3.40 in readiness for a breakout to $5.00.
SNX/USD is drawing closer to the resistance at the 50EMA, likely to delay the bullish scenario.
Synthetix Network Token price fell in tandem with other decentralized finance (DeFi) tokens. The lending, borrowing, and liquidity ecosystem has been dealt a heavy blow amid the downtrend in the market. Synthetix cut short the recovery staged following the dip in the first week of September. A step above $6.00 was key for the bull run towards $10.00 but it found the bulls exhausted and the bears ready for revenge.
The declines followed the confines of a parallel descending channel. Support at $3.40 came in hardy, preventing the bearish leg from extending to $3.00. A reversal is currently underway. SNX has already stepped above $4.00, support confirmed earlier in September. Moreover, the DeFi token trading above the parallel channel, after a bullish flag confirmation.
The uptrend is highlighted by the Relative Strength Index (RSI), after a sustained recovery from the oversold region. If the RSI maintains the positive gradient into the overbought zone, SNX is likely to continue with the uptrend aiming for levels above $5.00.
The resistance at the 50 Exponential Moving Average (EMA) must, however, come down for the expected gains to materialize. More hurdles are envisaged at the 100EMA in the 4-hour range. On the flip side, short term support at $4.00 must be guarded at all costs. Otherwise, SNX could resume the downtrend, eyeing $3.00.
Synthetix Intraday Levels
Spot rate: $4.25
Relative change: -0.025
Percentage change: -0.8%
Trend: Bullish
Volatility: High
SNXUSDT:Good opportunity for LongAt 12H, the cloud is directing upward, indicating an uptrend. The RSI moved down and the price found support on the Ichimoku cloud .
At H3, the cloud is directing downward, indicating a price correction at the 12H timeframe.
Besides, RSI is at the oversold level, which indicates the weakness of sellers.
We recommend buying SNXUSDT when the RSI reaches the oversold level near the 61.8% Fibonacci level and take the profit near the level of $ 9.
