Can #SNX Recover From Here or Will it Continue to Fall?Yello, Paradiser! Are you prepared for the moment when #SNXUSDT finally decides whether it will punish late bears or wipe out impatient longs? Let's look at the #Synthetix trade setup:
💎#SNX is currently trading around $0.418 on the 4H timeframe and remains stuck inside a clearly defined descending channel, respecting both the descending resistance and descending support with high precision. This type of structure tells us one thing very clearly: the market is compressing, and a decisive move is getting closer.
💎Price is now sitting just above a key demand zone around $0.38–$0.39, where buyers have already shown interest multiple times. This zone is crucial. As long as #SNXUSD holds above it, bulls still have a chance to regain control. The chart also highlights that a clean breakout above the descending resistance, combined with a reclaim of the 50 EMA as support, would significantly increase the probability of a bullish continuation.
💎If that bullish scenario plays out, the first upside target sits at the moderate resistance near $0.51, followed by a much more important strong resistance around $0.60–$0.61. A move toward those levels would likely happen fast, as many traders are currently positioned defensively and would be forced to react to a breakout.
💎However, this setup comes with a very clear invalidation. If price loses the $0.38 support zone decisively, the bullish idea is off the table. A breakdown below this level would confirm weakness and open the door for a deeper move toward the $0.33 support zone, where the next significant liquidity sits. That scenario would likely come with increased volatility and emotional selling from inexperienced traders.
Trade smart, Paradisers. This setup will reward only the disciplined.
MyCryptoParadise
iFeel the success🌴
SNXUSDT

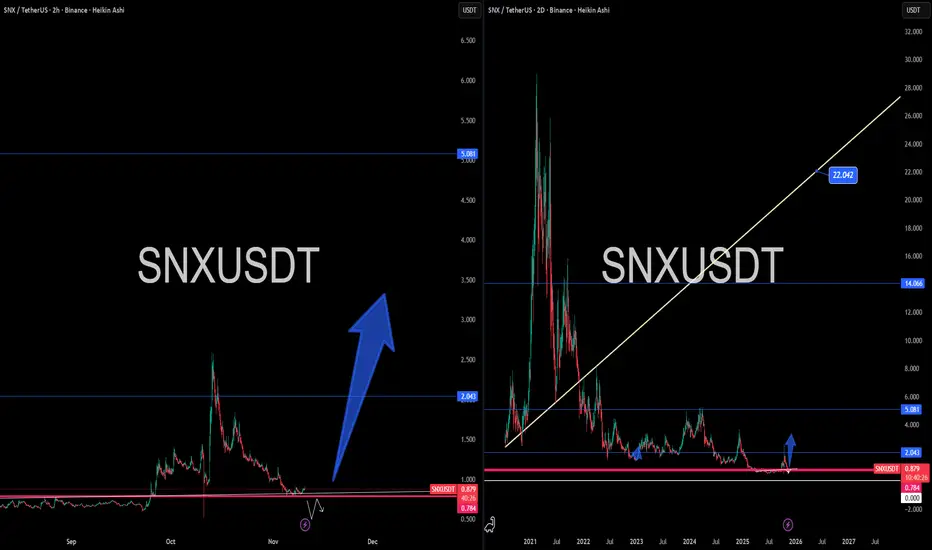
SNX – The OG DeFi Token Awakens?SNX – The OG DeFi Token Awakens? 🧬🚀
Synthetix (SNX) is back on the radar, trading just above its historic base at $0.78–$0.88 — the same accumulation zone that birthed past monster runs.
This isn’t just nostalgia. The OG DeFi protocol is launching a new DEX in the coming weeks, built on L2 Ethereum. And yes — SNX was the first perpetuals DEX on-chain before it was even cool.
📊 Current Setup:
Strong base at $0.78–$0.88
Resistance targets: $2.04 → $5.08 → $14.06
Macro extension: $22.04 zone if cycle rotates full DeFi 🔁
You’re looking at a classic bottom formation across both short- and long-term timeframes. Accumulation + news = ignition risk.
Synthetix is part of DeFi history — and possibly its future if the new DEX delivers.
Mindset Check 🧘
DeFi summer may be long gone, but real builders never left. The best setups are always born in silence.
Disclaimer: I'm not a financial advisor, but I am the best prognosis you’ll ever get. Better than AI. Better than the herd. Still, this ain’t advice — it's education. And risk? That’s always yours.
One Love,
The FXPROFESSOR 💙
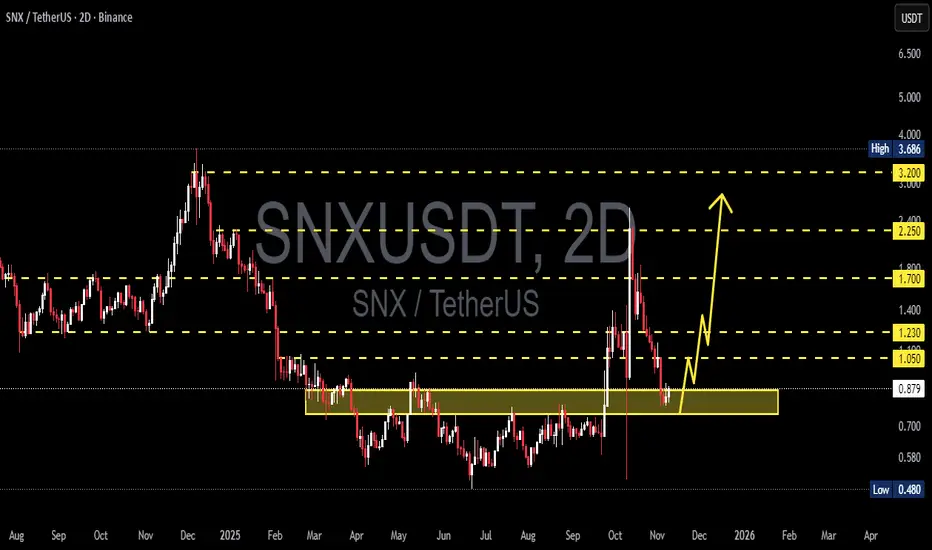
SNX/USDT Golden Zone 0.87–0.75 — Accumulation or Breakdown AheadSNX has returned to the golden zone at 0.87–0.75, a level that has historically acted as the main battlefield between buyers and sellers.
Price is now retesting the same area that once served as the foundation of a strong accumulation phase earlier this year.
But this time, the context is different — after a sharp rejection from the 3.68 high, the market is testing whether this zone still holds real demand strength or not.
---
📊 Technical Structure & Price Pattern
On the 2D chart, SNX has formed a broad accumulation range between 0.75 and 1.23.
The spike to 3.68 looks like a classic liquidity sweep, where the market took out stop orders above resistance before quickly pulling back — often a sign of redistribution and preparation for the next move.
Now, the 0.87–0.75 zone becomes the decision point:
If it holds, the structure could evolve into a reaccumulation phase;
If it fails, the market may confirm a descending continuation pattern toward the previous low around 0.48.
---
🟩 Bullish Scenario — Reclaim & Relief Rally
For a bullish continuation:
Price must hold above 0.87 and establish a higher low above 0.80.
A confirmed reclaim of 1.05 and 1.23 will strengthen the bullish case, unlocking higher targets at 1.70 → 2.25 → 3.20.
Sustained buying pressure with volume could shape a major double bottom targeting the upper range near 3.20.
For swing traders, this yellow zone offers a low-risk accumulation opportunity, with clearly defined risk below 0.75 and potential multi-fold upside.
---
🟥 Bearish Scenario — Breakdown & Failed Retest
If price closes below 0.75, it would confirm a range breakdown.
Typical follow-up structure:
Failed retest (price retests 0.80–0.87 and gets rejected);
Bearish continuation toward 0.60–0.50, with possible extension to 0.48.
This scenario could represent a final capitulation phase before a major cycle bottom — so traders should monitor volume and market sentiment closely.
---
🔎 Analytical Perspective
The 0.87–0.75 zone isn’t just a technical level — it’s a psychological battleground.
Large players often define their next move here, either absorbing supply for accumulation or distributing before the next leg down.
Watch for bullish RSI or OBV divergences, as they often precede strong reversal setups before breakouts.
---
📈 Strategic Outlook
Key Zone: 0.87–0.75
Current Sentiment: Neutral / Wait for confirmation
Directional Bias: Bullish above 0.87, Bearish below 0.75
Main Bullish Targets: 1.05 → 1.23 → 1.70 → 2.25 → 3.20
Main Bearish Targets: 0.60 → 0.48
Keyword: “This zone will define SNX’s next market cycle.”
---
#SNX #SNXUSDT #CryptoTA #TechnicalAnalysis #PriceAction #SupportZone #Accumulation #CryptoMarket #BreakoutOrBreakdown #SwingTrading
SNX : SIGNALHello friends
Given the good growth we had and the arrival of buyers, now that the price is correcting, there is a good opportunity to buy in steps with risk and capital management and move towards the specified goals.
*Trade safely with us*

SNX - BULLISHIm buying this dip on #SNX 📈 (DCA from previous charts)
💣POC Point daily supporting prices nicely
💣Clean bull div RSI
💣C&H pattern structure M15
I expect to see a downtrend breakout & a 20%+ bull move from this support zone!
Everything is in my chart!
Just sharing EPIC Chart analyses, based on my experience. Not a financial advice team. #DYOR

SNX - BULLISH NYSE:SNX - Bullish candle close H1 ✅
Falling wedge breakout likely, big green dildo could follow 🚀👀
I'm buying here, before the real FOMO.
Not a financial advice guys. (you know)

#SNX/USDT — Recovery Mode?#SNX
The price is moving within a descending channel on the 1-hour frame, adhering well to it, and is heading for a strong breakout and retest.
We have a bearish trend on the RSI indicator that is about to be broken and retested, which supports the upward breakout.
There is a major support area in green at 1.20, representing a strong support point.
We are heading for consolidation above the 100 moving average.
Entry price: 1.30.
First target: 1.37.
Second target: 1.45.
Third target: 1.55.
Don't forget a simple matter: capital management.
When you reach the first target, save some money and then change your stop-loss order to an entry order.
For inquiries, please leave a comment.
Thank you.

SNX/USDT INCREASE VOLUME On the lower time frames, SNX is showing signs of increasing volume, which could build up over time. For this reason, it’s worth watching SNX closely to see if the trend can break.
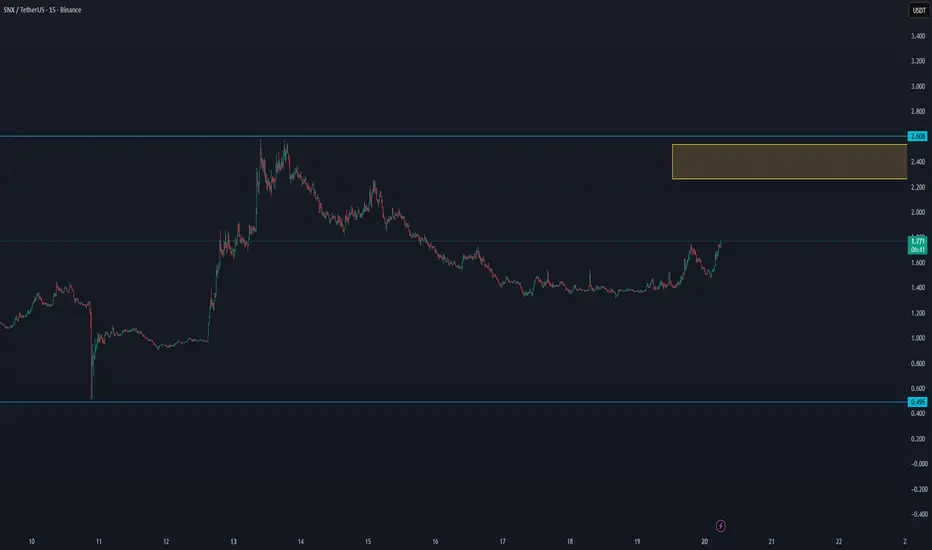
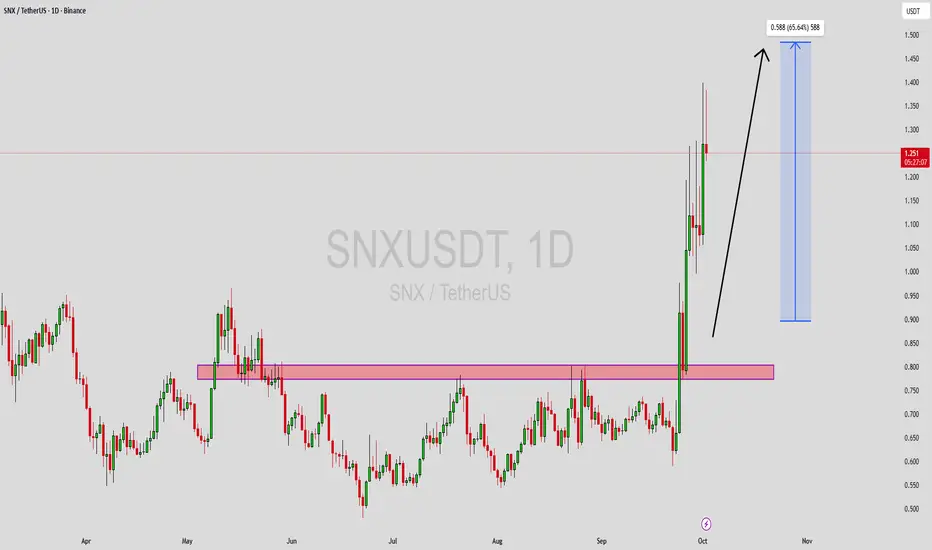
SNXUSDT: Potential for Upward Momentum Towards $2.25SNXUSDT has demonstrated significant bullish momentum, breaking out of a consolidation phase with a remarkable +26.08% surge on October 19, 2025. This move pushed the price to a high of $1.7396, indicating strong buying pressure.
The price is currently situated above the crucial Fibonacci retracement level of 0.618 at approximately $1.9034. A successful retest and hold above this level could confirm the continuation of the uptrend. The daily Relative Strength Index (RSI) is at a healthy 59.71, suggesting there is still room for growth before the asset becomes overbought. The 4-hour chart further supports this bullish sentiment, with the RSI at 63.72 after a significant +16.09% increase in a single 4-hour candle.
Based on this analysis, a strategic entry point could be considered upon a successful retest of the support zone.
Entry Zone: $1.65 - $1.72
Target 1: $1.90 (Fibonacci 0.618)
Target 2: $2.25 (Previous resistance area)
Target 3: $2.81 (Fibonacci 1.618)
Stop-Loss: A close below $1.45 would invalidate this bullish outlook.
Disclaimer: This is not financial advice. The cryptocurrency market is highly volatile. Please conduct your own research before making any investment decisions.

SNXUSDT — Recovery Mode?Friday’s carnage seems to be behind us, and altcoins are slowly finding their footing again. Sure, we could see another dip, but SNX continues to show impressive strength at current levels.
Momentum is stabilizing, and buyers seem to be stepping back in — classic supply and demand dynamics at play here.
Let’s see how this develops — waiting for confirmation before updating TP levels. Stay sharp and trade smart! ⚡
SNX Rebuy Setup (12H)Before anything else, pay attention to the timeframe.
From the point marked Start on the chart, it appears that a bullish phase has begun on SNX.
Currently, it seems we are at the end of Phase A. After some time correction and price consolidation, we can expect another bullish wave forming Wave C.
In the green zone, we can look for buy/long positions.
Targets are indicated on the chart.
If a daily candle closes below the invalidation level, this analysis will be invalidated.
For risk management, please don't forget stop loss and capital management
When we reach the first target, save some profit and then change the stop to entry
Comment if you have any questions
Thank You

#SNX/USDT Fast Money Moves — SNXUSDT SCALP Setup#SNX
The price is moving in a descending channel on the 1-hour frame and is expected to break and continue upward.
We have a trend to stabilize above the 100 moving average once again.
We have a downtrend on the RSI indicator that supports the upward move with a breakout.
We have a major support area in green that pushed the price higher at 1.14.
Entry price: 1.21.
First target: 1.20.
Second target: 1.230.
Third target: 1.264.
To manage risk, don't forget stop loss and capital management.
When you reach the first target, save some profits and then change your stop order to an entry order.
For inquiries, please comment.
Thank you.

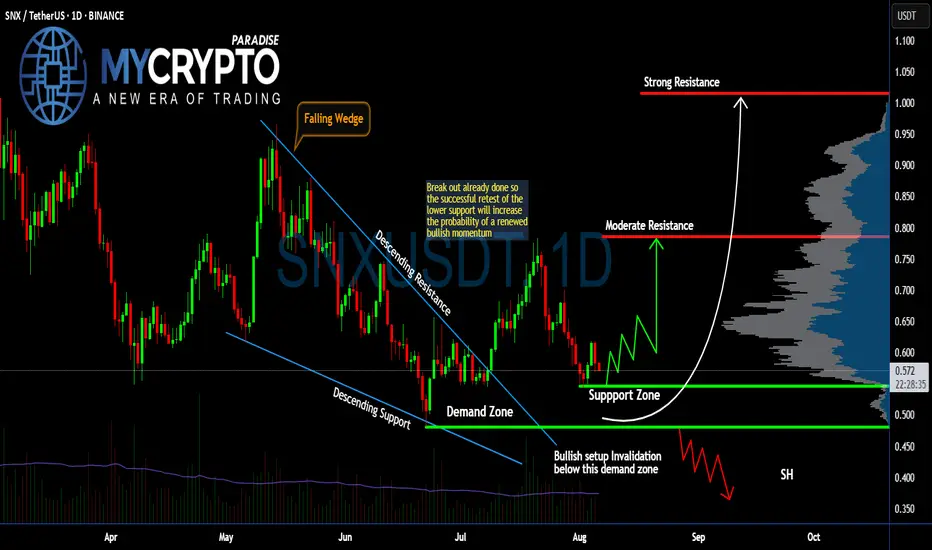
Can #SNX Bulls Sustain the Current Momentum? Watch it CloselyYello, Paradisers! Is this #SNX setup just another fakeout in disguise, or is the market quietly setting up for a major bullish momentum shift? Let’s dissect what’s really happening on #SNXUSDT:
💎After moving through a falling wedge pattern for months, #Synthetix has already broken out above the descending resistance, signaling an early shift in trend. However, the real move hasn’t yet begun—a proper retest of the support zone between $0.50–$0.54 is what we’re watching for now.
💎This support zone aligns with the prior wedge breakout and also overlaps with a visible demand area, making it a key region where buyers could step in again. If bulls defend this area successfully, we expect a renewed rally toward the moderate resistance level at $0.78.
💎From there, the next upside target lies at the strong resistance around $1.01—a level with heavy volume profile resistance and previous seller activity. But that level will only come into play if the bulls reclaim momentum with conviction.
💎On the flip side, if #SNXUSD breaks below $0.48, which is our bullish invalidation level, the setup collapses and opens the door for a deeper drop toward the $0.40–$0.35 zone, where short-sellers are likely to pile in.
Stay patient, Paradisers. Let the breakout confirm, and only then do we strike with conviction.
MyCryptoParadise
iFeel the success🌴
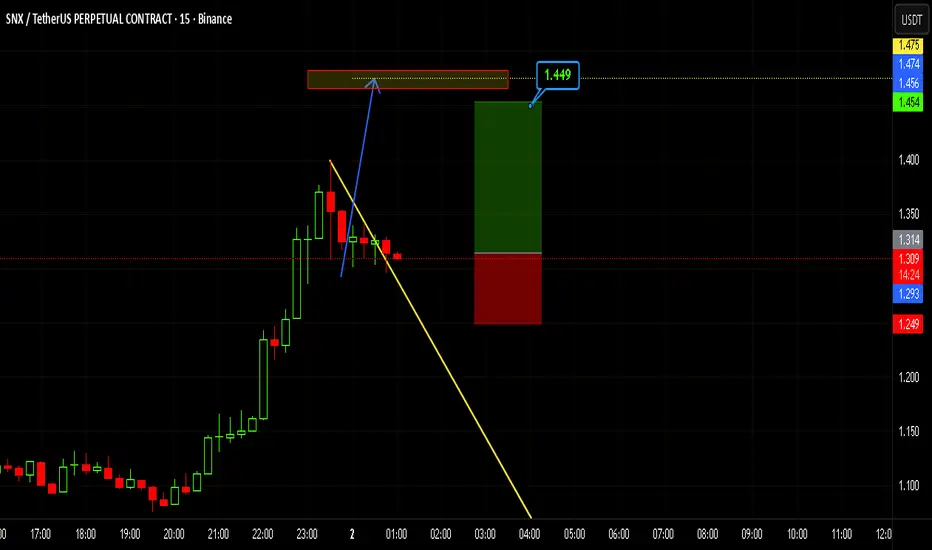
Fast Money Moves — SNXUSDT SCALP Setup"Alright fam, time for a quick sprint — dropping a fresh SCALP setup! 🏃💨
Today’s coin: #SNXUSDT.P, and yep, we’re talking futures plays here. 💥
Now, technically the flag target sits around $1.48–$1.50, but you know the drill — we’re locking profits around $1.45 and letting the rest ride. Gotta leave some juice for the next trader. 😉
Good luck, legends — hope it’s a green-filled day for everyone! 💚📈
Catch you in the comments!" 💬
SNXUSDT Forming Bullish MomentumSNXUSDT has recently shown a strong bullish breakout, pushing above its key resistance zone with solid momentum and good trading volume. This breakout suggests that the pair could continue its upward trajectory, with expectations pointing towards a potential 40% to 50% gain in the coming sessions. The market structure is favoring the bulls, and the consistent buyer interest indicates growing confidence in this project.
The chart highlights how SNX has reclaimed a critical price level that had previously acted as resistance. Holding above this zone strengthens the bullish outlook, as it confirms that investors are actively accumulating positions. With healthy liquidity and rising participation, this setup aligns well with the technical breakout structure.
Investor sentiment is also improving, and the potential upside remains strong if volume continues to support the current rally. As long as the price sustains above support levels, SNXUSDT could become one of the more attractive plays in the current crypto market environment.
✅ Show your support by hitting the like button and
✅ Leaving a comment below! (What is You opinion about this Coin)
Your feedback and engagement keep me inspired to share more insightful market analysis with you!
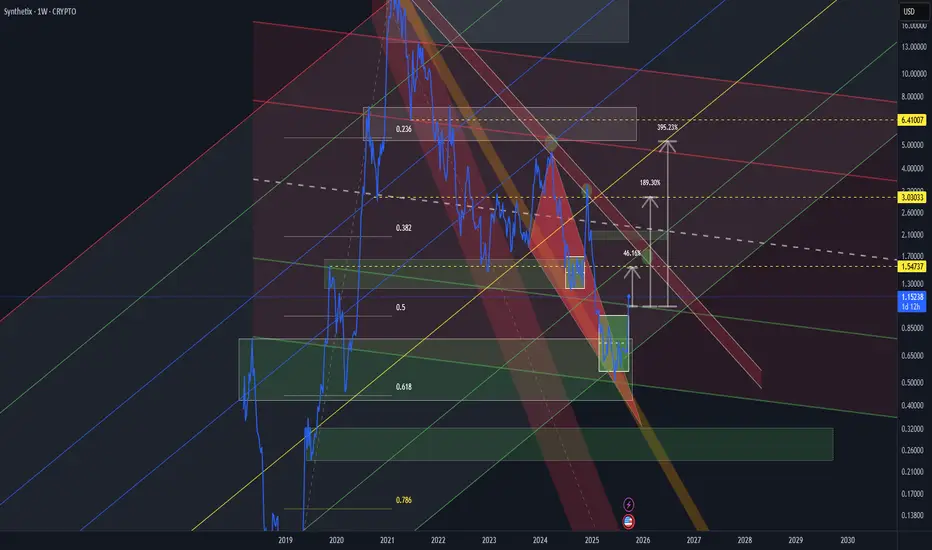
Synthetix (SNX) SNXUSD 3d - 1 week mid/long term SNX rank: 192
SNX coin previously showed strong movements and was at the center of hype, with a significant rise from the bottom to the top.
If we stretch the Fibonacci retracement from the low to the high, we can see that the price came to the golden level 0.618, where the new accumulation zone started.
Typically, major players start accumulating positions in the 0.3–0.5 zone, then activity intensifies around 0.5–0.618, and they usually don’t go beyond 0.786.
However, safer entry levels are usually below 0.618.
The chart shows two channels:
Global channel — marked with multicolored lines.
Descending channel — red and green lines, where:
Red — selling zones;
Green — accumulation zones.
Additionally, I’ve added a channel drawn from the top through two key points, from which corrections occurred. This allows us to identify a potential strong bounce zone at $1.54. This is the same level where the previous accumulation took place before the sharp rise and where there was an intermediate high in December.
Further movement will depend on how the price reacts to the 0.618 zone and the retention of key levels.
SNX is cooling down?? What!Journal Entry #9
After a strong pump, SNX is cooling down.
It has shown a bearish divergence
Waiting for it to show further signs of weakness
it still a waiting game. Posting it since its on my Watchlist.

SNX ; BEARISH!!!Hello friends
Given the growth we had, you can now see that the price ended the trend at the ceiling of a large candle and the sellers covered it with another large candle.
Now we have a resistance area in the middle of this candle from which the price is expected to correct and move to the specified targets.
*Trade safely with us*

SNX : Has the climb started?Hello friends🙌
👀According to the shoulder and shoulder pattern that was formed and then the price fell in the support area that we identified for you with Fibonacci, buyers entered and provided good support for the price, which also broke our resistance, which creates a good opportunity to buy, of course with risk and capital management.
🔥Follow us for more signals🔥
*Trade safely with us*
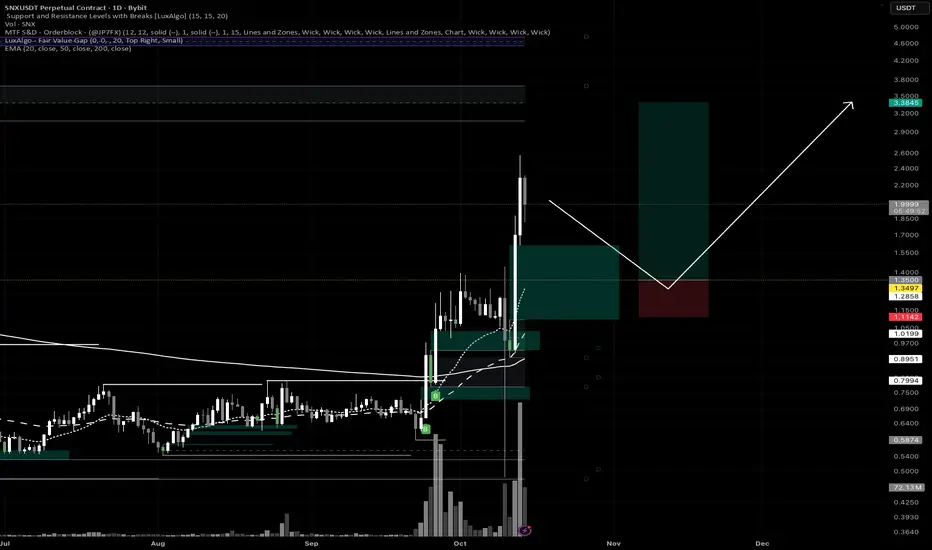
SNXUSDT Breakout Alert! Are We Witnessing the Early Stages?📌 🔍 Overview:
After months of relentless downward pressure, SNX has finally shown a strong technical breakout. The price has decisively broken above the long-term descending trendline, signaling a potential shift in structure from bearish to bullish. This could mark the beginning of a significant impulse wave to the upside.
📐 📊 Technical Structure & Key Pattern Breakdown:
🔻 Broken Downtrend Line: Price action has successfully broken above a descending trendline that has been in place since December 2024, effectively ending the bearish dominance.
🔺 Falling Wedge Pattern: A classic falling wedge has formed and recently completed with a confirmed breakout — a bullish reversal pattern that often precedes strong upside momentum.
🟨 Accumulation Zone (Base Support): The yellow box between $0.60 – $0.72 acted as a major accumulation zone and now flips into a strong demand/support area.
📈 Higher Lows Structure: The recent structure of higher lows signals a shift in market sentiment, showing early signs of accumulation and bullish interest.
✅ Bullish Scenario (Upside Continuation):
If price holds above the breakout zone and confirms strength:
🎯 Target 1: $0.938 (key horizontal resistance)
🎯 Target 2: $1.042 – $1.100 (historical resistance zone)
🎯 Target 3: $1.248 – $1.625
🎯 Target 4 (Mid-term rally): $1.966 – $2.197
🏁 Final Bullish Target (Longer term): $3.372 – $3.686
A strong continuation would require confirmation via increased trading volume and bullish momentum from the broader crypto market.
❌ Bearish Scenario (Failed Retest or Rejection):
However, if the price fails to sustain above the breakout level:
🚨 Risk of a false breakout emerges if price falls back below $0.724
🔻 Breakdown of the yellow support box could trigger a deeper correction toward:
Support 1: $0.60
Support 2 (Major Low): $0.480
This would form a classic bull trap and extend the consolidation phase.
⚠️ Validation & Risk Considerations:
Volume confirmation is key. A breakout without rising volume may lack follow-through.
Watch closely for price action in the coming days — will it hold above the breakout zone or fall back?
Strategy: Look for retest entries or enter with partial exposure, using tight risk management.
🧠 Conclusion:
SNXUSDT is at a pivotal turning point. The breakout from a falling wedge pattern combined with higher low formations is a textbook bullish reversal setup. If price holds and buyers step in, we may be witnessing the early stages of a major bull run for SNX.
#SNXUSDT #SNXBreakout #AltcoinSetup #BullishReversal #FallingWedge #CryptoSignals #CryptoTrading #ChartAnalysis #PriceAction

SNX About to Explode or Collapse?Yello Paradisers, are you watching SNXUSDT closely? Because if not, you might be missing one of the cleanest opportunities for bulls in this current market cycle. The setup is forming right at a critical decision point — and how price reacts here could define the next major move.
💎SNXUSDT is currently showing a bullish internal CHoCH (Change of Character) while trading directly inside a strong support zone. This zone isn’t just standing alone — it’s backed by the powerful 200 EMA and a well-respected support trendline. This confluence of support significantly increases the probability of a bullish bounce from this level, making it a high-reward setup for those paying attention.
💎Zooming out to the higher timeframe, the structure becomes even more interesting. SNXUSDT appears to be forming a bull flag pattern — a bullish continuation signal that often precedes explosive upside moves. When such a formation aligns with key support zones, it suggests that the market is simply consolidating before the next leg up.
💎However, traders must proceed with caution. If price breaks down and closes below the current support zone, this would invalidate the entire bullish scenario. In such a case, it’s best to step aside and wait for better confirmation rather than rushing into a compromised setup. Emotional decisions are the fastest way to ruin sound trading strategies.
🎖Strive for consistency, not quick profits. Treat the market as a businessman, not as a gambler. Discipline, patience, and strategic entries will always outperform emotional trades. Stay focused, Paradisers — the opportunity will always favor those who are prepared.
MyCryptoParadise
iFeel the success🌴

SNXUSDT 1D Analysis SNX ~ 1D Analysis
#SNX Buy after successfully breaking this resistance line with a short term target of at least 15%+ from here.

#SNX/USDT#SNX
The price is moving within a descending channel on the 1-hour frame, adhering well to it, and is heading for a strong breakout and retest.
We are seeing a bounce from the lower boundary of the descending channel, which is support at 0.827.
We have a downtrend on the RSI indicator that is about to break and retest, supporting the upward trend.
We are looking for stability above the 100 moving average.
Entry price: 0.880
First target: 0.900
Second target: 0.943
Third target: 0.977
