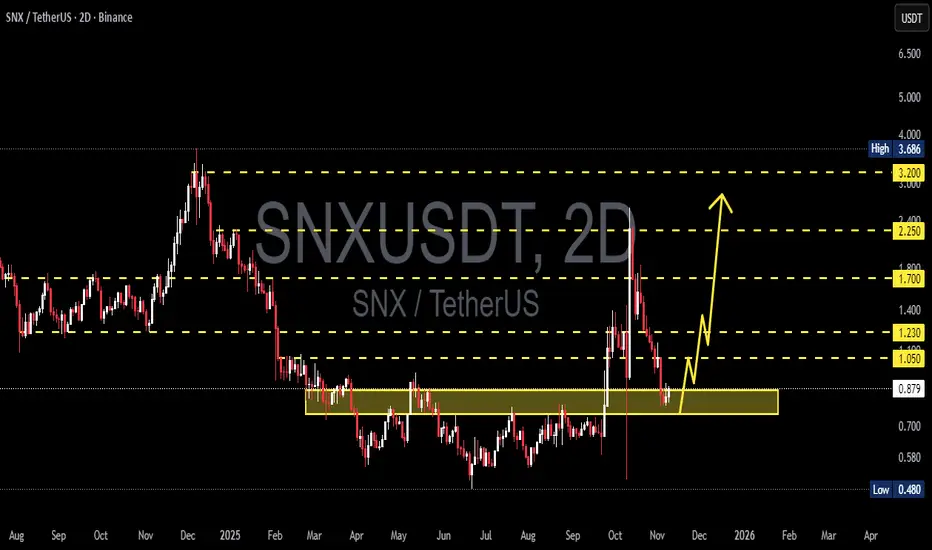
SNX/USDT Golden Zone 0.87–0.75 — Accumulation or Breakdown AheadSNX has returned to the golden zone at 0.87–0.75, a level that has historically acted as the main battlefield between buyers and sellers.
Price is now retesting the same area that once served as the foundation of a strong accumulation phase earlier this year.
But this time, the context is different — after a sharp rejection from the 3.68 high, the market is testing whether this zone still holds real demand strength or not.
---
📊 Technical Structure & Price Pattern
On the 2D chart, SNX has formed a broad accumulation range between 0.75 and 1.23.
The spike to 3.68 looks like a classic liquidity sweep, where the market took out stop orders above resistance before quickly pulling back — often a sign of redistribution and preparation for the next move.
Now, the 0.87–0.75 zone becomes the decision point:
If it holds, the structure could evolve into a reaccumulation phase;
If it fails, the market may confirm a descending continuation pattern toward the previous low around 0.48.
---
🟩 Bullish Scenario — Reclaim & Relief Rally
For a bullish continuation:
Price must hold above 0.87 and establish a higher low above 0.80.
A confirmed reclaim of 1.05 and 1.23 will strengthen the bullish case, unlocking higher targets at 1.70 → 2.25 → 3.20.
Sustained buying pressure with volume could shape a major double bottom targeting the upper range near 3.20.
For swing traders, this yellow zone offers a low-risk accumulation opportunity, with clearly defined risk below 0.75 and potential multi-fold upside.
---
🟥 Bearish Scenario — Breakdown & Failed Retest
If price closes below 0.75, it would confirm a range breakdown.
Typical follow-up structure:
Failed retest (price retests 0.80–0.87 and gets rejected);
Bearish continuation toward 0.60–0.50, with possible extension to 0.48.
This scenario could represent a final capitulation phase before a major cycle bottom — so traders should monitor volume and market sentiment closely.
---
🔎 Analytical Perspective
The 0.87–0.75 zone isn’t just a technical level — it’s a psychological battleground.
Large players often define their next move here, either absorbing supply for accumulation or distributing before the next leg down.
Watch for bullish RSI or OBV divergences, as they often precede strong reversal setups before breakouts.
---
📈 Strategic Outlook
Key Zone: 0.87–0.75
Current Sentiment: Neutral / Wait for confirmation
Directional Bias: Bullish above 0.87, Bearish below 0.75
Main Bullish Targets: 1.05 → 1.23 → 1.70 → 2.25 → 3.20
Main Bearish Targets: 0.60 → 0.48
Keyword: “This zone will define SNX’s next market cycle.”
---
#SNX #SNXUSDT #CryptoTA #TechnicalAnalysis #PriceAction #SupportZone #Accumulation #CryptoMarket #BreakoutOrBreakdown #SwingTrading
Snxusdtlong
SNX : SIGNALHello friends
Given the good growth we had and the arrival of buyers, now that the price is correcting, there is a good opportunity to buy in steps with risk and capital management and move towards the specified goals.
*Trade safely with us*

#SNX/USDT — Recovery Mode?#SNX
The price is moving within a descending channel on the 1-hour frame, adhering well to it, and is heading for a strong breakout and retest.
We have a bearish trend on the RSI indicator that is about to be broken and retested, which supports the upward breakout.
There is a major support area in green at 1.20, representing a strong support point.
We are heading for consolidation above the 100 moving average.
Entry price: 1.30.
First target: 1.37.
Second target: 1.45.
Third target: 1.55.
Don't forget a simple matter: capital management.
When you reach the first target, save some money and then change your stop-loss order to an entry order.
For inquiries, please leave a comment.
Thank you.

SNXUSDT: Potential for Upward Momentum Towards $2.25SNXUSDT has demonstrated significant bullish momentum, breaking out of a consolidation phase with a remarkable +26.08% surge on October 19, 2025. This move pushed the price to a high of $1.7396, indicating strong buying pressure.
The price is currently situated above the crucial Fibonacci retracement level of 0.618 at approximately $1.9034. A successful retest and hold above this level could confirm the continuation of the uptrend. The daily Relative Strength Index (RSI) is at a healthy 59.71, suggesting there is still room for growth before the asset becomes overbought. The 4-hour chart further supports this bullish sentiment, with the RSI at 63.72 after a significant +16.09% increase in a single 4-hour candle.
Based on this analysis, a strategic entry point could be considered upon a successful retest of the support zone.
Entry Zone: $1.65 - $1.72
Target 1: $1.90 (Fibonacci 0.618)
Target 2: $2.25 (Previous resistance area)
Target 3: $2.81 (Fibonacci 1.618)
Stop-Loss: A close below $1.45 would invalidate this bullish outlook.
Disclaimer: This is not financial advice. The cryptocurrency market is highly volatile. Please conduct your own research before making any investment decisions.

#SNX/USDT Fast Money Moves — SNXUSDT SCALP Setup#SNX
The price is moving in a descending channel on the 1-hour frame and is expected to break and continue upward.
We have a trend to stabilize above the 100 moving average once again.
We have a downtrend on the RSI indicator that supports the upward move with a breakout.
We have a major support area in green that pushed the price higher at 1.14.
Entry price: 1.21.
First target: 1.20.
Second target: 1.230.
Third target: 1.264.
To manage risk, don't forget stop loss and capital management.
When you reach the first target, save some profits and then change your stop order to an entry order.
For inquiries, please comment.
Thank you.

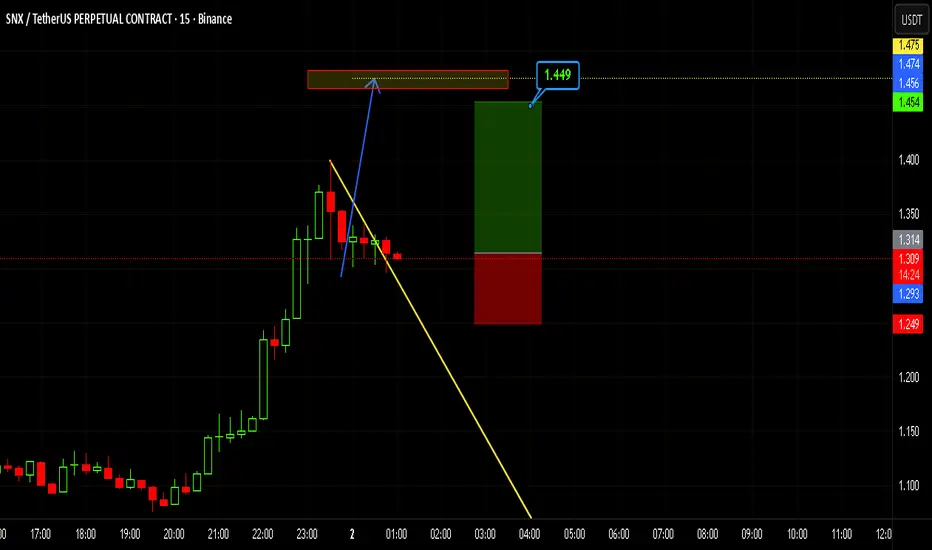
Fast Money Moves — SNXUSDT SCALP Setup"Alright fam, time for a quick sprint — dropping a fresh SCALP setup! 🏃💨
Today’s coin: #SNXUSDT.P, and yep, we’re talking futures plays here. 💥
Now, technically the flag target sits around $1.48–$1.50, but you know the drill — we’re locking profits around $1.45 and letting the rest ride. Gotta leave some juice for the next trader. 😉
Good luck, legends — hope it’s a green-filled day for everyone! 💚📈
Catch you in the comments!" 💬
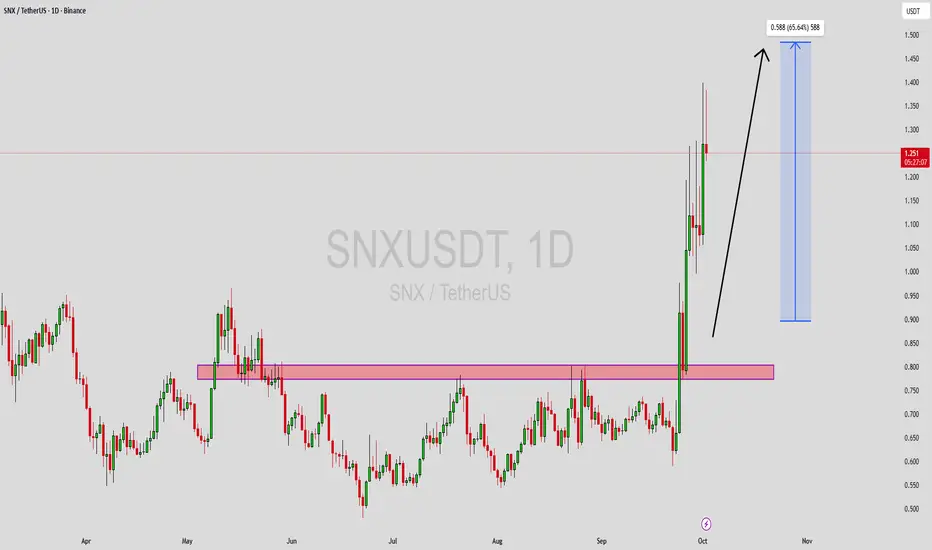
SNXUSDT Forming Bullish MomentumSNXUSDT has recently shown a strong bullish breakout, pushing above its key resistance zone with solid momentum and good trading volume. This breakout suggests that the pair could continue its upward trajectory, with expectations pointing towards a potential 40% to 50% gain in the coming sessions. The market structure is favoring the bulls, and the consistent buyer interest indicates growing confidence in this project.
The chart highlights how SNX has reclaimed a critical price level that had previously acted as resistance. Holding above this zone strengthens the bullish outlook, as it confirms that investors are actively accumulating positions. With healthy liquidity and rising participation, this setup aligns well with the technical breakout structure.
Investor sentiment is also improving, and the potential upside remains strong if volume continues to support the current rally. As long as the price sustains above support levels, SNXUSDT could become one of the more attractive plays in the current crypto market environment.
✅ Show your support by hitting the like button and
✅ Leaving a comment below! (What is You opinion about this Coin)
Your feedback and engagement keep me inspired to share more insightful market analysis with you!
SNX ; BEARISH!!!Hello friends
Given the growth we had, you can now see that the price ended the trend at the ceiling of a large candle and the sellers covered it with another large candle.
Now we have a resistance area in the middle of this candle from which the price is expected to correct and move to the specified targets.
*Trade safely with us*

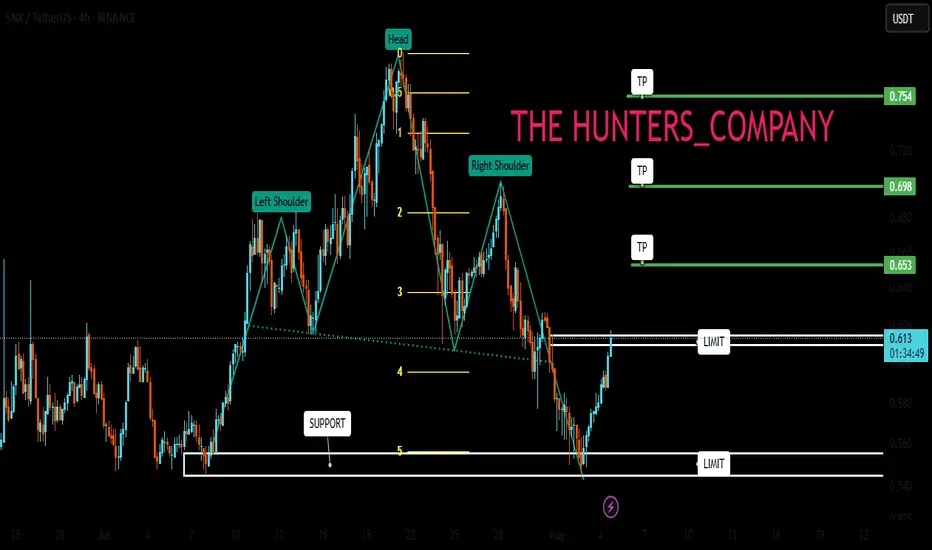
SNX : Has the climb started?Hello friends🙌
👀According to the shoulder and shoulder pattern that was formed and then the price fell in the support area that we identified for you with Fibonacci, buyers entered and provided good support for the price, which also broke our resistance, which creates a good opportunity to buy, of course with risk and capital management.
🔥Follow us for more signals🔥
*Trade safely with us*
SNXUSDT Breakout Alert! Are We Witnessing the Early Stages?📌 🔍 Overview:
After months of relentless downward pressure, SNX has finally shown a strong technical breakout. The price has decisively broken above the long-term descending trendline, signaling a potential shift in structure from bearish to bullish. This could mark the beginning of a significant impulse wave to the upside.
📐 📊 Technical Structure & Key Pattern Breakdown:
🔻 Broken Downtrend Line: Price action has successfully broken above a descending trendline that has been in place since December 2024, effectively ending the bearish dominance.
🔺 Falling Wedge Pattern: A classic falling wedge has formed and recently completed with a confirmed breakout — a bullish reversal pattern that often precedes strong upside momentum.
🟨 Accumulation Zone (Base Support): The yellow box between $0.60 – $0.72 acted as a major accumulation zone and now flips into a strong demand/support area.
📈 Higher Lows Structure: The recent structure of higher lows signals a shift in market sentiment, showing early signs of accumulation and bullish interest.
✅ Bullish Scenario (Upside Continuation):
If price holds above the breakout zone and confirms strength:
🎯 Target 1: $0.938 (key horizontal resistance)
🎯 Target 2: $1.042 – $1.100 (historical resistance zone)
🎯 Target 3: $1.248 – $1.625
🎯 Target 4 (Mid-term rally): $1.966 – $2.197
🏁 Final Bullish Target (Longer term): $3.372 – $3.686
A strong continuation would require confirmation via increased trading volume and bullish momentum from the broader crypto market.
❌ Bearish Scenario (Failed Retest or Rejection):
However, if the price fails to sustain above the breakout level:
🚨 Risk of a false breakout emerges if price falls back below $0.724
🔻 Breakdown of the yellow support box could trigger a deeper correction toward:
Support 1: $0.60
Support 2 (Major Low): $0.480
This would form a classic bull trap and extend the consolidation phase.
⚠️ Validation & Risk Considerations:
Volume confirmation is key. A breakout without rising volume may lack follow-through.
Watch closely for price action in the coming days — will it hold above the breakout zone or fall back?
Strategy: Look for retest entries or enter with partial exposure, using tight risk management.
🧠 Conclusion:
SNXUSDT is at a pivotal turning point. The breakout from a falling wedge pattern combined with higher low formations is a textbook bullish reversal setup. If price holds and buyers step in, we may be witnessing the early stages of a major bull run for SNX.
#SNXUSDT #SNXBreakout #AltcoinSetup #BullishReversal #FallingWedge #CryptoSignals #CryptoTrading #ChartAnalysis #PriceAction

SNXUSDT 1D Analysis SNX ~ 1D Analysis
#SNX Buy after successfully breaking this resistance line with a short term target of at least 15%+ from here.

#SNX/USDT#SNX
The price is moving within a descending channel on the 1-hour frame, adhering well to it, and is heading for a strong breakout and retest.
We are seeing a bounce from the lower boundary of the descending channel, which is support at 0.827.
We have a downtrend on the RSI indicator that is about to break and retest, supporting the upward trend.
We are looking for stability above the 100 moving average.
Entry price: 0.880
First target: 0.900
Second target: 0.943
Third target: 0.977

#SNX/USDT#SNX
The price is moving within a descending channel on the 1-hour frame, adhering well to it, and is heading for a strong breakout and retest.
We are seeing a bounce from the lower boundary of the descending channel, which is support at 0.711.
We are seeing a downtrend on the RSI indicator that is about to break and retest, supporting the upward trend.
We are looking for stability above the 100 Moving Average.
Entry price: 0.744
First target: 0.765
Second target: 0.785
Third target: 0.811

SNXUSDT Bouncing from Channel SupportSNXUSDT Technical analysis update
SNXUSDT has been trading inside a clear descending channel for the last 1700 days. Recently, the price touched the lower support of the channel and is now showing signs of a bounce.
If the current momentum continues, SNX could move upward toward the upper resistance of the channel. A breakout above the upper trendline would be a strong bullish signal. Until then, the price may stay within the channel.
Price could move 100%-250% in a few months.

SNXUSDT 1WSNX ~ 1W
#SNX If you still have Conviction on this coin,. Buy gradually on this support block with a minimum target of 20%+

SNXUSDT 1WSNX ~ 1W
#SNX If you still have Conviction on this coin,. This support block will be a very good buying place for now. buy from here with a minimum target of 20%+

#SNX/USDT#SNX
The price is moving in a descending channel on the 1-hour frame and is expected to continue upwards
We have a trend to stabilize above the moving average 100 again
We have a descending trend on the RSI indicator that supports the rise by breaking it upwards
We have a support area at the lower limit of the channel at a price of 2.16
Entry price 2.20
First target 2.24
Second target 2.31
Third target 2.40

#SNX/USDT
#SNX
We have a bearish channel pattern on a 12-hour frame, the price moves within it, adheres to its limits well, and is expected to break it upwards strongly.
We have a support area at the lower border of the channel at $2.50 from which the price rebounded
We have a tendency to stabilize above moving average 100
We have a downtrend on the RSI indicator that is about to break higher, supporting the price higher
Entry price is 2.60
First goal 3.26
The second goal is 3.60
The third goal is 4.20

SNXUSDT Signals Bullish Move AheadSNXUSDT Technical analysis update
BINANCE:SNXUSDT has been ranging at the bottom for the last 120 days. The price has now broken out above the resistance line with high volume and is trading above the 100 EMA, signaling a bullish trend. This breakout indicates the potential for a strong bullish move in the coming days.
Buy zone : Below $1.77
Stop loss : $1.50
Take Profit 1: $1.99
Take Profit 2: $2.40
Take Profit 3: $3.30
Thank You
Hexa🧘♀️

SNXUSDTSNX ~ 1W
#SNX If you still have Conviction on the coin,. This is a great support block to start buying again. at least for 20%++

SNX/USDT PLAN The SNX/USDT breakout and retest have been confirmed on 6h time-frame, and it’s encountering slight resistance on the 4-hour timeframe. I expect another breakout soon, with the next target above $2. Not financial advice—do your own research.

SNXUSDT 1WSNX ~ 1W
#SNX In the past this was a very strong demand zone for price bounce.
At least for a 20%+ upside from here.

#SNX/USDT#SNX
The price is moving within a descending channel pattern on the 4-hour frame and broke it upwards after adhering to it significantly
We have a downtrend on the RSI indicator and it was broken upwards and we have a trend to stabilize above it
We have a major support level in green at a price of 1.60
We have a trend to dot higher than the moving average 100
Entry price 1.72
First target 1.88
Second target 1.98
Third target 2.11
