SoFi Technologies — Scaling a Capital-Light Fintech FlywheelCompany Overview
SoFi NASDAQ:SOFI is a leading digital finance platform scaling across lending, banking, investing, and payments, with growing exposure to capital-light, fee-based businesses.
Key Catalysts
Beat & Mix Shift: Q3’25 adjusted net revenue $950M (+38% YoY); capital-light segments ~50% of revenue, lifting margin durability.
Platform Scale: 12.6M members (+35% YoY) and 18.6M products (+36% YoY) power a cross-sell flywheel and lower CAC over time.
Crypto Re-entry & SoFiUSD: Stablecoin + crypto initiatives add high-margin payments/float economics and new monetization vectors.
Investment Outlook
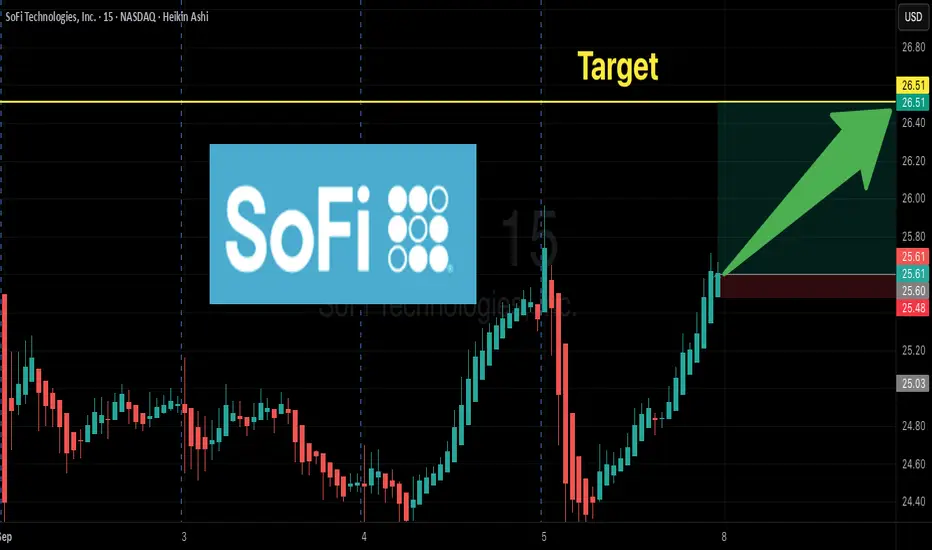
Bullish above: $23.50–$24.00
Target: $40.00–$41.00 — supported by operating leverage from fee businesses, member/product compounding, and new fintech rails (stablecoin/crypto).
📌 SOFI — from digital bank to diversified, capital-light fintech platform with accelerating optionality.
Sofistock

SOFI: price reached key resistance zone Price has moved in line with the macro trend structure outlined since the July update and has now reached key resistance levels before reversing.
At this stage, I’m tracking two potential trend alternatives:
• Main scenario: price is in the process of forming a deeper pullback targeting the January’25 / July’25 highs. This view will gain even more weight if price breaks and starts closing below the 24 support zone.
• Alternative (more immediately bullish) scenario: potential for upside reversal and continuation of momentum, provided we see supportive action holding around the 24 level.
Chart:
Previously:
• On bullish trend structure (Jul 29):
www.tradingview.com
• On support zone (Aug 5):
www.tradingview.com

Sofi long term bullish 2026Perfectly bouncing off this trend line and support zone, volume is one thing that cannot be manipulated.. there making beautiful shelfs on volume profile at 25-26 27-28 29-30$
Last time we see 27$ is before christmas and i dont think well see under 30$ after christmas unless BAD news or globally something bad
insanely bullish on Sofi holding shares at 21.80

SOFI Technologies — Strong 200SMA Support Sparks Swing Potential🚀 SOFI TECH STACK: The Fintech Heist - Layer Entry Swing Trade 📊💰
🎯 Executive Summary
Yo traders! 👋 Time to stack those profits like you're robbing Fort Knox! 💎 SoFi Technologies (NASDAQ: SOFI) is flashing a BULLISH CONFIRMATION signal pinned to the 200-day Simple Moving Average (SMA). This setup screams "BUY ME" for savvy swing traders! The fintech giant just crushed Q3 earnings with 36% YoY revenue growth and added 905,000 new members — that's 🔥 momentum, baby!
Current Price: $28.21 | 52-Week High: $32.57 | Market Cap: $34.02B ✅
📍 Technical Setup Breakdown
🎪 Bullish Thesis Confirmed (The Good News)
The 200-period SMA is acting like a SECURITY WALL 🛡️ supporting our bullish narrative. SOFI is respecting this key moving average on the daily chart, signaling institutional accumulation and strong bottom-forming behavior. With strong earnings tailwinds and expanding non-lending revenue (now 56% of total revenue!), this fintech is ready for liftoff! 🚀
💰 Entry Strategy: "Thief Layering" - Multiple Limit Orders 🎲
The "Thief Stacking" approach = Superior Risk Management! Instead of going all-in like a rookie, we deploy capital in tranches:
Recommended Layer Entry Zones:
🥇 Layer 1 (Buy Limit): $27.00 ← First wave of accumulation
🥈 Layer 2 (Buy Limit): $28.00 ← Secondary strength test
🥉 Layer 3 (Buy Limit): $29.00 ← Building momentum zone
💎 Layer 4 (Buy Limit): $30.00 ← Premium breakout entry (ATH proximity awareness!)
Strategy Win: This layering method scales your position while averaging down on dips — mathematically sound, emotionally smart! 📈 You can add/modify additional layers based on your risk tolerance and account size.
🛑 Stop Loss: The "Escape Route" 🏃♂️
Hard Stop Loss @ $25.00 ⚠️
This level represents ~11% downside risk from current levels and sits below major support structures. If SOFI breaks this zone with volume, the thesis is invalidated and we exit to fight another day. Remember: Protecting capital = Being alive to trade tomorrow! 💪
Disclaimer: This is YOUR trade setup. Risk management is personal — adjust your SL based on YOUR position size and account heat.
🎯 Profit Targets: "Police Barricade" Resistance Escape 🚨
Target: $37.00 📍
After crushing earnings, SOFI faces multiple headwinds at higher prices:
🚧 Overbought Confluence Zone: RSI approaching overbought territory + Fib resistance overhead
📊 Technical Resistance: Historical resistance cluster around $35-37 range
⚡ Momentum Trap Warning: Extended moves often reverse at psychological levels
Multi-Profit Take Strategy:
TP1 @ $32.50: Take 30% profits — Lock in the W! 🔐
TP2 @ $35.00: Take another 40% — Secure the bag! 💵
TP3 @ $37.00: Trail 30% with breakeven stop — Let winners run! 🎯
Pro Tip: Don't get greedy! The "Police Barricade" awaits those who overstay their welcome!
🌐 Correlated Pairs to Monitor (Market Context)
Keep your eyes on these relationships — they'll tell you if SOFI is moving on individual strength or sector momentum:
🔸 NASDAQ:UPST (Upstart Holdings) — 📈 Fintech peer correlate. Broader lending sector strength signals = SOFI momentum tailwind!
🔸 NASDAQ:COIN (Coinbase) — 🏦 Digital finance ecosystem player. Tech-forward consumer adoption trends directly impact fintech adoption rates.
🔸 SET:SQ (Block Inc) — 💳 Payments ecosystem leader. Fintech ecosystem health barometer — if SQ is strong, SOFI rides the wave!
🔸 NASDAQ:QQQ (Nasdaq-100) — 🔗 Tech sector correlate. Market risk appetite indicator — if QQQ tanks, watch for tech sector contagion signals!
🔸 NASDAQ:TLT (20+ Treasury ETF) — 🔀 Inverse relationship alert. If rates rise (TLT falls), fintech lending margins expand = bullish for SOFI profits! 📈 If rates fall hard, margin compression = caution flag! 🚨
Key Correlation Insight: Monitor these pairs in real-time during SOFI entry execution — they'll tell you if this is individual strength or sector-wide momentum! 🎯
📋 Trading Rules (Thief Code of Conduct) 🎭
✅ Entry ONLY when price touches your pre-set buy limit zones
✅ Size DOWN if fundamentals deteriorate (earnings miss, regulatory headwinds)
✅ Move stops to breakeven once TP1 is hit — Never give back free money!
✅ Take profits AT resistance — Fighting the market = broke traders
✅ Walk away if SOFI closes below $25.00 — Live to trade another day!
🔥 Why This Setup SLAPS Right Now 📱
✨ Q3 Earnings Crush: 36% revenue growth + profitability milestone achieved
🏦 Fintech Secular Trend: Younger generations ditching traditional banks for digital solutions
📈 Non-Lending Growth: 57% YoY expansion in SoFi Money, Invest, and Credit Card products
💰 Analyst Optimism: 6 of 11 analysts recommend BUY | Target range: $12-$38
🎯 Technical + Fundamental Alignment: The chart AND the fundamentals say "BUY ME"
✨ Gratitude Note
✨ If you find value in my analysis, a 👍 and 🚀 boost is much appreciated — it helps me share more setups with the community!
#SOFI #SoFiTechnologies #SwingTrade #Fintech #TradingSetup #NASDAQ #BullishSetup #TechnicalAnalysis #Daytrader #TradingIdeas #StockMarket #Crypto #FinanceGains #TradingCommunity #Bullish #EntryStrategy #RiskManagement #TP1 #SL #TradingWithBias

Breaking: SoFi Technologies, Inc. (SOFI) Down 7% In Premarket The price of SoFi Technologies, Inc. ( NASDAQ:SOFI ) is experiencing a nosedive in Friday's premarket session. The stock is down 7.5% enroute to the $20 support zone albeit market condition.
The asset's last recorded RSI was 54 further dip could lead to 40 in RSI levels which is prime enough for a bounce back.
iIn recent news, which could have been a precursor to the dip, SoFi Technologies is looking to fund additional business opportunities with an underwritten public offering of $1.5 billion of shares of its common stock.
The digital financial services company also plans to grant the underwriter a 30-day option to purchase as much as an additional 15% of the shares of common stock offered in the offering, it said in a Thursday (Dec. 4) press release.
“SoFi intends to use the net proceeds from the offering for general corporate purposes, including but not limited to enhancing capital position, increasing optionality and enabling further efficiency of capital management, and funding incremental growth and business opportunities,” the company said in the release.
About SOFI
SoFi Technologies, Inc. provides various financial services in the United States, Latin America, Canada, and Hong Kong. It operates through three segments: Lending, Technology Platform, and Financial Services. The company offers lending and financial services and products that allows its members to borrow, save, spend, invest, and protect money; and personal loans, student loans, home loans, and related services.

SOFI more of a fintech company than a traditional bankSoFi Technologies, Inc. (SOFI) is often viewed as more of a fintech company than a traditional bank due to its tech-driven approach to financial services. While SoFi does hold a bank charter and offers conventional banking products like checking, savings, and loans, its core value proposition lies in its fully digital platform that integrates lending, investing, banking, and financial planning.
SoFi was built from the ground up as a technology-first company, prioritizing user experience, automation, and mobile-first functionality. Unlike legacy banks that are adapting to digital, SoFi was born in the cloud, positioning itself more as a modern financial technology platform aiming to be a one-stop-shop for personal finance.

Breaking: SoFi Technologies, Inc. (SOFI) Surge 4% In PremarketSoFi Technologies, Inc. (NASDAQ: NASDAQ:SOFI ) spike 4% in Tuesday's premarket session but sharply consolidated 2.62% .
The daily price chart shows a cup and handle pattern with eyes on the $40 resistant. As of the time of writing, NASDAQ:SOFI has an RSI of 54 giving more room to capitalize on the RSI.
In another news, SoFi Reports Third Quarter 2025 with Record Net Revenue of $962 Million, Record Member and Product Growth, Net Income of $139 Million.
About SOFI
SoFi Technologies, Inc. provides various financial services in the United States, Latin America, Canada, and Hong Kong. It operates through three segments: Lending, Technology Platform, and Financial Services.
The company offers lending and financial services and products that allows its members to borrow, save, spend, invest, and protect money; and personal loans, student loans, home loans, and related services.

Is SOFI Setting Up for a Bullish Reversal Play?🚀 SOFI TECHNOLOGIES INC. (SOFI) — Stock Market Profit Playbook
Strategy Type: Swing / Day Trade
Bias: Bullish Pullback Plan confirmed with 0.786 Hull Moving Average
🧠 Trading Thesis
SOFI is setting up for a bullish pullback confirmation around the 0.786 Hull MA zone.
The idea is simple: wait for price to dip, confirm structure, and then scale in using the Thief Strategy — a multi-layer limit entry approach that lets us catch the bounce with precision.
This setup looks for continuation toward key resistance where profit-taking zones align with overbought conditions and potential traps.
💰 Entry Plan (Thief-Style Layering Strategy)
The Thief Strategy uses multiple buy-limit layers to enter a position smoothly during retracements.
Here’s the plan:
Start layering your buy orders at
👉 $26.50,
👉 $27.00,
👉 $27.50,
👉 $28.00.
You can increase or adjust these levels based on your personal preference or risk appetite.
Each layer allows better cost averaging and stronger positioning if the pullback deepens.
🛑 Stop Loss (SL)
This is the Thief Stop Loss: $25.50.
But, dear Ladies & Gentlemen (Thief OG’s) — I’m not recommending you to stick only to my SL.
Your money, your risk. You make money → you take money. Manage your risk like a pro. ⚖️
🎯 Target (Take Profit)
Our main target sits around $32.50 — this is a strong resistance area, likely to be overbought, and may trap late buyers.
Dear Ladies & Gentlemen (Thief OG’s), again — I’m not recommending you use only my TP.
You decide when to take profits. If you make money, lock it and run like a Thief 🏃♂️💨.
🌍 Related Pairs & Correlation Watch
Keep your radar on the following — they can give early cues about SOFI’s momentum and sector rotation:
💎 ARKK (ARK Innovation ETF) → Fintech & growth exposure. If ARKK rises, SOFI tends to follow.
💎 FINTECH ETFs or Indexes → Check if the overall fintech sentiment is bullish.
💎 SPY & QQQ → Broader tech strength supports SOFI’s upside potential.
📊 Key Focus Points:
Rotation into growth & fintech stocks.
Fed tone on interest rates and macro liquidity.
Breakout volume confirmation above $30 level.
✨ “If you find value in my analysis, a 👍 and 🚀 boost is much appreciated — it helps me share more setups with the community!”
#SOFI #SoFiTechnologies #StockTrading #SwingTrading #DayTrading #TradingSetup #TechnicalAnalysis #StockMarket #FinTech #BullishSetup #TradingStrategy #TheThiefMethod #PriceAction #HullMovingAverage #RiskManagement #TradingIdeas #MarketAnalysis #StockPicks #TradingCommunity #InvestSmart

SOFI $26.50Call – 100% Profit Potential in 5 Days?
🚀 **SOFI Weekly Bullish Alert! \$26 Call Play 💎🔥**
📈 **Strong Call Flow + Rising RSI → Short-Term Bounce Potential!**
**Trade Snapshot:**
* **Instrument:** SOFI
* **Strategy:** Buy Call (single-leg, naked)
* **Strike:** \$26.50
* **Expiry:** 2025-09-12 (Weekly)
* **Entry Price:** \$0.65 (ask at open)
* **Profit Target:** \$1.30 (+100%)
* **Stop Loss:** \$0.33 (50%)
* **Size:** 1 contract
* **Confidence:** 75%
**Rationale:**
* 🔹 Daily & Weekly RSI bullish; strong momentum
* 🔹 Call/Put ratio = 1.80 → institutional bullish skew
* 🔹 Low VIX → cheap premium for a tactical short-term play
* 🔹 Weak weekly volume → risk-managed sizing & tight stop required
**Key Notes:**
* Exit by Thursday to avoid Friday gamma/time-decay
* Watch pre-market gap; stand aside if weak follow-through
* Partial profit-taking possible at +50% (\$0.98)
📊 **Summary:** Strong institutional bullish options flow + rising momentum make \$26 calls a high-probability short-term trade. Risk-managed, tactical entry, 100% profit target.
SOFI $25 CALLS — Lotto Gamma Play into Friday
# 🚀 SOFI Lotto Gamma Play (Sep 4, 2025) 🚀
💡 Strong call flow (C/P = 2.0) but weak volume + falling RSI → HIGH RISK lotto setup
📊 **Market Snapshot**
* 📉 **RSI:** Daily 56.6 / Weekly 79.3 → both falling (momentum fading)
* 📊 **Volume:** 0.6x prior week → low institutional support
* 🔥 **Options Flow:** Strong bullish (heavy calls)
* 🛡️ **VIX:** \~15.7 → low vol regime (favorable for speculation)
* ⚠️ **1 DTE Risk:** High gamma / theta → premium can go to zero fast
---
## ✅ Trade Idea (high-risk scalp)
* 🎯 **Instrument:** SOFI
* 🔀 **Direction:** CALL (long)
* 💵 **Strike:** 25.00
* 📅 **Expiry:** 2025-09-05 (1 DTE)
* 💰 **Entry Price:** 0.22 (ask at open)
* 🎯 **Profit Target:** 0.44 (+100%)
* 🛑 **Stop Loss:** 0.11 (-50%)
* 📏 **Size:** 1 contract only (tiny risk)
* ⏰ **Max Hold:** Exit by **Friday EOD**
⚡ Confidence: **60%** → Lotto play, not a trend trade
---
### 🔖 Hashtags
\#SOFI #OptionsTrading #DayTrading #0DTE #GammaSqueeze #CallOptions #StockMarket #ScalpTrade #TradingSetup #FlowTrade

Breaking the Vault: SOFI Bullish Heist Plan Unlocked!🚨💼 SOFI Technologies Stock Heist Plan (Swing Trade) 💼🚨
Dear Robbers, Hustlers & Thief OG’s 🏴☠️💰
This time the target vault is none other than SoFi Technologies, Inc. (SOFI) 📈.
We’re planning a BULLISH STOCK HEIST with a layered entry strategy – the Thief’s signature move.
🕵️ Entry Plan
The heist doors open at ANY price level 🚪💥.
But remember… a real Thief never enters with one strike – we layer in with multiple limit orders (DCA style).
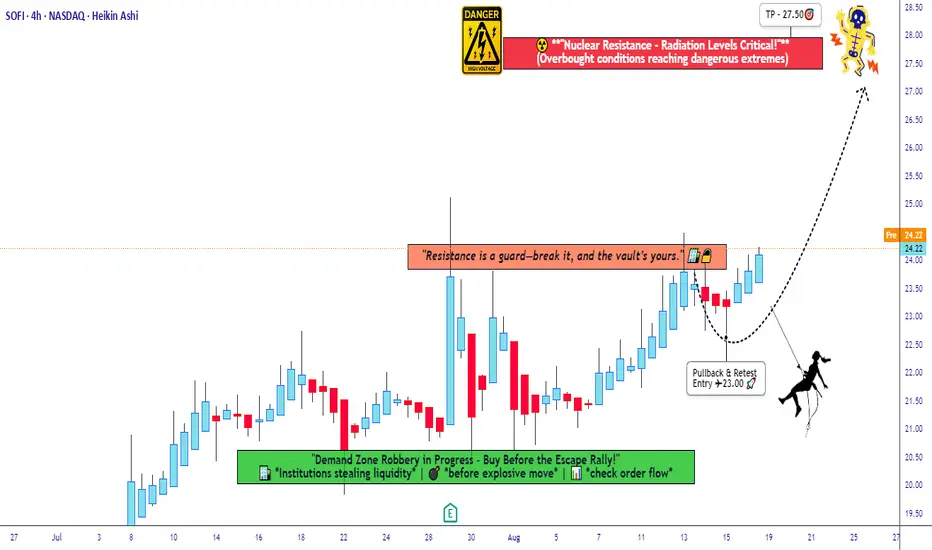
💎 Buy limit layers: 24.00 – 23.50 – 23.00 (you can increase your own layers if greedy 😈).
🛑 Thief Stop Loss (SL)
This is the escape hatch 🚨 – SL @ 22.00.
⚠️ Adjust your SL depending on your risk appetite, capital, and strategy.
(Every Thief OG has their own exit route 🏃💨).
🎯 Target – The Loot!
💥 Heavy resistance (electric fence ⚡) is spotted around 28.00.
So we aim to secure our stolen profits and escape clean at 27.50.
Don’t be greedy – once the vault is cracked, take the bag and RUN 🤑💼.
📢 Final Words from the Thief
Trading is a heist – not every move is safe, but every plan has an escape.
Stick to the layers, respect the SL, and collect the loot at target 🎯.
💖 Smash that BOOST if you’re part of the Thief gang 🔥💼
Let’s rob Wall Street together, one trade at a time 🚀🏴☠️
SOFI LEAP Call Setup: Long-Term Fintech Moonshot?
# 🚀 SOFI LEAP Call Setup: Long-Term Fintech Moonshot? 💎📈 (2025-08-22)
📊 **Market Consensus Recap**
* 📈 Weekly RSI: 84.3 → strong bullish momentum
* 📉 Monthly RSI: 63.1 → fading momentum, overextended zone (99.1% of 52-week range)
* 💵 Institutional Flow: Neutral (Call/Put OI ratio = 1.00)
* 🌪 Volatility: Favorable (low VIX = good LEAP environment)
* ⚠️ Risk: Extreme valuation → caution on new entries
---
# 🎯 TRADE PLAN
* 🏦 Instrument: **\ NASDAQ:SOFI **
* 📈 Direction: **CALL (LONG)**
* 🎯 Strike: **27.00**
* 💵 Entry: **6.00**
* 🛑 Stop Loss: **4.20 (-30-40%)**
* 🎯 Profit Target: **11.40**
* 📅 Expiry: **2026-09-18**
* 📏 Size: **1 contract**
* 📈 Confidence: **75%**
* ⏰ Entry Timing: **Market Open**
---
⚠️ **Key Risks**
* 🚨 Overvalued at near 52-week high (99.1%)
* 📉 Potential correction to \$15–\$18 before next leg
* 📰 Macro/news shocks may hit fintech sentiment
---
# 📌 Hashtags
\#SOFI #OptionsTrading #LEAPs #StockMarket #LongTermInvesting #BullishSetup #Fintech #OptionsFlow #SmartMoney #TradingSignals #BreakoutTrading #SwingTrade

SOFI Setup Before Gamma Squeeze?
## 🐂 **SOFI WEEKLY OPTIONS BREAKOUT SETUP (Aug 4–8)**
**🔥 Bullish Momentum + Institutional Volume Surge = \$22 CALL in Play**
---
### 📌 Summary:
* **Weekly RSI** rising 📈
* **Volume** 2.5x average – strong institutional presence 🏦
* **Options Flow** favors calls: aggressive accumulation
* **Gamma Risk** into Friday + VIX stable ✅
* **Daily RSI** soft = potential dip before rip
---
### 🛠️ Trade Setup:
| Type | Direction | Strike | Expiry | Entry | Stop | Target | Confidence |
| ------ | --------- | ------- | ------ | ------ | ------ | ------ | ---------- |
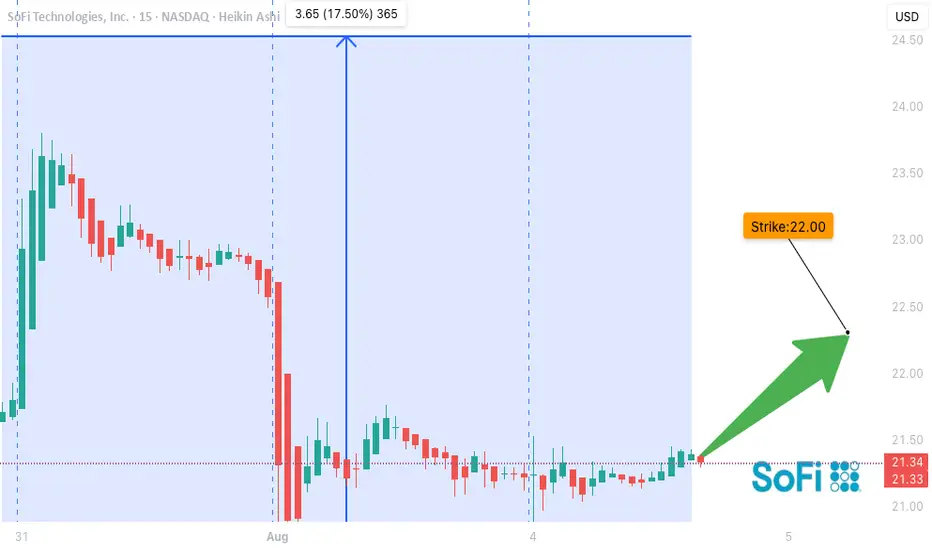
| Option | CALL | \$22.00 | Aug 8 | \$0.34 | \$0.17 | \$0.68 | 70% ✅ |
💡 **Watch for breakout over \$21.50** — potential gamma squeeze to \$23+
📉 Manage risk below \$21.00 / VIX spike
⚠️ Earnings & macro could add volatility
---
### 🧠 Model Consensus:
* **Grok/xAI**: Strongly bullish, confirms flow & breakout potential
* **Claude & Meta**: Volume confirms upside, but caution on RSI
* **Gemini**: Neutral on daily, bullish long-term
* **DeepSeek**: Momentum trend intact, supports call strategy
---
### 📊 Tag Zone:
`#SOFI #Options #TradingView #Bullish #GammaSqueeze #CallOption #VolumeBreakout #WeeklySetup #MomentumTrading #SmartMoney`
$SOFI - Just getting started!NASDAQ:SOFI - Just getting started!
Monthly CupnHandle Breakout
Looks like we will push into new ATH's this year.
Targets: $23.73/ $28.18/ $32.57

$SOFI top after earnings? Downside under $10NASDAQ:SOFI had a positive reaction to earnings, but has since sold off. It looks to me like earnings marked a high and that we're going to see price fall down to the support levels below.
We've now retested the area we broke down from, we've only had 4/5 waves to the downside, so to me, it looks like a last fall is likely before we see a longer term recovery.
Let's see how it plays out.

SoFi is in TROUBLE! Sub $10 inbound?!SoFi Technologies - NASDAQ:SOFI
Revisiting the CupnHandle breakout for a retest: $10.30-$10.66
A break of this area could lead us to fill the October2024 $9.07 GAP and more than likely reach the H&S MM of $8.50 🎯
Would be a phenomenal buying opp down there!

SoFi flush inbound!NASDAQ:SOFI - Dip Buy Opportunity
If you like it at $18 you'll love it at $9!
- Support Broke
- Bearish Cross
- Volume GAP
- Red H5 Indicator
- Down Trending Wr%
Not financial advice

$SOFI: DIP BUYING OPP. INBOUND!NASDAQ:SOFI : DIP BUYING OPP INBOUND!
Are you looking to buy more cheap Sofi shares?
Check this out then...
DIP BUY BOX: $13-$15 🎯
The indicator up top is the Williams %R and it is one of my favorite tools!
Do you see how every time we break above -20 or hit the Red barrier and reject we go all the way down to -80 or the Green Support Beam and vice versa? 👀
Yes, every single time since NASDAQ:SOFI went public back in 2020!
If you are a probabilities person like me then you understand that we most likely will at a minimum go to -80 and would put the price under $15, thus giving an opportunity to investors and traders.
The bullish side to this is this is great consolidation before the next BIG MOVE! Which I believe when the pendulum swings in the opposite direction we could swing to ATHs before getting to the Red barrier!!
This time could be different but the probabilities say it won't be friends. Hope you enjoyed this TA! Have a great Sunday!
Not financial advice

Where are my $SOFI bulls at?! Looking ExplosiveWhere are my NASDAQ:SOFI bulls at?! 👀
We've seen this parabolic setup before...
Rounded bottoms on these other names caused parabolic moves: NASDAQ:PLTR NASDAQ:HOOD NASDAQ:RKLB
Breakout = $32 and new ATHs!!!
Not financial advice

SOFI: Had it's rest and now time to SURGE again!NASDAQ:SOFI 🏦
What once was great will be great again!
We crushed this name into year end to the tune of 73% and smashed all profit targets! 🎯🏹
IT'S GOOD TO BE BACK SOFI!
🎯$16.93📏$18.98 by 07March
Not financial advice

SoFi Technologies (SOFI): Bearish Breakdown and Updated TargetsSoFi Technologies (SOFI) has shown clear signs of weakness after breaking below a head and shoulders pattern on its chart. While some speculate on a lofty $75.00 target, the technicals tell a different story.
🔍 Current Price and Technical Outlook:
SOFI is currently trading at $14.15.
The head and shoulders breakdown suggests further downside potential, with bearish momentum dominating.
🎯 Updated Bearish Price Targets:
1. First Target : $12.68
2. Second Target : $11.49
3. Third Target : $9.20
🚨 Stay Informed :
It's important to focus on realistic targets rather than hype. The technicals are pointing towards potential downside, so managing risk and setting clear exit points is crucial for traders and investors alike.
💬 Do you agree with these targets, or do you see a different trend forming? Let’s discuss in the comments!

Is SOFI about to pullback?!Is NASDAQ:SOFI about to pullback?!
In this video analysis, we will go over:
1⃣ My #HIGHFIVESETUP
2⃣ #SOFI CUP N HANDLE BREAKOUT
3⃣ Trade ideas, including Entry/Exit/PT's
4⃣ ...Find out in the video below
NFA

SOFI ($SOFI) BANK: A FULL TECHNICAL & FUNDAMENTAL ANALYSIS! BUY!NASDAQ:SOFI
SOFI BANK: A FULL TECHNICAL & FUNDAMENTAL ANALYSIS!
Here is what we are going to deep dive into in this video:
1.) Review Sofi's earnings report from this morning
2.) What SOFI's charts are telling us, using my "High Five Setup" trading strategy
3.) A look at the fundamentals of the company and what score /6 SOFI received on my "Valuation Pro Analyzer"
Let me know what you think of my analysis in the comments below. What stocks do you want to see next through my strategies and tools? Did you buy the dip on NASDAQ:SOFI ?
LIKE l FOLLOW l SHARE
Not financial advice.
