SOL/USDT CHART UPDATE. SOL is trading around 85, sitting exactly at the intersection of descending resistance and mid-range support. Price is compressing inside a narrowing structure after the recent push toward 90.
Lower highs still valid (macro downtrend intact)
Short-term higher lows forming from 77.5 base
Volatility contracting → breakout likely soon
Support: 83.5
Major Support: 77.5–78
Resistance: 87–88
Breakout Level: 90+
Strong reclaim above 88–90 → opens room toward 95 and potentially 105 if momentum accelerates.
Rejection here → move back toward 80 and possibly a sweep of 77.5 liquidity before any bounce.
Momentum shift only confirmed above 90.
⚠️ This is a decision zone — next 1–2 candles could define direction.
SOL

Solana —The correction bottom is revealed through high buyingA simple signal: The lowest price in years also produced the strongest buying session in an entire year.
On the 6th of February 2026, SOLUSDT hit the lowest price since January 2024, more than two years ago. On the same day, the highest buy (green) volume bar showed up since February 2025.
This is a very simple and clear signal that shows that the correction bottom is in. As the correction ends, we get to witness, experience and enjoy the start of a new market phase —a very strong bullish wave.
The same happened in April 2025. Solana did the same. The lowest price in years and also the highest buy (green) volume day and this was the start of a 164 days long bullish market phase. Even a blind dead monkey can see this.
Thank you for reading.
Namaste.

#BITCOIN Halvings, length of tops and bottoms. $100K TOP?Due to the economic mass and increased liquidity
are we about to see the most disappointing #BTC bull run
Each Bull run has a remarkably similar ratio of diminishing returns.
Suggesting a high of around $90k,
Based on a Low $13k being achieved in the following few weeks!
If indeed the June low was to hold
it still only improves the amplitude of the next high by around $20k.
As the foundation for the crypto market, if the high is met with a BTC.d of 20%
That signals a 10 Trillion market cap
so picking Good products and platforms could still be a monumental place for price appreciation.
#ALTS #ALTCOINS
#HEX #NEAR #SOL #EGLD #MKR #AAVE #PULSECHAIN #ETH

Coinranger|ETHUSDT. Uncertainty at 80🔥News
🔹US unemployment data will be released at 16:30 UTC+3. It will be important if the actual numbers differs significantly from the forecast.
🔥SOL
🔹Solana's situation is similar to its senior colleagues:
1️⃣ A dynamic level is emerging at 82 above. The first wave up is potentially at 86.
2️⃣ Below 77 is still relevant.
Selling trades should be making cautionly today, although the priority for a downward move remains, there is a possibility of sharp price surges upward.
---------------
Share your thoughts in the comments!

Solana 5X Long with 890% profits potentialAs you can see here, I am only using very conservative targets but it is possible that Solana already completed its full bearish cycle. This is irrelevant to us right now because we are measuring only a mid-size move.
For the purpose of this trade, we focus only on the next 30-60 days. 60 days being a very long time.
This is a nice chart setup. "Buy when the market is red."
Notice the counterintuitive nature of this process, of these signals, of these trades. Notice how we are going in, with confidence and force, when everybody is running away.
Notice how we abhor buying when prices are high, yet we love entering, looking for opportunities when prices are low in order to go long.
Notice the size of the position and timing. Notice how many times we get it wrong.
Then, focus on the results... Just watch!
Wait and watch. Take action and watch. Buy and hold.
Take action and enjoy... It is already confirmed. The bottom has been settled, it is hard because it is right. Easy has never done anything when it comes to trading long with success.
When you feel 100% certain, the market goes the other way. When things look bad, when everything is at its worst, that's when the market turns. From the bottom we grow.
Full 5X trade-numbers for Solana are made available below—for your entertainment of course:
_____
LONG SOLUSDT
Leverage: 5X
Potential: 890%
Allocation: 5%
Entry zone: $66- $80
Targets:
1) $95
2) $111
3) $138
4) $160
5) $182
6) $214
Stop: Close weekly below $65
_____
Thank you for reading.
Namaste.

$SOL 1W Update: In the middle of the range here Solana looks like it wants to produce a relief bounce, but zooming out on the weekly, it’s still trading in the middle of a large multi-month range, which limits immediate upside expectations. After the aggressive breakdown through 125.5, momentum has clearly shifted bearish, yet the pace of the selloff is beginning to stretch as price presses into the 80 region, an area that previously acted as a reaction zone. This is typically where short-term exhaustion can develop, especially after a clean channel breakdown like we’ve seen.
That said, structurally SOL is not at macro support yet. The true higher-timeframe demand sits closer to 44, meaning any bounce from here is likely corrective unless price can reclaim 125.5 and build acceptance back inside the prior range. In other words, the market may be due for relief, potentially back toward 95–110, but within the context of a broader corrective phase. Until SOL starts printing higher highs and reclaiming lost range support, rallies are more likely to be sold into rather than the start of a fresh expansion leg.

Solana looking desperate....SOL is testing a major high-timeframe demand zone and sitting at a key inflection area.
Bullish case
If price reclaims this level and holds it as support, we could see a relief bounce back into prior supply and volume resistance.
Bearish case
If it fails to reclaim and builds structure below, momentum favors continuation lower toward deeper macro support.
Daily momentum is pressing into oversold territory. That increases the chance of a bounce, but confirmation is still needed.
This is decision time.
Reclaim the level and structure can repair.
Lose it and downside pressure likely continues.

$BTC 1W: Zoomed out update, down we go Bitcoin continues to weaken on the weekly timeframe after decisively losing the 72.9k support, with price now trading in the mid-60s and firmly below the rising trendline that had supported the broader uptrend. The rejection from the 92.6k region marked a clear lower high, and the impulsive breakdown that followed shifts momentum firmly in favor of sellers in the near term. Structurally, this opens the door for a grind lower toward the major macro support around 52.8k, which represents the prior cycle higher low and the most important level on the chart. From a market structure perspective, it would not be surprising to see BTC chop and bleed lower into that 52k region, allowing time-based correction and sentiment reset before any meaningful reversal attempt. While this does not invalidate the broader bull market unless 52k is lost on a weekly closing basis, the current trend favors rallies being sold until strong acceptance back above 72.9k occurs. For now, the path of least resistance remains slightly lower, with 52k acting as the key demand zone that could determine whether this is a deeper bull-market retracement or the start of something structurally heavier.

SOLANA (1W): Trend Channel Broken - Oversold Opportunity or TrapSOLANA (1W): Trend Channel Broken - Oversold Opportunity or Trap?
Technical Analysis: We are analyzing the weekly chart of SOL/USD. The market structure has shifted significantly as price action has violated the long-term Ascending Parallel Channel that has guided the trend since 2020.
Key Technical Points:
Channel Breakdown: The price is currently trading below the multi-year support trendline. This is a major structural shift from bullish to bearish/neutral. The "easy mode" trend is officially over.
Critical Support ($79 Zone): The price is testing a crucial horizontal support level at $79. This is the line in the sand. A weekly close below this level opens the door to lower targets.
RSI Capitulation (The Bull Case): The Weekly RSI is currently at 26, a level historically associated with major cycle bottoms (matching the 2020 pre-pump lows and the 2022 FTX crash lows).
This extreme oversold condition suggests that selling momentum is exhausted and a mean reversion bounce is highly probable.
Conclusion: While the trend break is bearish, the RSI capitulation signals a high-probability zone for a relief rally. This is a high-risk area where contrarian traders look for entries, strictly invalidated if the $79 support is lost.

Coinranger|SOLUSDT. Continued decline🔥News
🔹Unemployment data at 16:30 UTC+3
🔥SOL
Obviously, we're following ETH and BTC:
🔹83 is a dynamic level above.
🔹Below, there are 80 and 77 – remaining levels of the full set of downward waves.
Be careful at 16:30 UTC+3. Increased volatility is possible.
---------------
Share your thoughts in the comments!

SOL Elliott Wave IdeaSeems like SOL nearing the bottom, possibly wave 4 of C with the 1:1 extension for wave C at $54

SOLUSDT(solana)We can be hopeful that after breaking out of the wedge, we will see significant price growth.AB=CD
Best regards CobraVanguard.💚

SOL 1W Update: Zoomed out thoughts and viewSolana’s weekly dump is showing signs of exhaustion, with downside momentum clearly decelerating as price presses into a major long-term demand zone around 80–85. The sell-off has been steep and highly directional within a falling channel, which often precedes mean-reversion relief moves rather than immediate continuation. Notably, SOL has already retraced a large portion of its prior impulse leg and is now trading well below former range support at 125.5, suggesting late sellers are entering after most of the damage has been done. While the broader structure remains corrective until higher levels are reclaimed, the risk–reward is beginning to shift in favor of short-term upside relief. A bounce toward 100–110 would be a reasonable first reaction if buyers step in, with a more meaningful trend improvement requiring acceptance back above 125.5. As long as 44 holds as macro support, this move still fits a deep bull-market correction, and current price action favors stabilization and a counter-trend bounce rather than continued freefall.

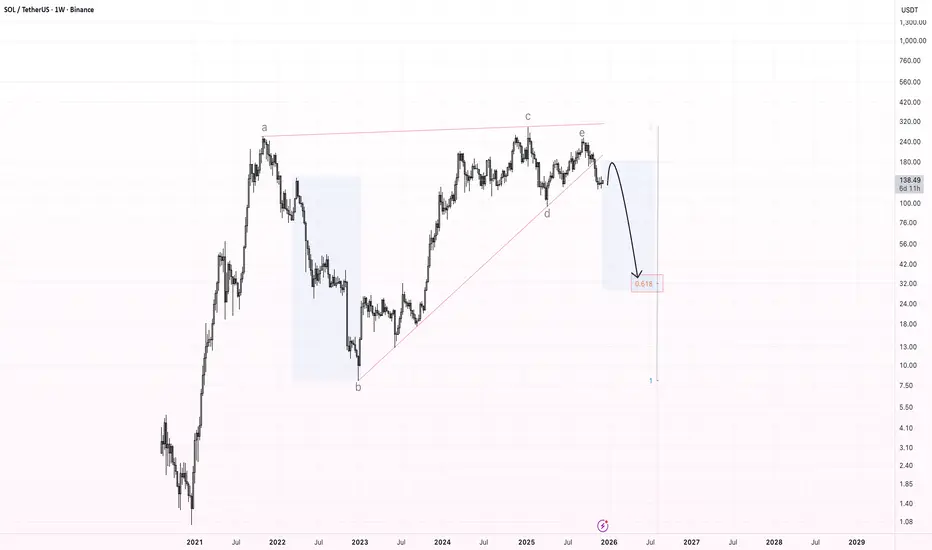
SOL – Bearish Rising Wedge Breakdown (Weekly Chart)The chart shows a large multi-year bearish rising wedge , which has now been broken to the downside. This wedge has been forming since the 2022 bottom and consists of clear wave structure (a–b–c–d–e), with the final wave e rejecting at the upper boundary and triggering the breakdown.
After this kind of pattern, the market often provides a relief bounce back into the broken support , which should now act as resistance . For SOL, the expected retest zone is located around $170–$190.
If price confirms resistance there, I expect the beginning of a larger downward wave , targeting the main Fibonacci zone near the 0.618 retracement, which aligns with a long-term target around $30–$40.
This zone marks the primary downside target for a full wedge breakdown.
Key Points:
Multi-year bearish rising wedge has broken.
Expected retest: $170–$190.
Major downside target: $30–$40 (0.618 zone).
Potential start of a macro corrective wave.
SOL, Finding support for a bottom?CRYPTOCAP:SOL took a hit last week on the capitulation event, printing a strong bottoming candle with a long lower wick.
Price has now reached my wave 4 ytarget of the 0.382 Fibonacci retracement at the major High Volume Node support, between the S1 nd S2 pivot.
Daily RSI hit oversold, but with no divergence. The trend remains down, below the daily pivot and daily 200EMA, but could be finding a bottom soon.
Safe trading

Solana —Can there be a strong relief rally? 2022 vs 2026 The 2022 bearish cycle is different to 2026-25. The previous bull market ended with a top in November 2021. The most recent bull market ended with a double-top in January-September 2025.
After a major down-wave lasting 112 days, SOLUSDT produced a strong relief rally (+90%) sometime around February-March 2022.
A major down-wave in the current cycle has been on for 140 days. A long-term support zone, the 0.786 Fib. retracement level has been activated. A relief rally can show up somewhere around February-March 2026 similar to February-March 2022, based on the current chart structure.
Back in 2018 Solana hit bottom at a price of $1. In 2022, the bottom happened at a price of $8, eight times higher. In 2026, we have a major support being activated at a price of $67.5, roughly eight times higher compared to the previous low.
This chart supports bullish action. It is even possible that Solana's bear market already reached its end.
Namaste.

Solana dropped 27 from area where $250m worth of Open interedI hope u remember this idea
perfect drop from vwap + OI

SOLUSDT – Trading Plan for Today | Feb 07🔥 SOLUSDT – Trading Plan for Today | Feb 07
Context:
The overall market context remains bearish.
Today’s session opened with a bullish move, but the current structure does not confirm sustained upside continuation.
With low liquidity conditions, I expect price rotation between daily zones.
Short scenario (priority):
– today’s primary target is the lower daily short zone,
– looking for short reactions from supply areas.
Long scenario (alternative):
– only after acceptance and holding above the daily long zone,
– the target becomes the upper daily long zone,
– with increasing liquidity, an extension toward daily reversal zones is possible.
The key level is considered a potential price holding level.
Market scenarios:
Context:
This is not financial advice. Proper risk management is required.

SOL/USDT — Oversold Deviation: Reversal Potential With Key Risk Price has swept support formed by a horizontal level and the lower boundary of the channel (which could still act as a global bullish flag).
Weekly RSI is approaching levels last seen at the 2022 bear-market bottom, during the Alameda/FTX panic.
From a technical standpoint, conditions for a reversal are strong — except for the absence of a clear candle reversal setup.
On the downside (beyond current portfolio drawdown):
• a sustained hold below $76 opens a liquidity void. Historically, price moves through this area quickly with little reaction.
There are only two zones where the move could slow or pause — if that scenario plays out, SOL would need to be reassessed there.
🎯 Primary bounce target: $116
🎯 Intermediate target: $95

SOL for $79?Greetings to all 😊
Many people in their personal messages asked about the possible further movement of the SOL coin, after it reached the previously designated goals (see the last review)
💡 I can say one thing: while the asset is trading under the important level of $189.31 , it is not worth considering purchases for a long time, since the context is short
◾️ The global picture looks like this: we have a 12M chart that shows the reaction from the zone of interest and the price moving below the support level
◾️ I would like to note that we also have the min of last year, which has accumulated liquidity - 79$
⚡️ All timeframes are in a descending structure
▫️ If the price does not recover its values > 180$ this month, then I will expect a decrease to low (79$)
▫️ on the chart of the month , the price is trading sideways
▫️ We have removed the nearest liquidity on the weekly chart and are showing a corrective movement
▫️ On the daily timeframe, the price came to trend support and is trading sideways
Here we are interested in two zones between which the price is squeezed:
resistance of $ 145 - $ 151
and support of $133.74 - $ 137.76
📌 While the price is in uncertainty between sellers and buyers, it is better to wait for the manifestation of one side and then make a decision.
📍 And remember: not every deal is your deal.
Good luck to all ☘️

Solana hits a new all-time low on its weekly RSISolana just hit the lowest point ever on the RSI, even lower than November-December 2022.
In December 2022, the previous all-time low, Solana traded at a price of $8. The weekly RSI hitting the lowest ever signaled a true bottom and a strong trend reversal. It signaled the start of a bull market that ended only in January 2025.
This is the same signal we have today. Solana went even lower on the weekly RSI and this gives us an extreme oversold condition.
The RSI peaked December 2023, so it has been dropping for more than two years. With this major low, a reversal can happen anytime now. We can expect bullish action next.
The RSI being oversold and at an all-time low doesn't necessarily means that a price reversal will happen right away, but it is a very strong reversal signal nonetheless. It can easily support a bullish cycle, one lasting several months.
Thank you for reading.
Namaste.

SOL $80 bottom?CRYPTOCAP:SOL is accelerating in wave C of 4 and now coming into a major High Volume and 0.382 Fibonacci retracement zone where wave 4 has a high probability of ending.
Wave Cs are characteristically scary for investors and come with extreme negative sentiment and quick drops to add fuel to the fear. Thats why they are capitulation events.
Losing $80 bring up the weekly S1 pivot at $8.
Weekly RSI has hit oversold but with no divergence.
Safe trading

Solana $250m of Open itnerest entered - time for some moveSolana $250m of Open itnerest entered - time for some move
Open interest increased by $250m (16%)
What would be the next? Share your thoughts
