SOL/USDTSolana has broken down from the global ascending channel. A new descending channel has formed, and price is now holding below its midline — a bearish trigger.
At the same time, there are several factors that keep a potential bounce on the table:
• price is sitting on a strong liquidity level,
• a rough but double bullish divergence has formed,
• there is an unfilled deviation around ~$150, making a bounce toward that level logical.
A move toward a channel retest in the $180+ area is possible, but the probability is limited.
⚠️ If the bounce fails, downside levels to watch:
• $100 — psychological level,
• $95 — previous low,
• $76 — major liquidity level.
A sustained break below $76 would be extremely negative — below that, structure deteriorates fast.
Last time this scenario played out, price eventually dropped to $8.
SOL

SOL & XRP - Decision Time at Weekly Structure!⚔️Both SOL and XRP are now sitting at a major weekly support zone , clearly marked in blue. This is not just a random level, it’s a key structural area that has defined direction in the past.
From here, the market is at a crossroads: 🔁
📉If this weekly support breaks , it would signal a loss of structure, opening the door for further long-term bearish continuation toward the green demand zone below.
📈On the other hand, for bulls to regain control, price must prove strength. That confirmation comes only with a break above the last major daily high, marked in red. Without that, any bounce remains corrective, not a trend reversal.
In short:
Structure is being tested.
Reaction matters more than prediction.
Do you think this support holds, or are we heading deeper into demand? 📊
⚠️ Disclaimer: This is not financial advice. Always do your own research and manage risk properly.
📚 Stick to your trading plan regarding entries, risk, and management.
Good luck! 🍀
All Strategies Are Good; If Managed Properly!
~Richard Nasr

Solana (SOL) Attempting Breakout – Eyes on $145 and $174SOL is currently testing the $126 zone, aiming to reclaim ground after a prolonged downtrend. This level aligns with a descending trendline that has acted as dynamic resistance. A clean breakout above it could trigger a shift in momentum and pave the way for higher targets.
💡 Trade Setup:
Entry Zone: $120 – $126
Take Profit 1: $145
Take Profit 2: $174
Stop Loss: $112
A strong candle close above $126 could confirm bullish continuation. Watch for volume to support the breakout. If rejected, SOL may retest lower supports—risk management is key.

Solana Price Prediction: SOL at a Make-or-Break Moment* The SOL price is pressing into a long-term resistance trendline that has capped every recent recovery attempt, making this level critical for the next move.
* On-chain data shows cooling activity rather than capitulation, indicating consolidation as SOL trades near a decision point.
* A confirmed breakout could shift momentum higher, while rejection keeps downside risks in focus around key support zones.
When you zoom out and look at Solana's recent price action, it’s clear the market isn’t in panic mode anymore, even after a long and frustrating decline.
The SOL price didn’t just drift lower quietly. The price rolled over from earlier highs and spent weeks grinding down, breaking confidence along the way. But lately, the behavior looks different. Markets are accepting a pause rather than a breakdown; it feels like taking stock after the recent damage.
Right now, the SOL price is trading around the $120–$130 zone, with $126.18 sitting near the middle. Just beneath that is a well-defined support zone spanning $110 to $120 that has held firm through multiple tests. Each dip into that zone has been bought, even if the rebounds haven’t been strong.
That matters because after slicing through multiple levels during the downtrend, this is the first area where selling pressure has clearly slowed. Moves lower are getting absorbed faster, suggesting sellers are losing urgency, even if buyers aren’t fully confident yet.
On-chain data supports that view. Solana’s market cap has stopped falling sharply and has started to level out. Capital isn’t rushing out of the ecosystem anymore, which often points to consolidation rather than continued distribution.
Network activity tells a similar story. Active addresses and transfer counts have cooled, but they remain well above bear-market lows, signaling usage is stabilizing rather than collapsing.
What’s next for SOL?
The biggest hurdle is still overhead resistance. On lower timeframes, the SOL price continues to respect a clean descending trend line that has rejected every bounce. Each attempt has stalled quickly, showing buyers are cautious and conviction remains limited.
That trend line is the key level. A break and hold above the $135–$140 area would significantly improve the structure. In case the price can’t push through higher levels, another rejection could push SOL lower toward the $110-$120 support area, where multiple tests could pose a threat of steep declines.
Currently, Solana is in a wait-and-see moment. Although the selling pressure has receded, the market chart has yet to indicate a willingness on the part of buyers to dominate the market.

New Court Case DISASTEROUS for SOLANA?Quite silently, Solana may be heading into one of the most consequential legal challenges it has faced to date.
The implications reach far beyond short-term market of SOL -it will likely affect MANY more crypto's and projects.
A US federal judge has recently (past few days) approved a class action lawsuit to proceed against several parties tied to the Solana ecosystem, including Solana Labs and entities connected to PumpFun. This isn’t speculative rumors; the court has ruled that the claims presented are substantial enough to warrant deeper examination.
The argument of the case is an allegation that cuts directly into Solana’s technical design. Plaintiffs argue that certain insiders benefited from preferential access created by the network’s validator structure and transaction-ordering mechanisms. In practice, this allegedly allowed privileged actors to enter positions earlier, exit faster, and systematically offload risk onto retail participants.
The court’s decision suggests regulators and judges are increasingly willing to scrutinize not just token issuers or apps, but the underlying blockchain infrastructure itself when assessing fairness and market access. Therefore, it could be consequential for the rest of the crypto market as well in the near to long term.
That framing introduces a serious existential risk.

Bullish on SOLBullish Channel has formed and with the next touch along the lower trend line I think price will go up. Especially through 2026.
SOL is a good third to BTC and ETH imo.

TOTAL Crypto Market Cap - Double Head & Shoulders?Market: CRYPTOCAP:TOTAL Crypto Market Cap
Assets referenced: COINBASE:BTCUSD , COINBASE:ETHUSD , COINBASE:SOLUSD , CRYPTO:BNBUSD , COINBASE:XRPUSD , COINBASE:ADAUSD , COINBASE:AVAXUSD , COINBASE:DOTUSD , COINBASE:LINKUSD , CRYPTO:MATICUSD
The TOTAL crypto market remains in a long-term bullish structure, supported by sustained adoption across major assets like Bitcoin, Ethereum, and Solana, alongside continued development in ecosystems such as BNB Chain, Avalanche, Polygon, and Polkadot.
That said, markets do not move in straight lines.
Historical cycle behavior
In previous crypto cycles (2017 and 2020–2021), periods of strong expansion across BTC, ETH, and large-cap altcoins were followed by:
Broad market pullbacks of ~20–40%
Corrections that held above prior cycle highs
Multi-month consolidations before continuation
These pullbacks ultimately offered the best long-term entries for Bitcoin, Ethereum, and quality altcoins like LINK, ADA, AVAX, and MATIC.
Current market structure
TOTAL market cap remains above key long-term support
Momentum has cooled without structural breakdown
Price action resembles a macro decision zone, not a trend reversal
A pullback toward prior resistance-turned-support would align with:
Historical crypto market cycles
Rising long-term trendlines
Past accumulation zones for BTC and ETH
This would represent a higher low on a multi-year timeframe, consistent with healthy bull markets.
Institutional context
This cycle differs from previous ones due to institutional participation:
Spot Bitcoin ETF flows
Growing Ethereum ETF exposure
Increased corporate and custodial adoption of digital assets
Sustained institutional demand could:
Limit downside volatility
Turn deeper corrections into sideways consolidation
Support continued strength across BTC, ETH, SOL, and large-cap altcoins
Conclusion
The long-term thesis for crypto remains intact.
Bitcoin and Ethereum continue to act as macro anchors, while ecosystems like Solana, Avalanche, Polygon, and Chainlink reflect ongoing innovation beneath the surface.
A pullback would not be bearish - it would be structurally healthy and potentially offer high-quality long-term entries.
Bullish long-term. Patient near-term.
Watching structure across the TOTAL market, not short-term noise.

SOLUSD at long-term linear-regression supportSOLUSD has had a rough year in 2025 with major drawdowns and new highs as well. Neither bulls nor bears have had a painless path.
Will 2026 be different? A lot depends on the Fed, liquidity, inflation prints, and more.
But SOL found a bottom today at the -2 standard deviation line on a log-scale linear regression going back to the all-time low in December 2022. This is a convenient tool developed by @Forza that is an open-source script that "slightly modifies TradingView's built-in linear regression script" which allows it to be plotted on log-scale charts. I've thought recently that it may be worth taking a shot at SOL long, with risk limited to the -2 standard deviation line on a log scale chart.
The AVWAP from the inception of the chart (shown weekly above and dates back to June 2021 for this particular exchange's chart), lies around $96-$97.
No certainties exist in trading or investing, and a flush in 1Q would bring further pain to bullish SOL traders and long-term SOL investors. But if SOL continues its bullish path since late 2022, it could reach new all-time highs in 2026-2027. Maybe it's an investment worth considering. As always, do your own research!

Solana Long Term Market Structure StudyMulti Cycle Perspective Into 2026
This publication outlines a long term market structure thesis for Solana based on historical crypto cycles, network development trends, and relative positioning among large cap digital assets. The analysis is educational in nature and focuses on spot market behavior only.
This is not a short term trade idea. It is a cycle based accumulation and distribution framework intended for extended holding periods and significant volatility tolerance.
Important Scope and Risk Context
• Spot market framework only
• No leverage assumptions
• No short term timing precision
• High volatility expected throughout the cycle
Crypto assets experience frequent 30 to 50 percent drawdowns even during bullish phases. Any framework relying on leverage would likely fail structurally due to normal volatility.
Macro Cycle Context
Historically, crypto markets have followed broad expansion and contraction phases aligned with Bitcoin supply events and liquidity cycles.
Observed historical reference points:
• 2017 cycle peak with extreme altcoin expansion
• 2021 cycle peak with institutional participation
• Current cycle forming into 2025 to 2026 window
Each cycle has shown diminishing multiples at the market level while still allowing select assets to outperform due to network usage and adoption growth.
Solana Relative Positioning
Solana entered the prior cycle as an emerging network and has since transitioned into a mature Layer 1 ecosystem.
Current positioning includes:
• Proven network resilience post 2022 drawdown
• Active DeFi NFT and DePIN ecosystems
• Consistent high developer participation
• Increasing institutional infrastructure interest
This places Solana in a different structural position than it occupied during the prior expansion phase.
Price Structure Context and Target Framework
Historical reference points:
• Launch period near single digit pricing
• Prior cycle peak near 260
• Bear market low near single digits
• Current multi month consolidation between 180 and 250
The upper projection zone near 680 is derived from conservative multiple expansion rather than extreme cycle assumptions.
Framework considerations:
• 3 to 4 times expansion from current range
• Prior cycle expansion far exceeded this multiple
• Market capitalization would remain well below Ethereum historical dominance
• Fibonacci extensions from the cycle low project into the 650 to 750 area
This projection is not based on exponential assumptions and remains within historical precedent for mature altcoins during expansion phases.
Network Fundamentals Supporting the Thesis
Network Activity
• Sustained high transaction throughput
• Low transaction cost enabling real usage
• Daily transaction counts consistently elevated
DeFi and Economic Activity
• Recovery in total value locked post drawdown
• Growth in liquid staking and derivatives infrastructure
• Increasing presence of yield generating protocols
Developer Engagement
• Consistent ranking among top networks for development activity
• Production level applications rather than experimental deployments
Market history shows that usage driven growth tends to outperform speculative narratives during sustained expansions.
Potential Catalysts During the Cycle
Structural Catalysts
• Validator client upgrades improving throughput and resilience
• Expansion of stablecoin settlement usage
• Continued maturation of on chain payment infrastructure
Market Catalysts
• Institutional product speculation
• Broader access through regulated investment vehicles
• Increased enterprise experimentation
Catalysts act as acceleration mechanisms, not guarantees.
Technical Structure Overview
• Long term higher low structure intact since bear market bottom
• Prior resistance acting as support within the current range
• Extended consolidation consistent with accumulation phases
The 180 to 250 region represents a structural balance zone, not a timing signal.
Accumulation and Distribution Framework
Accumulation Phase
• Gradual position building within the established range
• Emphasis on patience and risk sizing
• Expectation of drawdowns during accumulation
Expansion Phase
• Volatility increases alongside trend acceleration
• Sharp corrections remain normal
• Emotional discipline becomes critical
Distribution Phase
• Incremental profit reduction rather than full exit timing
• Scaling out into strength reduces cycle risk
• Avoidance of peak prediction behavior
Why Spot Market Structure Matters
Crypto volatility structurally penalizes leverage during expansion cycles.
Observed behavior during prior cycles:
• Deep pullbacks occur even within strong trends
• Liquidation events remove participants before trend completion
• Spot holders retain optionality through volatility
This framework assumes survivability over optimization.
Risk Factors to Consider
• Cycle timing deviation
• Regulatory changes
• Network reliability events
• Competitive pressure from other scaling solutions
• Macro liquidity contraction
• Token emission dynamics
Any one of these factors could materially alter outcomes.
Relative Asset Comparison
• Larger than experimental networks
• Smaller than dominant incumbents
• Established enough to survive downturns
• Volatile enough to outperform in expansion phases
This positions Solana in a middle ground between stability and growth potential.
Summary Framework
This study outlines a cycle based structural thesis rather than a prediction.
Core assumptions:
• Multi year horizon
• Spot exposure only
• Volatility acceptance
• Defined risk allocation
• Gradual accumulation and reduction
Outcomes are uncertain and non linear. This framework is one interpretation of historical behavior and current structure.
Final Notes
This content is educational and speculative in nature. It does not constitute financial advice or a recommendation to engage in any transaction. Digital assets are highly volatile and carry risk of significant loss. Historical patterns do not ensure future outcomes.
Market participants should conduct independent research, assess personal risk tolerance, and size exposure conservatively.

SOL Update: Downtrend confirmed, hold on to your horses SOL Update: Solana remains in a clear downtrend, with price continuing to respect the descending channel that’s been in place since the breakdown from the highs. The broader structure is defined by lower highs and lower lows, and each bounce so far has been corrective rather than impulsive. The recent move back toward the ~$125 area looks more like a relief reaction than a genuine attempt at trend reversal.
The ~$125 zone is a key inflection point, but at this stage it’s acting more like resistance than support. Price has struggled to reclaim and hold above that level, and without a strong impulsive push and follow-through, it’s hard to make a case for acceptance back above it. As long as SOL remains below this level and inside the descending channel, the path of least resistance remains lower.
Zooming out, this aligns with the broader crypto market working through a corrective and risk-off phase, where strength tends to fade and rallies get sold. In that environment, higher timeframe downtrends typically persist until a clear base forms or a major level is reclaimed. For SOL, that means continued downside risk and consolidation until structure improves.
For now, I’m treating any moves into resistance as corrective and staying cautious. Until SOL can break the downtrend and reclaim key levels with conviction, this remains a downtrend-first market rather than a buy-the-dip environment.
Looking for more down, and then eventually hopefully some relief.

SOL: Range trading. This is not a trading setup!NOT A TRADING SETUP! Trading plan: If a model similar to the one shown on the chart forms, then we are more likely to reach the upper limit of the range.
We are closely monitoring the development of this model on the four-hour timeframe.
BINANCE:SOLUSDT.P

SOLUSDT - Countertrend correction to resistanceBINANCE:SOLUSDT , after updating its low, is forming a correction to the resistance conglomerate, but will the bears be able to hold back the upward movement?
Bitcoin is testing 90K but is currently unable to consolidate above this zone. This is having a negative impact on the entire market. SOL is testing the 125.5 zone of interest after updating its low. If the bears keep the price below this level, SOL may come under pressure.
Two key areas of interest: 124.5 and 128.9. If 124.5 does not hold the market, then before falling, within the global downtrend, SOLANA may test the upper resistance.
Resistance levels: 124.5, 128.9
Support levels: 120.15, 116.7
Global and local trends are downward. At the moment, a countertrend correction is forming, which may be stopped in the indicated areas. A false breakout could trigger a decline.
Best regards, R. Linda!

SHORT IDEA SOL is showing weak momentum after a failed push higher.
Price got rejected from resistance, and sellers are stepping in.
RSI is rolling over, showing bearish divergence and loss of strength.
As long as SOL stays below resistance, I’m expecting a move lower toward support.
Bias remains bearish until we see a strong reclaim.
Not financial advice. Trade with confirmation.

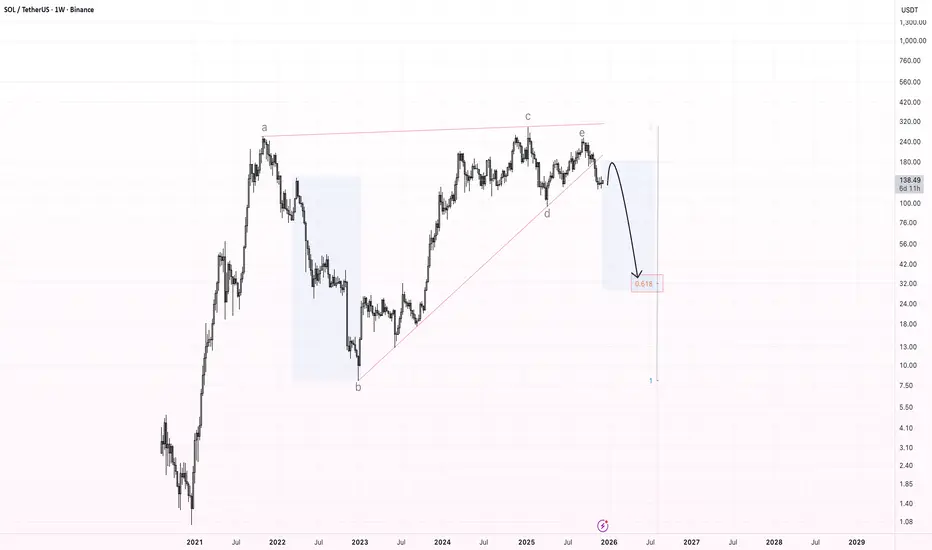
SOL – Bearish Rising Wedge Breakdown (Weekly Chart)The chart shows a large multi-year bearish rising wedge , which has now been broken to the downside. This wedge has been forming since the 2022 bottom and consists of clear wave structure (a–b–c–d–e), with the final wave e rejecting at the upper boundary and triggering the breakdown.
After this kind of pattern, the market often provides a relief bounce back into the broken support , which should now act as resistance . For SOL, the expected retest zone is located around $170–$190.
If price confirms resistance there, I expect the beginning of a larger downward wave , targeting the main Fibonacci zone near the 0.618 retracement, which aligns with a long-term target around $30–$40.
This zone marks the primary downside target for a full wedge breakdown.
Key Points:
Multi-year bearish rising wedge has broken.
Expected retest: $170–$190.
Major downside target: $30–$40 (0.618 zone).
Potential start of a macro corrective wave.
SOL mid-term TASolana is still very bearish on mid-term trend, as well as long-term there's no change in direction. Daily time frame is strictly bearish and currently Solana is entering the bearish area again, which may pull the price deeper to the previous lows around $90ish area.

BTC Update: Chop, Chop, Chopping Wood. Don't get shaken out. BTC Update: Price is doing exactly what I was expecting after the prior expansion phase - chopping and grinding rather than resolving immediately. Despite the growing panic and bearish sentiment, the market has not seen a true downside flush yet. From a structural perspective, this still looks like a higher timeframe consolidation rather than a full trend breakdown.
On the weekly, BTC remains above major cycle support, and the recent weakness appears more corrective than impulsive. Historically, these types of ranges tend to resolve with one final liquidation move to reset positioning. I’m still watching for a sharp downside extension into the ~$70k region, which would represent a deeper test of higher timeframe demand and a more complete sentiment washout.
What stands out most right now is sentiment. Fear has escalated quickly relative to actual structural damage, which is typically what you see before a final flush, not after one. Until that move happens, I expect continued volatility and frustration as the market works through excess leverage.
Assuming a proper reset plays out, this would likely set the stage for a cleaner continuation higher into early next year. For now, patience is key - this phase is about letting the market finish its reset before the next sustained leg develops.

SOLANA reversal soonOn my opinion Solana has the cleanest EW count
Structure is well readable
Price is moving down after triangle was formed
Reversal will come after this wave 5 will be completed

SOLANA Buy Signal With 60% Profit (3D)Considering that Solana is approaching a strong demand zone and if this corrective wave reaches the entry area it will result in more than a 55% price drop we will be looking for long buy positions at the two specified entry points.
The origin we are approaching is a strong one that has previously swept liquidity pools therefore there is significant money flow in that area.
We have two targets at the first target you should take profit and then move to break even this is a higher time frame setup and this signal may take several weeks to play out.
Do not enter the position without capital management and stop setting
Comment if you have any questions
thank you

SOLUSDT – Long Trade Setup and Analysis | 4H)SOLUSDT – Long Trade Setup and Analysis | 4H)
SOL is currently trading within a high-probability demand zone (123–121) that has been tested multiple times. Price compression at this base suggests that sellers are exhausted, and an upward reaction is likely.
Trade Plan
Entry Zone: 123 – 121
Stop-Loss: Below 121 (Daily close preferred)
Targets:
T1: 132 – 135
T2: 140 – 145 (Major resistance and range high)
Technical Analysis
Strong Horizontal Support: Multiple reactions confirm that buyers are active.
RSI ~35: Near oversold territory → increases the probability of a bounce.
Liquidity Sweep: Wick reversal below support indicates a stop-hunt before the reversal.
Structure: Downside momentum is slowing; base formation is visible.
DYOR | NFA.

SOLANA's situation+next targets and expected movements If this support is lost and the descending triangle pattern proves valid and the price follows it, solana will fall below $110 cents for a long time. But since the crypto market often breaks rules and patterns, maybe this time it will reverse again and, after breaking the triangle, push the price back above $157 cents.

SOL/USDT | Solana Is Testing Buyers Right Now, Pump or Dump?CRYPTOCAP:SOL rallied all the way to $146 before pulling back again and right now price is trading near $132. The correction is completely normal and the main demand zone sits between $122 to $132 which is exactly where Solana is reacting at the moment. This is the zone that needs to hold because losing it would open the door for a deeper drop.
If buyers fail to defend the current range there is still a clean lower demand area around $105 where I expect stronger accumulation and a possible start of the next bullish leg. For now I am watching to see if SOL stabilizes inside the $122 to $132 zone because a proper hold there usually leads to another upward push.
Please support me with your likes and comments to motivate me to share more analysis with you and share your opinion about the possible trend of this chart with me !
Best Regards , Arman Shaban

SOL - Taking the Baton from SUIAlright traders, quick update from the battlefield.
The SUI swing trade finished way faster than I expected —
which is nice… but also suspicious. 😅
And now?
SOL is stepping in with a very similar setup.
Same vibes, same structure, same “this probably shouldn’t go lower” feeling.
Today’s move looks like nothing more than a liquidity grab to me.
Grab the stops, scare everyone, shake the tree.
Tomorrow we’re getting better macro data,
and if that lines up, we could easily rotate back into the range.
Yes, I’m still counting on a little Santa rally 🎅
and yes, I want to be in the position early.
Am I okay risking a few % of my account for it?
Absolutely.
That’s the price of being early — and sometimes wrong. 😄
Let’s see how SOL decides to behave.
Good luck traders — and may Santa not skip crypto this year 🎅📈🚀

SOL Scalp Sell/Short Signal (1H)Given the formation of lower LHs and the bearish internal structure of Solana based on a bearish ICH, we can look for short sell positions below the previous highs.
At the first target, move to break-even and shift the stop loss to the entry.
Do not enter the position without capital management and stop setting
Comment if you have any questions
thank you
