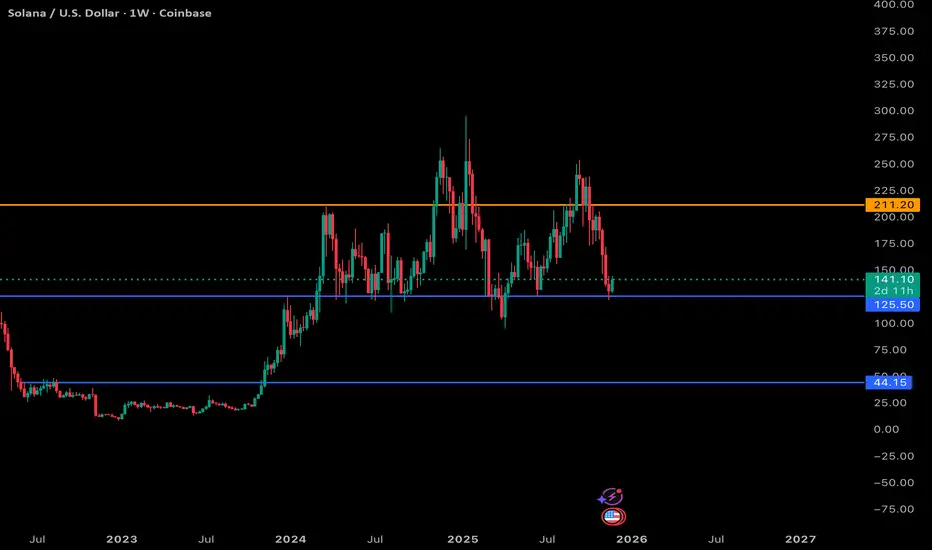
SOL UPDATE: My thoughts going into the Nov 28 2025 Weekend SOL is showing a solid reaction off the 125 support zone, which has been a major weekly level throughout this entire range.
As long as buyers defend this area, SOL can attempt a bounce back toward the mid-140s and potentially re-test the 170 region.
Still a choppy, range-bound structure overall, but this is the exact spot bulls needed to step in.
SOL
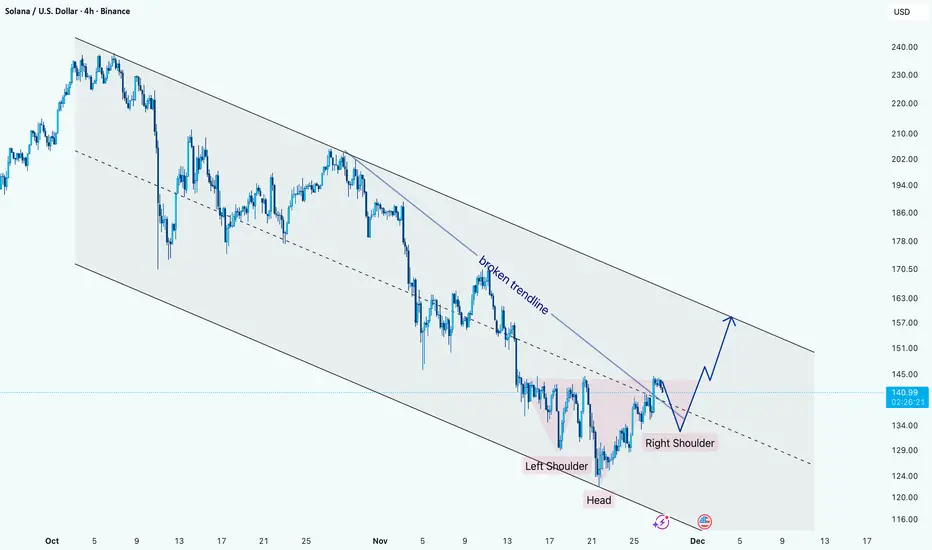
SOL Reversal Structure Forming Inside Downtrend ChannelHi!
Solana is trading inside a well-defined descending channel, but momentum is shifting. Price has broken the inner descending trendline and is now forming a clear inverse Head & Shoulders at the bottom of the structure.
The neckline zone has been tested multiple times, showing growing buyer strength. As long as price holds above the right-shoulder support, the structure favors a bullish continuation.
A breakout above the neckline opens the way toward the upper boundary of the main descending channel, with the next key reaction zone near $155–160. Failure to hold the right shoulder would delay the reversal and pull the price back toward mid-channel support.
$SOL - Overall SituationCRYPTOCAP:SOL - everyone sees this as H&S, but I'm Bullish on SOL.
Sol will start its race when nobody expects.
According to my last analysis, it has reached its first target; it could reach $126 too before the real move.

Sol continues to hold up strongCRYPTOCAP:SOL is holding up well with only a shallow retracement to the 0.382 for wave (4)- the weekly 200EMA.
Price is above the weekly 200EMA, which is bullish, but lost the pivot, which is bearish, giving the overall pattern ambiguity. Wave C is underway, but looks near completion at wave 4’s expected Fib targets.
🎯 Terminal target for the business cycle could see prices as high as $660 based on weekly pivots
📈 Weekly RSI is bearish with room to fall, but doesn’t often reach oversold.
👉 Analysis is invalidated if we close back below $50, as wave 4 can not go below the 0.5 Fib.
Safe trading

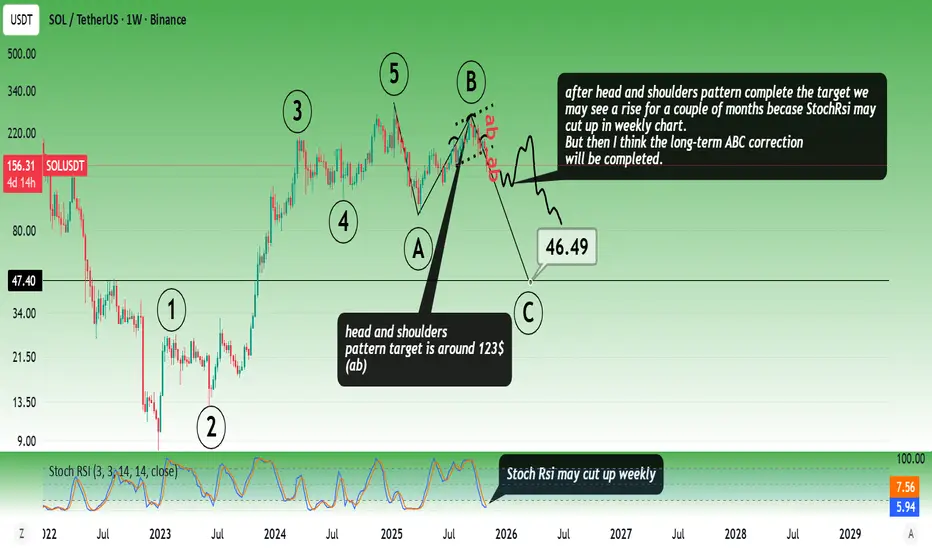
Solana RoadmapAfter the head and shoulders pattern complete the target we
may see a rise for a couple of months becase StochRsi may cut up in weekly chart.
But then I think the long-term ABC correction will be completed.
* The purpose of my graphic drawings is purely educational.
* What i write here is not an investment advice. Please do your own research before investing in any asset.
* Never take my personal opinions as investment advice, you may lose your money.
Solana hitting range lows. SOL price has pulled back into a major high-volume demand zone that supported every major rally in 2023–2024. The bearish divergence at the top played out cleanly, and now SOL is sitting on the first real test of this macro block.
Momentum indicators are resetting at historical reversal levels and showing early signs of a shift. As long as SOL holds the upper side of this demand zone, this remains an accumulation area, not a breakdown.
A bounce here sets up a mid-range reversal. A break below the liquidity shelf opens the door to the deeper demand block.
Watching for:
Higher low + momentum flip = bullish confirmation.

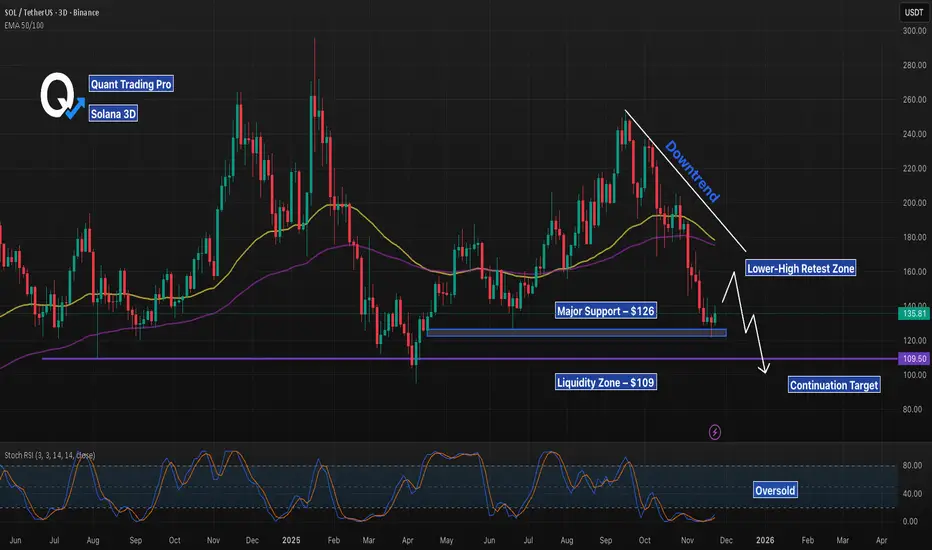
SOL 3D – Retesting Trendline, But Will Support Break Next?SOL remains in a clear daily downtrend, with price consistently setting lower highs beneath the descending trendline. Price is now pulling back into a potential lower-high retest zone, directly aligned with the confluence of the 50/100 EMAs overhead. Unless SOL can reclaim this trendline with a strong daily close, this setup favors continuation lower.
The first major area of interest is the $126 support, which has acted as a key reaction level across multiple months. A clean break of this level opens the door toward the lower $109 liquidity zone, which historically attracts deep wicks and stop-hunts before reversal attempts.
Stoch RSI remains in the oversold region, but without a confirmed bullish cross or momentum shift. Trend structure takes priority unless buyers reclaim the trendline and break the sequence of lower highs.
Watching for:
• Reaction at the trendline retest
• Daily close above or below $126
• Liquidity sweep toward $109 for potential reversal setups
SOL long-term TASolana is in heavy distribution, currently the weekly downtrend is engaged, it needs more time to bottom out, there's a good support at this area of $130ish and if it's broken we can see the lows of $100ish again.

SOL looks weak, lower in wave C?Price continues lower, a textbook ABC correction so far.
Wave B ended shy of all-time high. Price lost the daily 200EMA and is testing the major High Volume Node support. The probability is a continuation to the downside.
📈 Daily RSI reached oversold with no divergence
👉 Continued downside brings up the $112 target
Safe trading

SOLUSDT — Move Down? (NY Session Shenanigans Edition)Alright, here we go — one more short idea for today… and then I promise I’ll touch grass. 🌿
SOL hit us with some premium NY session manipulation right out of the gate — classic “let’s stop out everyone before choosing a direction” behaviour.
Now it looks like price wants to slide down, so I’m taking the setup and calling it my final boss trade of the day.
Will it work?
Maybe.
Will it ruin my mood?
Also maybe. 😅
Let’s see how it plays out — trade safe, stay disciplined, and protect your sanity.
GL legends! ⚡️📉🔥

BTC 1 week analysisbtc will take support from this area and 70% chance are the reversal going to happen from this area. we need to see how the BTC will react from this area.

Bitcoin Time-Channel CyclesYellow = 1064d expansion
Green = 658d mean node
Blue = 364d compression
This chart documents a repeating BTC time-channel structure built from prior cycle highs and lows. The goal here is not to force a price prediction, but to show that Bitcoin has been respecting a consistent rhythm in time and slope across multiple market regimes. When the previous major ATL is used as the anchor, the next macro expansion phase has repeatedly aligned with a ~1064-day duration. That expansion window is displayed as the larger corridor, and it has now shown up cleanly from the 2015 ATL into the 2017 ATH, from the 2018 ATL into the 2021 ATH, and again from the 2022 ATL into the 2025 ATH..
Inside each 1064-day expansion corridor, a secondary time node appears at roughly 658 days, which is the golden-ratio contraction of the full expansion cycle. What’s notable is that price has not been randomly positioned at this midpoint in time. Instead, it has repeatedly migrated back to the mean of the rising channel near the 658 day mark, acting like a structural equilibrium reset within the broader uptrend. This “mean hit” behavior is visible across cycles and is one of the main reasons to watch time geometry alongside price geometry. After the mean-hit, the market has historically rotated into the final leg of the expansion phase before completing the cycle high.
Following each macro high, the bearish compression phase has clustered around ~364 days, shown as the blue corridor. These reset windows are materially shorter than the expansion windows, which matches the observed tendency for bullish advances to build over years while bearish phases compress into faster, more volatile declines. The expansion to compression ratio is close to 3:1, reinforcing the idea that the market “inhales” slowly and “exhales” quickly in time. The important takeaway is that the model is not asking price to obey a specific number; it’s showing how price has behaved inside repeating time-based corridors, with the mean of the channel acting as a magnet around the 658 day node.
This framework is shared as a structural study, not a guarantee. Markets can mutate, and no historical symmetry is permanent. However, when a time-channel sequence repeats cleanly across multiple cycles, it becomes a useful way to frame expectation, especially for identifying where equilibrium touches and regime shifts are statistically more likely to occur. If this rhythm continues to hold, future cycle windows can be mapped the same way, with the emphasis placed on time-based decision zones and mean reactions rather than on any single price target.

SOL - Time for a pullback SOL - Time for a pullback
Before we take a new short we need a pullback and range
only after we can take a new short trade
Key resistance 171

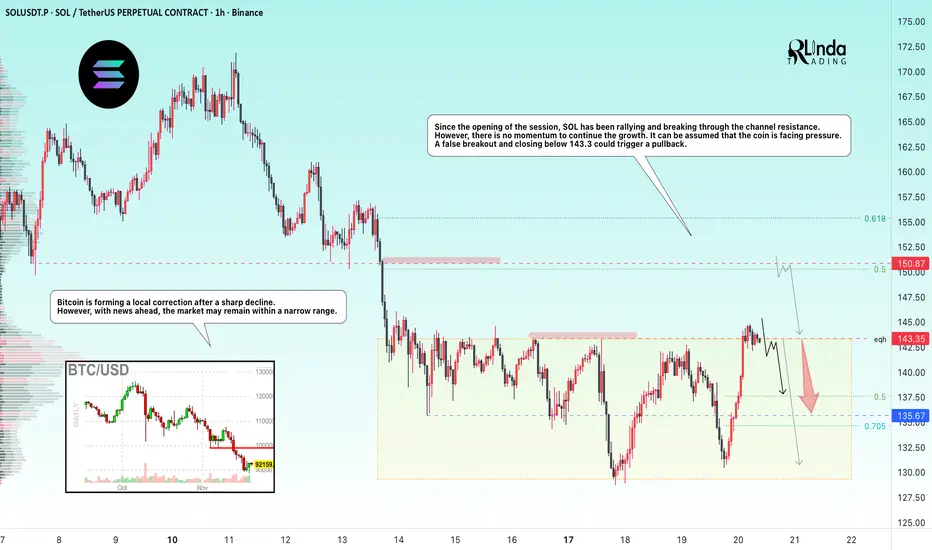
SOLANA → Manipulation - false breakout of resistance BINANCE:SOLUSDT.P flew up to resistance at 143.35 at the opening of the session and attempted to break through it, but bears may not let the price rise ahead of the news...
Bitcoin is forming a local correction after a sharp decline. However, news is ahead and the market may remain within a narrow range.
From the opening of the session, SOL rallies and breaks through the channel resistance, wasting 75% of its intraday growth potential. However, there is no momentum to continue the growth. It can be assumed that the coin is facing pressure. A false breakout and closing below 143.3 could trigger a pullback.
Resistance levels: 143.35, 150.87
Support levels: 135.67, 130.0
Two key levels for countertrend movement: 143.35 - 150.87. If the liquidity pool does not stop the price at the nearest level, then 150.87 can be considered as an additional level for trading a false breakout.
However, news on unemployment is coming soon, and the market may react quite aggressively. Therefore, if there are no trading opportunities before the news, I recommend refraining from action for an hour and waiting out the storm...
Best regards, R. Linda!
Market Outlook: Bitcoin Path to $150KThe broader structure on Bitcoin still points toward a long-term expansion into and possibly above the $150K region, but the chart is showing as always that we won’t get there in a straight line.
Just like when I previously predicted Bitcoin’s move to $108K (See my 2021 Bold but slightly off in timing call here: ), the current setup is following the same pattern of exhaustion → correction → expansion. The signs are repeating and becoming clear again: momentum is slowing, resistance is rejecting harder and faster than ever, and volume is now tapering off. When this happens, the market usually needs a deeper reset before the next major leg to the upside.
A pullback into the $70K–$75K zone looks not only possible but healthy, not just for Bitoin but the entrie crypto market. If i was a first time investor and this played out this level would be where I steadily start to invest slowly week by week across the major favorites like Ethereem, XRP, Litecoin, Solana, Cardano, Chainlink, etc
This pullback area below 75k aligns with:
• A major liquidity pocket that has not been tapped
• The previous breakout zone needing a retest
• An ideal discount region for larger institutions to reload
• A level that would wipe out overleveraged longs and rebalance the crypto market
The drop have been and will feel even more painful to longer term investors, especially for new buyers or late comers wo came in above these numbers, but this kind of correction is exactly what fuels the next macro wave or what we like to call the next BULL RUN.
Once BTC finds support in the $70K–$75K range and reclaims that zone, the next bullish impulse opens up and that’s where we get the continuation toward the $150K macro target. The structure, liquidity map, and long-term momentum all support this trajectory.
In short:
Short-term: a deep corrective pullback.
Mid-term: stabilization and accumulation.
Long-term: the trajectory remains intact for a push toward $150K in the coming few months to couple years, just like that 2021 $100K call.
Stay Ready!

SOLANA, November 15 Two Possible Correction Scenarios — One Outcome
In my view, Solana is currently forming a corrective structure.
At this moment, there are two scenarios:
🟧 Orange Scenario
The ABC corrective pattern has likely just completed, and Solana may follow the orange arrow toward 126 and potentially even lower.
🟪 Purple Scenario
The current flat ABC structure may actually represent wave A of a larger ABC correction — similar to what happened in Bitcoin right before its recent drop (see my recent BTC post where I expected 94K).
If this scenario plays out, Solana could first rise toward 144–146, and only then move down to 126.
I previously mentioned that I was waiting for Solana at 136 — and we’ve already seen that level.
I also expect 124, and possibly even lower.
But for now, I keep my short-term target at 126.
My global target is 112, but first, let’s see how exactly Solana approaches 126 — this will help confirm whether it truly intends to move below that level.
Let’s see which path Solana prefers — personally, I’m leaning toward the orange one.
⚠️Disclaimer: This is not financial advice or a call to action — only my personal vision.
🚀If you don’t want to miss updates, feel free to follow, leave reactions, or drop a comment.
Your support truly motivates me to continue posting regular Solana updates.

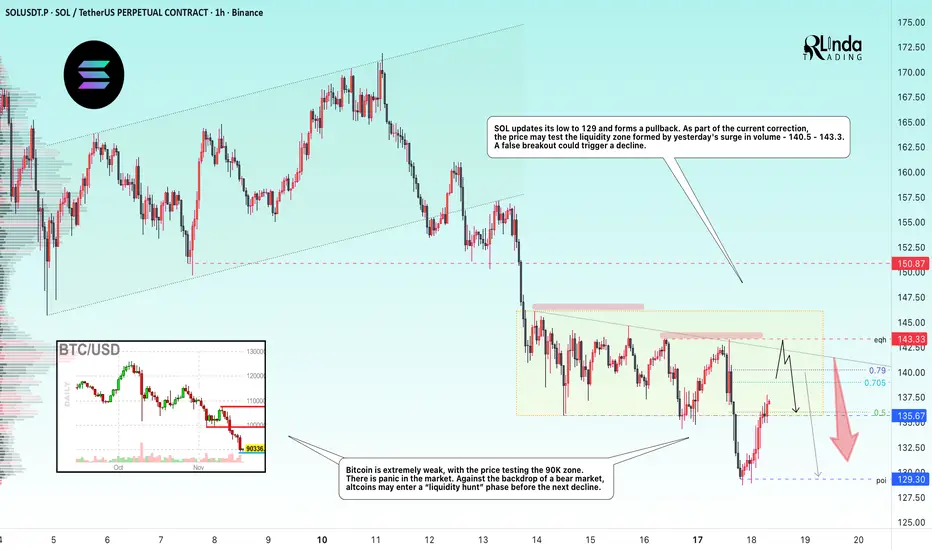
SOLANA → Hunting for liquidity in a weak market BINANCE:SOLUSDT is forming a countertrend correction. Zone of interest: 140.0–143.5. The lack of bullish potential and positive fundamentals could cause another decline...
Bitcoin is extremely weak, with the price testing the 90K zone. There is panic in the market. Against the backdrop of a bear market, altcoins may enter a phase of “liquidity hunting” before another decline.
Solana's price on D1 broke through fairly strong support at 141.3-138.5. The trend is bearish, and the breakout of support confirms the weakness of buyers (strength of sellers) at the moment.
SOL is updating its low to 129 and forming a pullback. As part of the current correction, the price may test the liquidity zone formed by yesterday's surge in volume - 140.5 - 143.3
Resistance levels: 139.0, 140.2, 143.3
Support levels: 135.67, 129.3
Consolidation is forming above the support range - 135.67. Most likely, bulls may flood the volume and provoke another rise to the liquidity zone, but there may not be enough potential for continued growth. A false breakout and lack of bullish momentum could trigger a decline to 135.5 - 129.3.
Best regards, R. Linda!
$SOL reboundCRYPTOCAP:SOL looking bullish after a bullish bounce on a strong key support level. I see a continuation up to $152

Solana is still far from a bearish phase (3D)From the point where we placed the red arrow on the chart, a corrective phase has developed on Solana, and the buying pressure has been so strong that the corrections have established a new high. Currently, the decline we are experiencing is for Wave E.
All these fluctuations between the high and low are for re-accumulation, and Solana is targeting above $350.
We expect a price reversal from the green zone on higher timeframes, and this view will only be invalidated if a weekly candle closes below the invalidation level.
For risk management, please don't forget stop loss and capital management
When we reach the first target, save some profit and then change the stop to entry
Comment if you have any questions
Thank You

$SOL - Scalp Long IdeaBINANCE:SOLUSDT | 2D
The analysis we posted on October 31st played out perfectly, with nearly a 38% drop. Solana failed to regain the $200 zone, which led to a clean breakdown toward the $130 level.
Despite the dump, some alts are still holding up well. And if Bitcoin can hold the 90–88k zone, this could be a good area to take a shot.
Entry: $132-$124
Stop: just below $110
Targets:
tp1 - $142-154
tp2 - $157-162
tp3 - $168-174

SOL — Deep Pullback Into Major SupportSOL has been in a steady freefall over the past weeks. On the higher timeframes the key support and resistance zones are very clearly defined. The $250 level acted as a big resistance area, with multiple rejections showing sellers were firmly in control up there.
On the downside, the $125 support zone has shown clear strength, with bulls defending this area and producing strong bounces each time price revisited it.
The swing low at $126 presents an attractive long opportunity, especially with the sell-side liquidity and the quarterly level at $124.54 sitting just below, adding further confluence. Additionally, the anchored VWAP from the $8 low lies around $114, aligning almost perfectly with the 0.886 Fibonacci retracement at $113.3, providing deeper support should price extend lower.
Long Entry Zones:
0.786 Fib: $129.13
0.886 Fib: $113.3
Why the 0.786–0.886 Zone Is a Major Reversal Area
The 0.786–0.886 Fib zone is one of the best spots to look for a reversal after a deep pullback. It’s where strong trends often take their final dip before bouncing.
Here’s why it works so well:
It’s the typical “deep correction” zone in strong trends.
Price usually sweeps sell-side liquidity here before reversing.
Many harmonic patterns use this exact area as their turning point.
It often lines up with anchored VWAPs or volume nodes, adding extra support.
It’s basically the capitulation zone where weak hands exit right before a bounce.
Overall, it’s a clean area with clear invalidation and great R:R → perfect for spotting high-probability reversal setups.
_________________________________
💬 If you found this helpful, drop a like and comment!

SOL – Watching for a Higher-Timeframe Reversal SetupSolana has been pulling back after its recent rally, and we’re looking for price to retest the next major support zone. A successful hold here could set the stage for a higher-low formation and a continuation of the broader uptrend — offering a solid long spot opportunity.
Trade Setup:
• Entry Zone: $120 – $126
• Take Profit Targets:
🥇 $148
🥈 $174
• Stop Loss: $110
$SOL is still in a heavy downtrend toward the lower targetsCRYPTOCAP:SOL is still in a heavy downtrend toward the lower targets that I mentioned in my previous analysis.
126 and 95 are the next targets.
