SOLUSDT: Liquidity Tightens – Every Pullback Drops Even Deeper!When talking about Solana right now, the clearest feeling is that the market is losing strength day by day . Recent news shows that SOL has dropped sharply in November, and large capital keeps exiting the market — turning every bounce into an excuse for holders to sell rather than a sign of reversal.
On the H4 chart, SOL is trapped inside a descending wedge , repeatedly rejected by the Ichimoku cloud — an area that has consistently blocked every recovery attempt. Each previous bounce has only led to an even stronger downward leg.
The $130 level is the nearest immediate resistance and also aligns with the descending trendline. If price pulls back to this zone, there is a high probability of fresh selling pressure emerging. When that happens, SOL could continue dropping toward the psychological support at $100 — the key target in the current bearish outlook.
In summary, with both negative news and a weak technical structure, the most reasonable strategy now is to follow the downtrend , wait for price to pull back into resistance to find cleaner entries, and avoid catching bottoms when the market shows no clear reversal signals.
Solana

Solana (CRYPTO: $SOL) ETFs Surge as Price Tests Major SupportSolana (CRYPTO: CRYPTOCAP:SOL ) trades at $127.45 after a sharp 31% decline over the past month, but institutional activity is telling a different story. While retail sentiment weakens, capital continues flowing into newly launched Solana ETFs—creating one of the clearest divergences in the crypto market heading into late 2025.
Six U.S. spot Solana ETFs are now live, with issuers including 21Shares, Fidelity, VanEck, Canary Capital, Bitwise, and Grayscale. Fidelity’s FSOL on NYSE Arca quickly captured attention thanks to its staking component, making it the largest traditional asset manager offering staked SOL exposure. 21Shares also added competitive pressure by launching its ETF with a 0.21% fee after securing Cboe approval.
Combined ETF holdings now exceed $2 billion, and the inflows haven’t slowed—Solana ETFs recorded $26.2 million in net inflows on November 18, marking the 15th consecutive positive day. Remarkably, these inflows outpaced those of Bitcoin and Ethereum for the week. When institutions accumulate during market selloffs, it often reflects long-term conviction in underlying fundamentals such as Solana’s high throughput, low transaction costs, and increasingly mature ecosystem.
Technicals
Despite the correction, SOL is testing a major ascending-trendline support that has been respected several times. Price recently dipped into liquidity near $127, a level that has previously marked swing turns.
If support holds, the bullish continuation scenario comes into focus. The first target stands at $253, followed by $295. A breakout above both levels would strongly support new all-time highs heading into 2026.
If support fails decisively, the next demand zone lies between $110 and $100. A breakdown of that zone increases the probability of a deeper move toward $80. For now, buyers continue defending trend support, keeping the broader structure intact.

Solana: Room for moreSOL recently dipped further into the now green Target Zone between $155.80 and $113.20. Within this area, we expect the low of wave ii in orange to be established imminently. Afterward, we anticipate a strong wave iii rally, which should peak above resistance at $295.31.

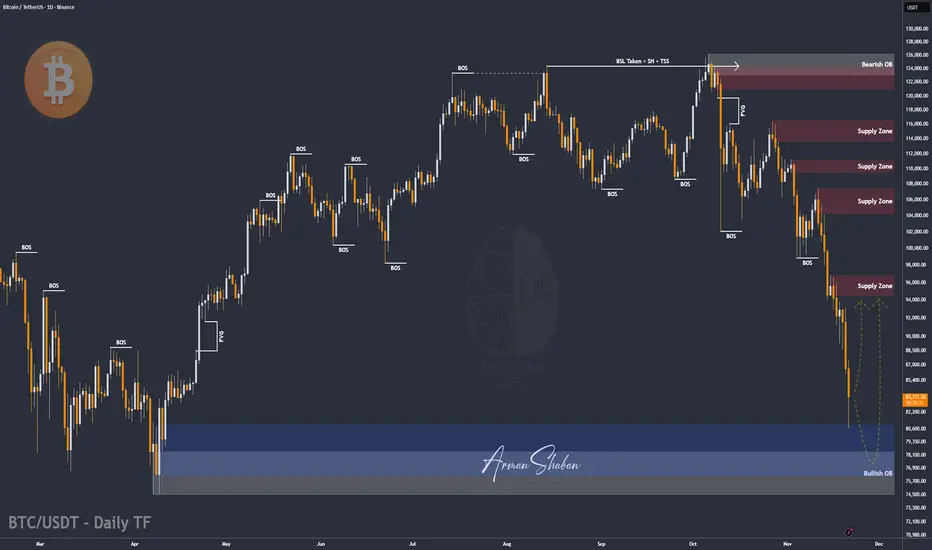
BTC/USDT | Bitcoin Hit Major Demand, What’s Next?By analyzing the #Bitcoin chart on the daily timeframe, we can see that the price dropped exactly as expected and fell sharply to $80,500. Once it reached this major demand zone, buyers stepped in and Bitcoin bounced back to around $83,900.
As long as BTC can hold above the large demand zone between $74,000 and $81,000, we can expect the next bullish wave to start.
From my perspective, the trend is not bearish! this is still a healthy correction.
From the ATH at $126,200, Bitcoin has corrected 36%, which is completely normal in strong uptrends. Now it’s time to watch for decreasing selling pressure and the beginning of a stronger upside move. This analysis will be updated soon.
Please support me with your likes and comments to motivate me to share more analysis with you and share your opinion about the possible trend of this chart with me !
Best Regards , Arman Shaban
SOL - Time for a pullback SOL - Time for a pullback
Before we take a new short we need a pullback and range
only after we can take a new short trade
Key resistance 171

SOLUSD; Heikin Ashi Trade Idea📈 Hey Traders!
Here’s a fresh outlook from my trading desk. If you’ve been following me for a while, you already know my approach:
🧩 I trade Supply & Demand zones using Heikin Ashi chart on the 4H timeframe.
🧠 I keep it mechanical and clean — no messy charts, no guessing games.
❌ No trendlines, no fixed sessions, no patterns, no indicator overload.
❌ No overanalyzing market structure or imbalances.
❌ No scalping, and no need to be glued to the screen.
✅ I trade exclusively with limit orders, so it’s more of a set-and-forget style.
✅ This means more freedom, less screen time, and a focus on quality setups.
✅ Just a simplified, structured plan and a calm mindset.
💬 Let’s Talk:
💡Do you trade supply & demand too ?
💡What’s your go-to timeframe ?
💡Ever tried Heikin Ashi ?
📩 Got questions about my strategy or setup? Drop them below — ask me anything, I’m here to share.
Let’s grow together and keep it simple. 👊

Solana Explosion: Will SOL Hit $183 or Crash Below $100?If SOL breaks above 144.77, next stops are 153.65 and possibly 183 on strong momentum.
But dropping below 130 could trigger a sharp slide toward the $100 zone—watch these levels!

SOLANA, November 15 Two Possible Correction Scenarios — One Outcome
In my view, Solana is currently forming a corrective structure.
At this moment, there are two scenarios:
🟧 Orange Scenario
The ABC corrective pattern has likely just completed, and Solana may follow the orange arrow toward 126 and potentially even lower.
🟪 Purple Scenario
The current flat ABC structure may actually represent wave A of a larger ABC correction — similar to what happened in Bitcoin right before its recent drop (see my recent BTC post where I expected 94K).
If this scenario plays out, Solana could first rise toward 144–146, and only then move down to 126.
I previously mentioned that I was waiting for Solana at 136 — and we’ve already seen that level.
I also expect 124, and possibly even lower.
But for now, I keep my short-term target at 126.
My global target is 112, but first, let’s see how exactly Solana approaches 126 — this will help confirm whether it truly intends to move below that level.
Let’s see which path Solana prefers — personally, I’m leaning toward the orange one.
⚠️Disclaimer: This is not financial advice or a call to action — only my personal vision.
🚀If you don’t want to miss updates, feel free to follow, leave reactions, or drop a comment.
Your support truly motivates me to continue posting regular Solana updates.

ACT/USDT — End of the Downtrend or the Start of a New Rally?ACT is sitting at one of its most critical moments in months. After being trapped in a brutal multi-month downtrend, price is finally pushing into the main descending trendline, a level that has rejected every bullish attempt since late 2024.
If this wall breaks, the entire market structure for ACT could shift.
---
✨ What’s Really Happening on the Chart?
1. The Multi-Month Downtrend Is Losing Strength
The descending yellow trendline has been the dominant resistance for nearly a year. Now, however:
Candles are getting smaller
Volatility is compressing
Selling pressure is fading
Price is moving sideways near resistance
This is classic behavior of a late-stage downtrend, right before one of two outcomes:
A major breakout — or
A final capitulation drop.
---
✨ Pattern in Play: A Compression Falling Wedge
The current structure resembles a falling wedge compression, one of the strongest classical reversal setups because:
Historically bullish
Breakouts often move fast
Targets align perfectly with existing supply zones
Key upside targets are already visible:
0.03420
0.05198
0.08290
These levels are the logical destinations if a breakout confirms.
---
📈 BULLISH SCENARIO — (High-Probability Reversal Setup)
A bullish reversal becomes meaningful only if:
✔ Price closes above the descending trendline on the 2D timeframe
This signals the first real shift in control.
✔ Successful retest → price bounces from the breakout zone
This is usually the safest entry.
✔ Volume expands during breakout
No volume = high risk of a fakeout.
If these conditions align, ACT could rally toward:
🎯 0.03420
🎯 0.05198
🎯 0.08290
These are the structural targets derived from the wedge breakout.
---
📉 BEARISH SCENARIO — (If the Trendline Rejects Again)
If price once again fails to break the trendline:
Downtrend remains intact
Lower prices become likely
Momentum stays bearish
Critical support zones:
⚠ 0.015 → 0.010
Losing this range opens the door toward:
⚠ Historical Low: 0.00601
This is the ultimate downside if capitulation returns.
---
💡 Core Takeaway
ACT is sitting exactly at its decision point:
Breakout = a new trend and strong upside momentum.
Rejection = continuation of the long-term downtrend.
The descending yellow trendline is the key to everything.
---
#ACTUSDT #ACT #CryptoBreakout #TrendReversal #AltcoinWatch #PriceAction #CryptoAnalysis #ChartPattern #FallingWedge

78K or 55K?Alright, big downward movement. Looks like it will test around 78k price. If it looses 75-80k then most likely it will drop to 54k. All the best !!

$1000 may be in 1-2 years?I think it's close to the bottom. It must stay above 240, otherwise all bets are off. If it turns around 240 and starts moving higher, this can turn bullish along with crypto. My target is in the range 750-1000. I am a buyer at these prices and lower.
Not a financial advice. I may change my mind anytime given the price and market conditions.

SOL is Oversold (-1.3 Z-Score). Time to Buy? (Quant Analysis)Solana has been in a relentless downtrend, but my Quant Master system is finally flashing signs of seller exhaustion.
What the Algo sees:
The Trend is still Bearish: The candles are Red. Price is below the Supertrend and below the institutional VWAP anchor. The trend is down, do not fight the current.
The "TP" Signal (Bottom Right): Notice the small Purple Triangle that just printed at the lows ($130 region).
This signals that Price has deviated significantly from the mean.
Historically (look at the chart left), these TP signals mark local bottoms where shorts should cover.
The Data:
Z-Score: -1.3 (Approaching the -2.0 "Bounce Zone").
Market Weather: Trending (Green Label) but deep in bearish territory.
My Game Plan:
The "TP" tells me to stop shorting, but the "Red Candles" tell me it is too early to buy. I am waiting for the Z-Score to hit -2.0 OR for a confirmed Blue Candle close above $142 to confirm the reversal.
Until then, patience pays.

SOL/USDT – Downside LoadingSOL/USDT – Downside Loading
The chart shows a prolonged distribution phase followed by a steady macro decline, with multiple structure breaks confirming a persistent bearish flow. After the earlier consolidation in the upper range, each attempt to reclaim previous highs has been met with a shift in momentum, leading to progressive downside sequences.
The recent breakout from the lower range transitioned into continued weakness, indicating sellers remain in firm control. Despite short-term rebounds, the overall behaviour reflects a market that is unwinding previous demand zones rather than building new ones.
At the current level, SOL is forming a tight corrective pattern, suggesting price is building liquidity before the next directional move. Given the broader trend context, this type of compression typically precedes continuation rather than full reversal. The chart’s projection implies a potential liquidity sweep on the minor rally, followed by renewed downside pressure once short-term buyers are exhausted.
Overall, the environment still favours the bearish continuation scenario unless the market shows a decisive shift in character backed by sustained strength — something not yet present.

Solana is still far from a bearish phase (3D)From the point where we placed the red arrow on the chart, a corrective phase has developed on Solana, and the buying pressure has been so strong that the corrections have established a new high. Currently, the decline we are experiencing is for Wave E.
All these fluctuations between the high and low are for re-accumulation, and Solana is targeting above $350.
We expect a price reversal from the green zone on higher timeframes, and this view will only be invalidated if a weekly candle closes below the invalidation level.
For risk management, please don't forget stop loss and capital management
When we reach the first target, save some profit and then change the stop to entry
Comment if you have any questions
Thank You

BTC/USDT | Bitcoin Drops Hard – Key Demand Zones Now in Play!By analyzing the #Bitcoin chart on the daily timeframe, we can see that BTC failed to hold above $104,700, and as expected, this led to a heavy sell-off. First, the price dropped to $94,000, and then a second strong wave pushed it down to $89,000. Bitcoin is now trading around $91,000.
Key supply zones and demand zones are marked on the chart. Important demand levels sit at $88,000, $84,000, and the larger zone at $74,000–$78,000. Watch how the price reacts to these areas.
If Bitcoin wants to recover, it must first hold above these key zones. But if BTC breaks below $74,000, it could open the door for a deeper drop toward $50,000. For now, focus on price reactions at the marked demand levels.
Please support me with your likes and comments to motivate me to share more analysis with you and share your opinion about the possible trend of this chart with me !
Best Regards , Arman Shaban

SOLUSDT: Sellers in Control – Downtrend Remains DominantSolana is falling right at the moment when the altcoin market is under the most pressure. This week, a series of negative developments have weighed heavily on sentiment: strong ETF outflows, risk-off behavior, and fading expectations of a Fed rate cut in December. All of this makes it difficult for SOL to form any sustainable recovery.
On the 4H chart, SOL is sliding within a clear descending channel and has repeatedly been rejected at the upper trendline. The 150 USD level is now acting as a short-term resistance — every touch is pushed back immediately, showing how weak the buying pressure is.
If SOL continues to fail to break above 150 USD, the most likely scenario is a move back down to the 140 USD (TP1) zone. And if market sentiment remains bearish, a deeper target lies around 130 USD (TP2) — where the channel bottom aligns with a previous demand zone.
With negative news flow, weakening liquidity, and a technical structure fully favoring the downside, the short-term trend of SOLUSDT remains in the hands of the sellers. Any bounce here is more likely to become an opportunity for short positions rather than a true reversal signal.

SOL — Deep Pullback Into Major SupportSOL has been in a steady freefall over the past weeks. On the higher timeframes the key support and resistance zones are very clearly defined. The $250 level acted as a big resistance area, with multiple rejections showing sellers were firmly in control up there.
On the downside, the $125 support zone has shown clear strength, with bulls defending this area and producing strong bounces each time price revisited it.
The swing low at $126 presents an attractive long opportunity, especially with the sell-side liquidity and the quarterly level at $124.54 sitting just below, adding further confluence. Additionally, the anchored VWAP from the $8 low lies around $114, aligning almost perfectly with the 0.886 Fibonacci retracement at $113.3, providing deeper support should price extend lower.
Long Entry Zones:
0.786 Fib: $129.13
0.886 Fib: $113.3
Why the 0.786–0.886 Zone Is a Major Reversal Area
The 0.786–0.886 Fib zone is one of the best spots to look for a reversal after a deep pullback. It’s where strong trends often take their final dip before bouncing.
Here’s why it works so well:
It’s the typical “deep correction” zone in strong trends.
Price usually sweeps sell-side liquidity here before reversing.
Many harmonic patterns use this exact area as their turning point.
It often lines up with anchored VWAPs or volume nodes, adding extra support.
It’s basically the capitulation zone where weak hands exit right before a bounce.
Overall, it’s a clean area with clear invalidation and great R:R → perfect for spotting high-probability reversal setups.
_________________________________
💬 If you found this helpful, drop a like and comment!

SOL/USDT | Solana Finds Support – Short-Term Bounce Ahead?By analyzing the #Solana chart on the daily timeframe, we can see that after correcting down to $134, the price found demand and bounced to $141.
Since the current area is a key demand zone, if Solana holds above the $126–$137 range, we can expect a short-term bullish wave to follow

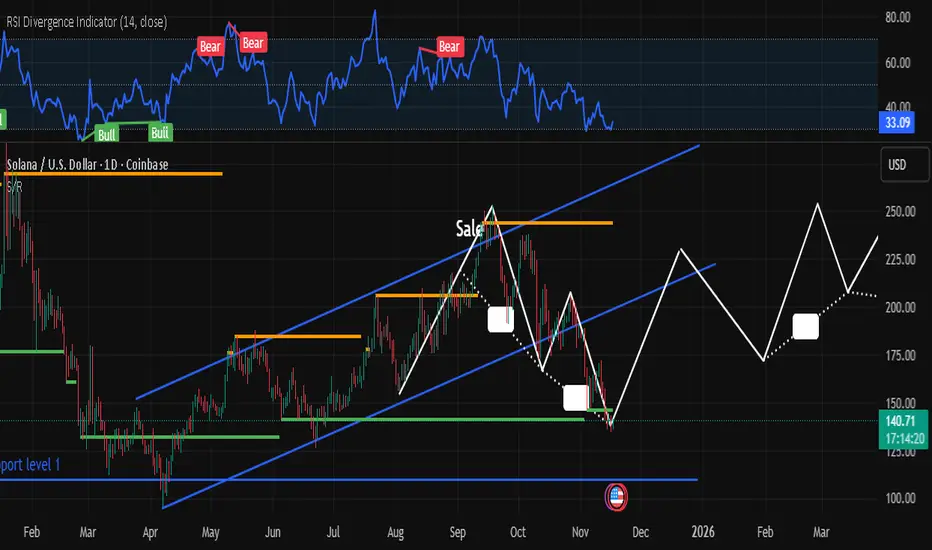
Solana – Daily Chart AnalysisSolana is currently holding around $140 after a sharp correction from the upper channel resistance. Price is testing a key ascending trendline and horizontal support zone near $135.
📉 RSI at 32.76 signals oversold conditions, watch for potential bullish reversal setups.
🔮 Possible Path Ahead (White Projection):
• Bounce to $180 → Consolidation
• Breakout toward $240
• Target zone: $280–$300 by mid-2026
(based on channel re-entry and momentum recovery)
❗If support fails, next major demand zone sits around $100–$110.
📊 Watching closely for confirmation of trend reversal.
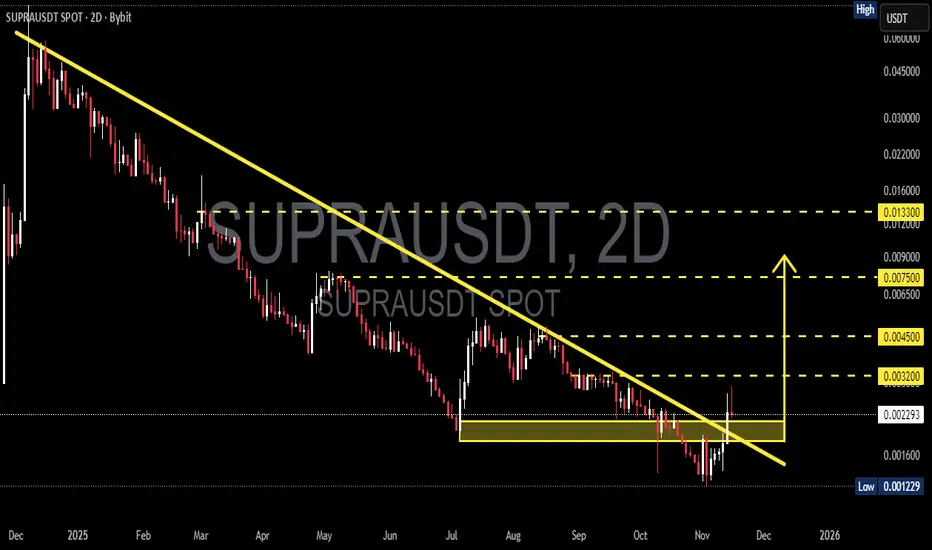
SUPRA/USDT — Trendline Breakout at Critical: Is Major Reversal?SUPRA has spent nearly a full year trapped under a relentless descending trendline—each rally attempt crushed, each bounce rejected. But for the first time since early 2025, the 2-day candle has broken above the dominant descending trendline, signaling a potential structural shift in market momentum.
This breakout occurred precisely after SUPRA revisited the major demand block at 0.00215–0.00180, a region that has repeatedly acted as the survival zone for this asset. The reaction from this area suggests renewed accumulation and a clear transfer of strength from sellers back to buyers.
SUPRA is now entering the most critical stage of its 2025 chart structure:
Is this a genuine trend reversal—or just another liquidity trap disguised as a breakout?
---
PATTERN STRUCTURE: “Descending Trendline Break + Demand Zone Rejection”
This combination is historically one of the strongest reversal structures, especially after prolonged downtrends.
1. Descending Trendline Breakout
The yellow trendline has suppressed price since early 2025.
The 2D breakout is a strong early reversal signal.
However, the wick on the breakout candle shows that sellers aren’t fully gone—momentum still needs confirmation.
2. Strong Demand Block (0.00215–0.00180)
This yellow box represents
high-volume reaccumulation,
liquidity sweeps,
structural support
that has repeatedly reset the market’s short-term direction.
3. Mid-Term Market Structure Shift (MSS)
A breakout + higher low formation near demand suggests the foundation of a larger bullish transition.
---
Bullish Scenario: “The Ingredients of a Full Trend Reversal”
SUPRA may be forming the early stages of a multi-week bullish reversal if the following conditions are respected:
1. Holding Above 0.00215
This is the line between “breakout confirmed” and “breakout failed.”
2. Successful Retest of Trendline or Demand Zone
A clean rejection wick from this zone would signal buyers stepping in aggressively.
3. Bullish Targets Based on Chart Structure
If the breakout is real, SUPRA has a clear ladder of upside targets:
Target Description
0.00320 First resistance / short-term reaction zone
0.00450 Major historical supply area
0.00750 Mid-range structural resistance
0.01330 Full trend reversal target
Bullish Narrative
A stable 2D close above 0.00230–0.00250 would mark the beginning of a mid-term trend reversal, opening the path toward multi-target rallies.
---
Bearish Scenario: “False Breakout Liquidity Trap”
Despite the breakout, danger remains:
1. Closing Below 0.00215
This would signal weakness and invalidate early bullish momentum.
2. Closing Below 0.00180 (Major Breakdown)
If the candle closes below the lower demand boundary, SUPRA risks sliding toward:
0.00123 (the next major low on the chart)
or even forming new lower lows
Bearish Narrative
If sellers reclaim the demand zone, the reversal collapses and the long-term downtrend resumes.
---
Summary
SUPRA is at one of its most defining technical moments of 2025.
The trendline breakout is only the first chapter of this story—the real decision will be made at the 0.00215–0.00200 retest.
If the zone holds, SUPRA isn’t just escaping a downtrend—it may be entering a full multi-week reversal phase aimed at 0.00320 → 0.00450 → 0.00750 and beyond.
But if it closes below 0.00180, the entire bullish structure erases and the downtrend resumes.
---
#SUPRA #SUPRAUSDT #CryptoAnalysis #Breakout #TrendlineBreak #Altcoin #MarketStructure #DemandZone #ReversalSetup
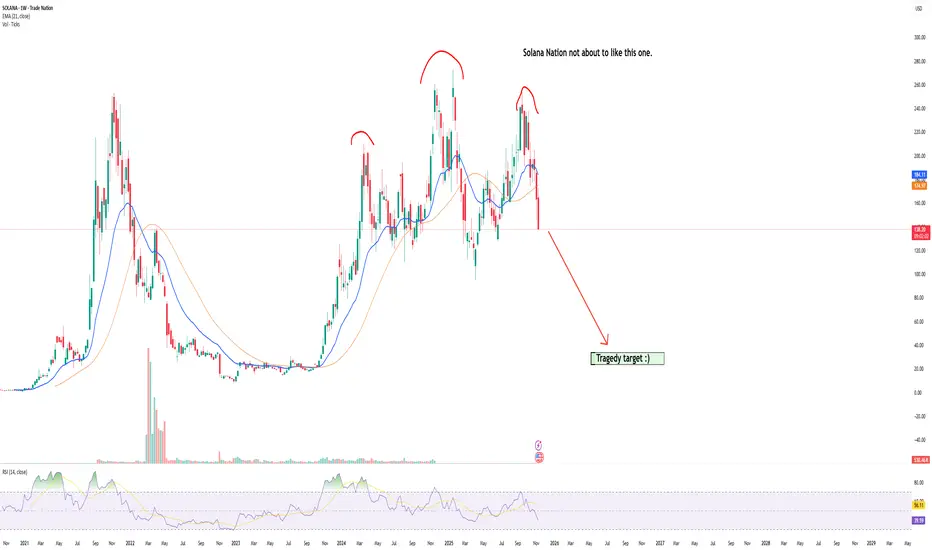
Solana tragedy incomingEvery downfall creates buy oportunities. :) Every tragedy is soil for another flower...
SOLANA Sell/Short Setup (2H)A bearish pattern has formed on the chart, and it appears that the first wave of wave E has been completed, which was symmetrical. In the second wave of E, we are looking to enter a Sell/Short position to capture the third bearish wave of wave E.
The stop loss, targets, and entry point have been marked on the chart.
Please note that this is a swing setup and will take some time to reach the target.
Add this setup to your watchlist | we’ll enter if it reaches the entry zone.
For risk management, please don't forget stop loss and capital management
When we reach the first target, save some profit and then change the stop to entry
Comment if you have any questions
Thank You

#SOLANA Bear Market Hello everyone, I hope you're all doing well.
This is my prediction for the price of Solana in the coming weeks and months. I previously shared this idea when the price was $16, and I predicted it would rise to the top. Take a look below
This is not investment advice; please take full responsibility for your buying and selling decisions.
Warning: Be careful not to use this idea with leverage, as you could lose all your money
