BTC/USDT | The real test ahead! (READ THE CAPTION)Hello everyone, back with another analysis, this time on BTC.
By examining the daily chart of BTC, we can see that bitcoin has been boosted up after hitting the demand zone and is currently being traded in 93K zone. I expect a rise to 97k-98k FVG zone, if BTC manages to go past through this zone, a rise to 104K could be possible. Should it fail to go past 98K, another drop to 81K is likely to happen.
Solana

SOL reversal⚡ SOL/USDT – 1H Reversal Heating Up
BYBIT:SOLUSDT.P holding strong above $136–$138 support — EMA ribbon flipped green and momentum’s curling up.
If bulls defend this level, next leg targets $150 → $160+.
Break below $132 invalidates short-term setup.
“Golden pocket bounce. Calm before the breakout.” ⚙️

SOL 1W – FVG Cleared/Fib Reset Tagged, Is the Reversal Starting?SOL has reached a major confluence area on the weekly chart, tagging the broader Fib Reset Zone and reacting directly from long-term Trendline Support. This is the same structural level that launched previous multi-month rallies, making this an important point for potential reversal.
Price is also sitting just above the 0.618 retracement — historically one of SOL's strongest reaction levels — while the weekly Stoch RSI is emerging from oversold conditions, a signal often seen near macro turning points.
The declining 50/100 EMAs still create overhead pressure, but reclaiming these EMAs would confirm a shift in weekly trend structure and open the door for a broader recovery leg.
If the trendline fails, the lower demand zone becomes the next logical retest. But as long as SOL continues to defend this diagonal and build higher closes inside the Fib Reset Zone, the case for reversing the multi-month downtrend strengthens.
This is one of the most important weekly levels SOL has approached all year.

SOLUSD: Breakout from Bottom Structure Inside Downtrend ChannelHi!
SOL has been trading inside a descending channel, consistently respecting both upper and lower boundaries. Recently, price formed a clear Inverse Head & Shoulders at the bottom of the channel, signaling potential bullish reversal momentum. The neckline breakout aligns with the break of the minor descending trendline, strengthening the shift in structure.
If price holds above the neckline, the pattern projects a move toward the 160–165 USD zone, which also aligns with the channel’s upper boundary, a strong confluence area and natural target for bulls.
However, failure to sustain above the neckline could lead to a pullback toward the right-shoulder region, though the setup remains valid as long as price stays above the head level.
Overall, SOL is showing a bullish reversal signal, with upside continuation favored while above the breakout zone.

SOL for $79?Greetings to all 😊
Many people in their personal messages asked about the possible further movement of the SOL coin, after it reached the previously designated goals (see the last review)
💡 I can say one thing: while the asset is trading under the important level of $189.31 , it is not worth considering purchases for a long time, since the context is short
◾️ The global picture looks like this: we have a 12M chart that shows the reaction from the zone of interest and the price moving below the support level
◾️ I would like to note that we also have the min of last year, which has accumulated liquidity - 79$
⚡️ All timeframes are in a descending structure
▫️ If the price does not recover its values > 180$ this month, then I will expect a decrease to low (79$)
▫️ on the chart of the month , the price is trading sideways
▫️ We have removed the nearest liquidity on the weekly chart and are showing a corrective movement
▫️ On the daily timeframe, the price came to trend support and is trading sideways
Here we are interested in two zones between which the price is squeezed:
resistance of $ 145 - $ 151
and support of $133.74 - $ 137.76
📌 While the price is in uncertainty between sellers and buyers, it is better to wait for the manifestation of one side and then make a decision.
📍 And remember: not every deal is your deal.
Good luck to all ☘️

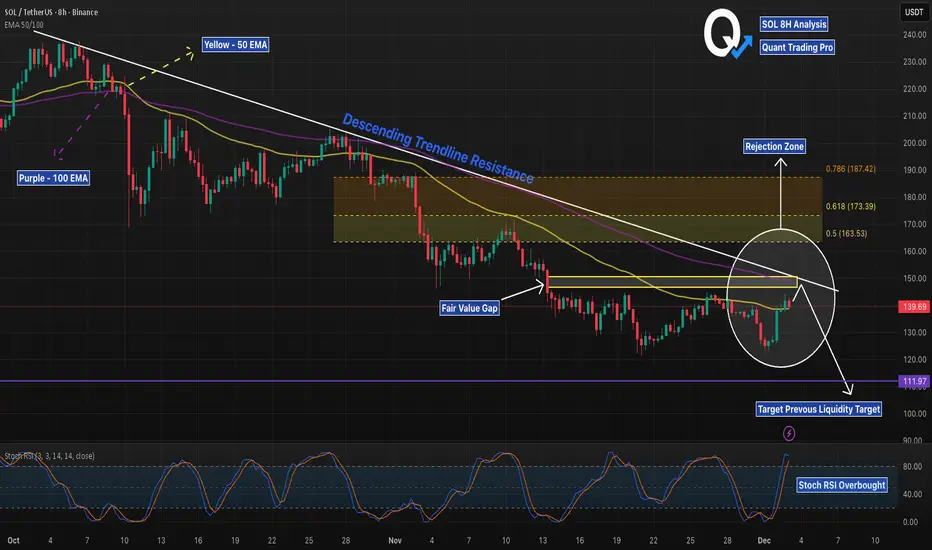
SOL 8H – FVG + EMA Rejection, Liquidity Next?SOL has tapped a clean multi-confluence rejection zone: the descending trendline, the 50/100 EMA cluster, and a filled Fair Value Gap all stack at the same price level. This area has acted as a strong pivot throughout November, and today’s reaction is consistent with prior trendline rejections.
The Stoch RSI is already in overbought territory on the 8H, adding momentum exhaustion to the setup. Bears will watch for continuation toward the major liquidity level around $111.97, which remains untested below.
For bulls to regain control, price must break and hold above the EMA cluster and FVG, flipping the trendline into support. Until then, the path of least resistance remains down toward liquidity.
FireHoseReel | All Eyes on Solana at This Critical Level🔥 Welcome to FireHoseReel!
Let’s jump into the Solana (SOL) market structure.
👀 SOL – 4H Overview
After breaking its descending curve structure, SOL faced strong resistance at $144 but failed to break it, leading to a sharp rejection.
Price then formed a double bottom and pushed back toward the same resistance. SOL is now trading near this critical zone once again.
📊 Volume Analysis
Volume increased significantly during the formation of the double bottom, driving a sharp move back toward resistance.
If buy volume remains sustained, the probability of a breakout above $144 increases.
✍️ SOL Trading Scenarios
You can use the following scenarios alongside your own trading strategy:
🟢 Long Scenario (Breakout Setup)
A confirmed breakout above $144, supported by a strong increase in buy volume, could provide a solid long opportunity on SOL.
🟢 Long Scenario (Aggressive Risk Setup)
Wait for price to consolidate, then enter during the pullback with decreasing volume, followed by the first signs of renewed buying pressure.
This setup allows for a tighter stop-loss and faster R:R, suitable for higher-risk traders.
🔴 Short Scenario
A loss of the key support at $124, accompanied by strong sell pressure, could activate a valid short setup for SOL.
❤️ Risk Management & Emotional Discipline
Crypto trading is highly risky. Without proper risk management and emotional control, trading is no different from gambling.
Logic must always come before emotions. Learn to manage your trades, and enjoy the process of trading with control and discipline.

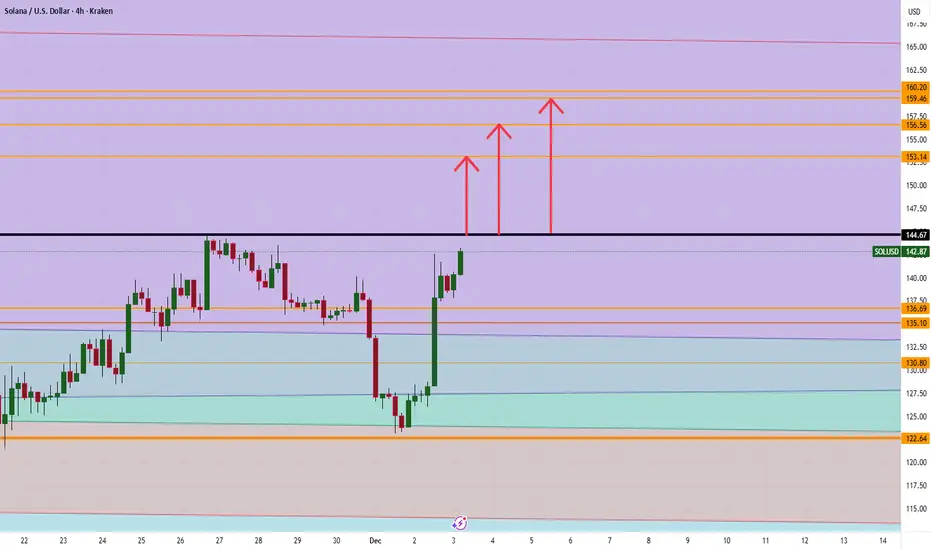
Solana Breakout to 153/156/ and 159 Jump on this MOVE !! Breakout on COINBASE:SOLUSD gets real only if we clear 144.67 with conviction. Above that, the levels to watch are 153, 156, and 159 for potential take profits.
Trade Smarter, Live Better/ Mindbloome Exchange.
If your trading feels stuck or you’re wrestling with a position right now, shoot me a message. Tell me what you’re doing, what’s not working, and I’ll send you a free, specific tweak you can test this week. No fluff, just something you can implement and see if it moves the needle.
SOL — WEEK 49 TREND REPORTSOLUSD — WEEK 49 TREND REPORT
Ticker: COINBASE:SOLUSD — 12/02/2025 @ 139.43$
Timeframe: WEEKLY
This is a reactive structural classification of SOL based on the weekly chart as of this timestamp. Price conditions are evaluated as they stand — nothing here is predictive or forward-assumptive.
⸻
1) Current Trend Condition
• Trend Duration: +8 weeks (Bearish)
• Trend Reversal Level (Bullish): 179.71$
• Trend Reversal Level (Bullish Confirmation): 187.51$
⸻
3) Temperature :
Cooling Phase
⸻
4) Momentum :
Bearish
⸻
Author’s Note
This analysis is fully reactive, not predictive. Market conditions, trend structure, and behavior are classified as they appear in real time. The objective is to identify where directional shifts first occurred, where structural integrity remains intact, and where it would begin to weaken if key levels were breached.
Predictive analysis projects outcomes that do not exist yet. Without price confirmation, prediction is built on baseless assumptions. This framework avoids that entirely by responding only to verified structural changes and live conditions.
The levels shown simply identify where the current trend structure first shifted and where it would begin to lose integrity if breached. Recognizing these boundaries allows for clearer interpretation of market behavior without relying on forward guarantees, speculative projections, or unsupported assumptions.
⸻
Methodology Overview
This classification framework evaluates directional conditions using internal trend-interpretation logic that references price behavior relative to its structural layers. These relationships are used to identify when price movement aligns with the framework’s criteria for directional phases, transition points, or regime shifts. Visual elements or structural labels reflect these internal interpretations, rather than explicit trading signals or preset indicator crossovers. This framework is observational only and does not imply future outcomes.

HUMA/USDT – Reversal Incoming or Deeper Breakdown?HUMA has been moving inside a large Descending Channel for months, forming a repeated yet controlled pattern of selling pressure. Every rally has consistently failed to break the upper trendline, maintaining a strong lower-high structure. But now, something important is happening:
👉 Price is sitting directly above the Key Support at 0.025–0.0225, a long-standing “life-or-death” zone for buyers.
This is not just another support — this is the final defense before a major structural breakdown or a powerful market reversal.
---
🔶 Clear Technical Structure
1. Descending Channel (Major Trend)
The trend remains bearish, but the channel is tightening — an early sign of momentum shift.
2. Key Support Box (0.025–0.0225)
This zone has acted as a strong demand area multiple times.
The more it gets tested, the bigger the potential move — either a breakout upward or a sharp breakdown.
3. Midline Reaction
Price frequently reacts around the midline, showing that market participants are respecting this dynamic level.
4. Key Horizontal Targets
0.031 → 0.037 → 0.0445 → 0.055 → 0.067
These levels are not only resistance but also potential rally checkpoints if structure shifts bullish.
---
🟢 Bullish Scenario (Major Reversal Potential)
Bullish bias becomes valid only if:
1. Price breaks the upper trendline with clean momentum.
A breakout without volume is not valid.
2. Daily close above 0.031.
This confirms the long-term downtrend is weakening.
If confirmed, bullish targets:
TP1: 0.037 (nearest resistance, minor rejection zone)
TP2: 0.0445 (major structural resistance)
TP3: 0.055 (bullish structure activation)
TP4: 0.067 (high-value upside target)
Bullish Intent
The channel has extended for a long period — sellers may be exhausted.
Price is stabilizing near strong support.
Large reversals often begin from areas like this.
---
🔴 Bearish Scenario (Trend Continuation)
Bearish momentum continues if:
Daily close falls below 0.0225.
This would indicate the final support has failed.
Bearish downside targets:
T1: 0.018 (mid-to-lower channel zone)
T2: 0.015–0.0135 (lower boundary, potential capitulation sweep)
Bearish Intent
The Descending Channel remains dominant.
Selling pressure is still strong near the upper trendline.
Losing the key support can trigger panic-driven moves.
---
🎯 Market Psychology
The 0.025–0.0225 level currently represents:
A slow accumulation zone for smart money, or
A distribution zone before continuation downward
At this stage, the market is choosing its next direction — and the move that follows this zone is usually significant.
---
#HUMA #HUMAUSDT #CryptoAnalysis #TechnicalAnalysis #DescendingChannel #ReversalZone #BreakoutWatch #CryptoTrading #AltcoinAnalysis #MarketStructure #SupportAndResistance #ChartPatterns

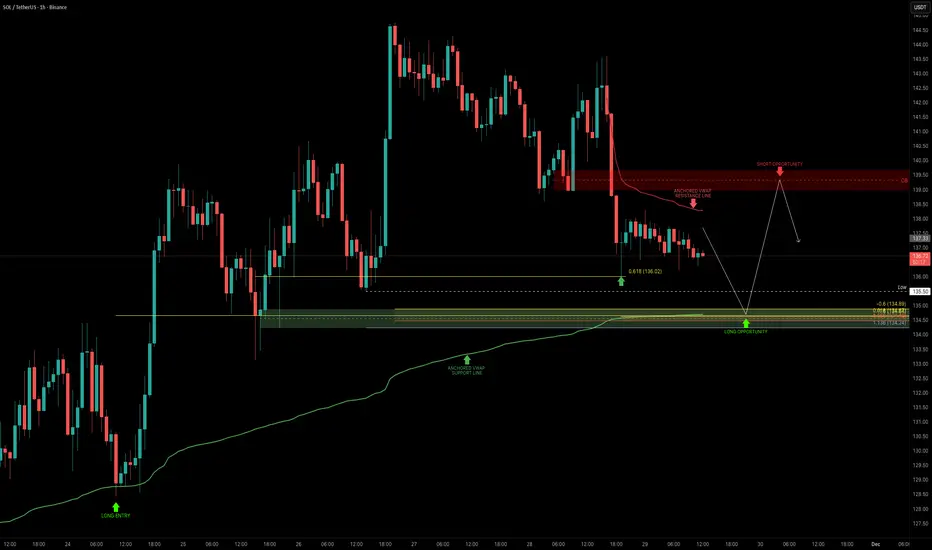
SOL — Fibonacci & Anchored VWAP ConfluenceSOL continues to be one of the most technically reliable assets, consistently respecting Fibonacci levels and key market structures. The zone between $135–$134 stands out as the next high-probability long opportunity, with multiple Fibonacci clusters lining up with the anchored VWAP from the swing low. The $134 level also aligns with the 75B market cap, adding an additional layer of confluence.
I’m looking for a long setup in this zone, targeting the $139–$140 order block for TP. This gives a clean 1:3 R:R, with the stop placed just below $133.
I’m currently developing a dynamic confluence indicator that highlights stacked support and resistance zones with high-probability reversal zones. The $139–$140 zone is currently showing a cluster of resistance, reinforcing it as the ideal TP target.
_________________________________
💬 If you found this helpful, drop a like and comment!
SOLANA: Wave Energy on the Threshold of ImpulseSOLANA: Wave Energy on the Threshold of Impulse
Based on the current wave structure, Solana is completing its corrective phase and preparing to form a new movement. The chart shows a transition from sideways momentum to a more pronounced impulse, which could set the direction for the near term.
Primary scenario: After the correction ends, a downward impulse sequence is expected to develop. Alternative scenario: If the market consolidates above recent highs, it could continue to rise, delaying the start of a new downward wave.
Idea for traders: Watch for confirmation of the structure on lower timeframes and enter only after clear reversal signals appear.
Risk management: Use clear stop levels and adjust your plan as new impulses emerge.
Friends, more wave analysis is available in our profile.
Subscribe to stay up to date with wave analysis!
her name was solanagm,
i'm projecting a push up on solana to about $400 into 2026.
this is my most conservative target.
---
from the lows of 2022, solana has seen one of the most beautiful impulses in the whole market,
the only impulse that was cleaner is probably bitcoin.
---
between june 2023, and march 2024 i believe solana played on a 3rd wave
between march 2024, and april 2025, i believe solana played out an expanded flat w4
everything after is building either an ending diagonal for the final 5th,
or
a potential extended 5th.
---
$400 is the low end for the final 5th, especially if we play out an ending diag.
$549 - $876 is the high end, if solana decides to play out an extended 5th

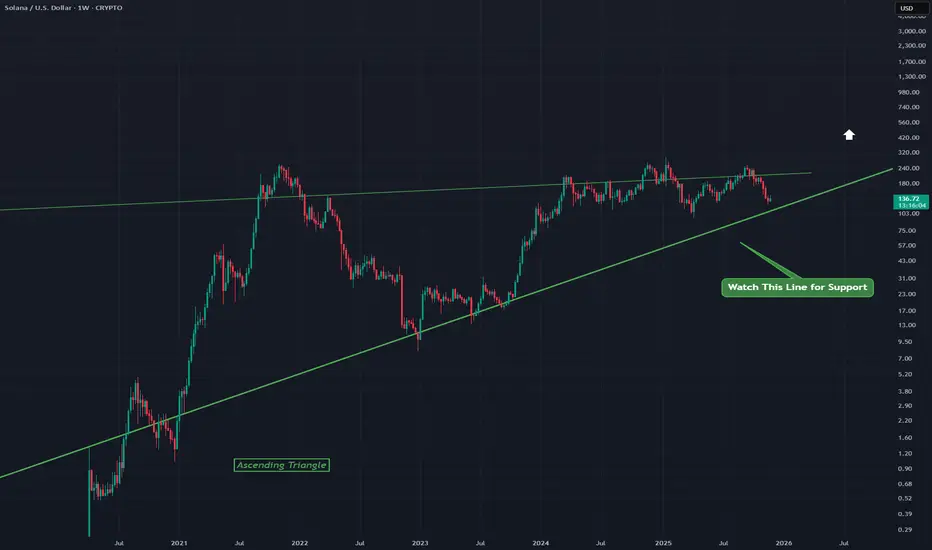
SOLUSD - Ascending Triangle A bullish ascending triangle on SOLUSD
Watch the lower line to confirm support and then break out potential
This is the Weekly chart so long term good for Solana
SOL , Final Liquidity Zone Before Expansion?SOL has tapped into a major confluence zone combining Fibonacci supports, structural demand and RSI compression. Price is currently reacting from the 0.618–0.786 golden pocket, forming a potential pivot area where reversals often begin.
The descending structure has guided price into a layered support block that has repeatedly acted as a re-accumulation area in previous cycles. The current reaction is still early, but market behaviour suggests that sellers may be losing momentum.
Key Technical Notes:
• The 0.618, 0.786 and 0.886 retracement levels align perfectly with previous demand
• Price is inside a falling wedge, a pattern that often precedes expansion
• RSI is forming a descending resistance line, hinting at a potential bullish breakout
• The higher-timeframe support remains intact as long as SOL holds above the zone
• Liquidity beneath the prior lows has been swept, reducing downside inefficiency
Structural View:
SOL’s corrective leg is nearing exhaustion. If price maintains structure above the golden pocket and breaks the wedge resistance, the next impulsive wave could begin, targeting mid-range levels first, followed by major resistances.
Invalidation:
A daily close below 106.40 would invalidate this structure and open deeper retracement scenarios.
Simple Explanation:
SOL is in a key discount zone. Fibonacci levels, demand and RSI all support the possibility of a reversal. A breakout above the trendline can ignite the next wave. Until then, the zone acts as a crucial turning point

Quick overview for Solana (Nov 12, 2025)CRYPTOCAP:SOL / #Solana Quick overview for Solana (Nov 12, 2025)
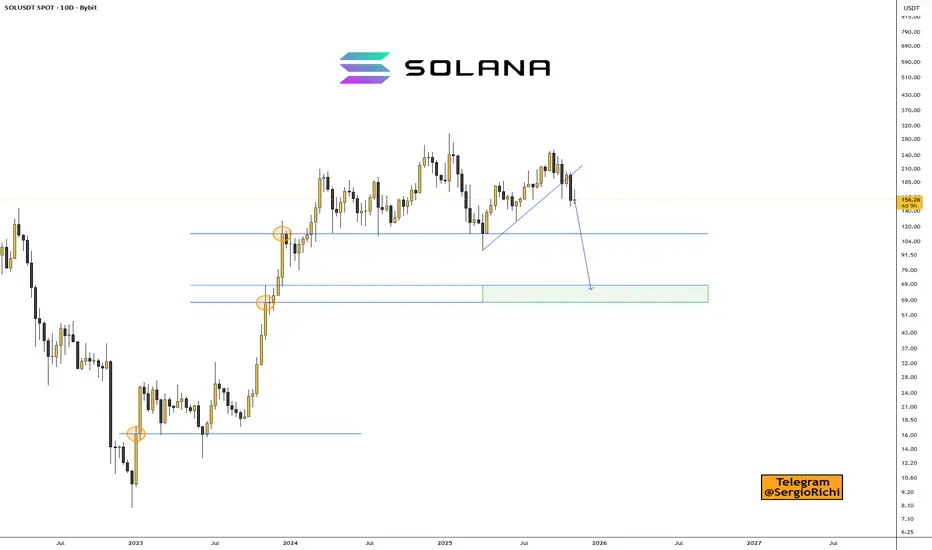
We've broken the trendline and are now trading below it on the 10-day timeframe.
No price rebound in sight, so the priority is to wait for a correction with the nearest targets at $60–$70, where we can look for entry points.
Coinglass is sneaky—they won't let you view data beyond a 3-month chart 😡.
➖ Essentially, there's a large order on Coinbase at $52 and on Binance at $79.
➖ We'll focus on $60–$70 and make decisions from there.
Charts:
Solana: Is the Bottom In, or More Downside Ahead? SOL has already climbed more than 15% from last Friday’s low at its peak, potentially signaling the completion of wave ii in orange. For now, however, we’re still keeping open the possibility that this move could dip to a new low—within our green Target Zone ($155.80–$113.20). In any case, once this interim correction wraps up, wave iii in orange should kick off an impulsive rally, only losing steam above resistance at $295.31.

TradeCityPro | SOL Testing Major Trendline for Next Big Move👋 Welcome to TradeCityPro!
In this analysis, I want to review SOL, one of the most popular cryptocurrencies, ranked 6th on CoinMarketCap with a market cap of $76 billion.
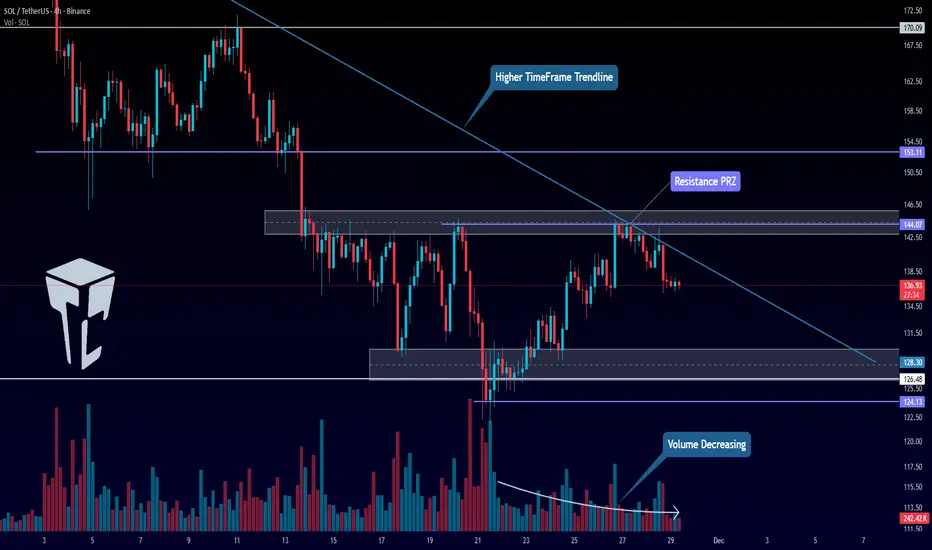
⏳ 4-Hour Timeframe
Solana has been respecting a descending trendline coming from higher timeframes. The price has touched this trendline multiple times, and it has interacted with it again recently.
✨ Overall, after completing its previous bearish wave, Solana has formed a range box, and the price has been oscillating between the support and resistance zones I’ve marked for you.
✔️ The top of this box can be identified at 144.07, since the price has reacted to this level twice. However, the entire zone I've highlighted is a significant resistance area.
💡 This resistance overlaps with the descending trendline from the daily timeframe, forming a strong PRZ (Potential Reversal Zone).
💥 On top of that, while Solana was moving from the bottom of the box toward the top, market volume was decreasing, and the size of the bullish candles was very small — both clear signs of weak buying pressure.
📊 Once the price reached the PRZ, sellers entered the market again, and the price is now moving downward along the trendline.
🧩 If this trendline does not break, and the price continues moving downward toward the $126 support, the chances of the support failing increase significantly. In that scenario, a short position can be taken on a break of that support.
📈 However, if the trendline does break, then the 144.07 level becomes the best trigger for trendline breakout confirmation.
⚡️ A stabilization above this zone would give us confirmation of a bullish reversal on Solana and provide a clean setup for opening a long position.
📝 Final Thoughts
Stay calm, trade wisely, and let's capture the market's best opportunities!
This analysis reflects our opinions and is not financial advice.
Share your thoughts in the comments, and don’t forget to share this analysis with your friends! ❤️
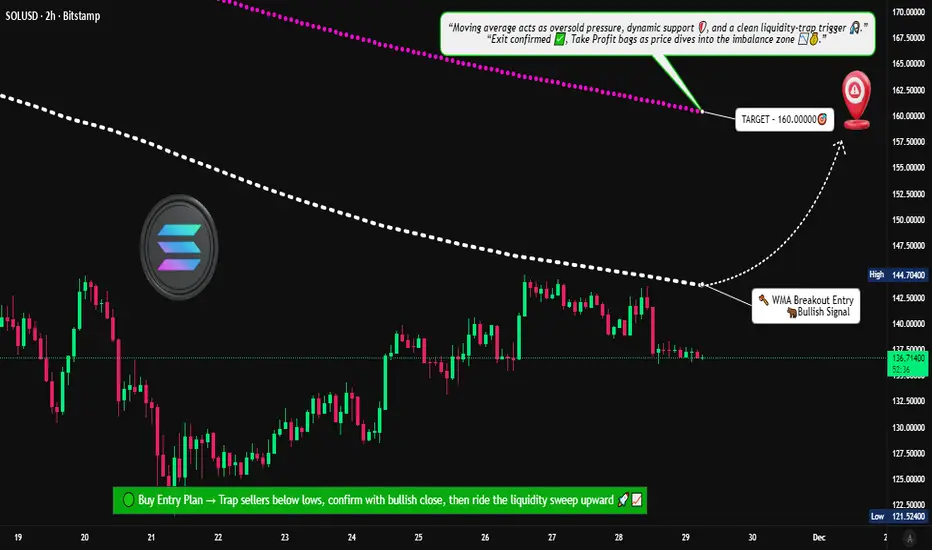
Is Solana Preparing for a New Upside Wave After WMA Breakout?📊 SOL/USD – “SOLANA VS U.S Dollar” Crypto Market Opportunity Blueprint (Swing Trade)
🟢 Trade Plan Overview
The bullish structure is confirmed after Weighted Moving Average (WMA) dynamic support breakout, signalling fresh momentum entering the market. This setup favors continuation as long as SOL holds above the breakout zone.
📌 Entry Zone
➡️ Entry: Any price level after the WMA breakout above 145.00000
The breakout + retest combination is your strongest confirmation. Let the chart validate the move—no rush entries.
🛡️ Stop Loss (Risk Protection)
➡️ Suggested SL: 132.50000
Dear Ladies & Gentlemen (Thief OG’s):
Use this SL only as a reference. Adjust based on your personal execution style, risk tolerance, and position size.
Place SL only after breakout confirmation — not before.
🎯 Profit Target
➡️ Target: 160.00000
Weighted moving averages are acting as dynamic resistance, and indicators show signs of potential overbought traps, so secure profits early instead of overstaying.
Dear Ladies & Gentlemen (Thief OG’s):
TP is your own choice. Lock in profits based on your comfort, not just my blueprint.
📚 Market Reasoning
WMA breakout shows renewed bullish strength.
Structure support aligned with higher-timeframe trend.
Volume expansion confirms buyers stepping in.
Resistance cluster around 160 remains the key zone to offload profits.
🔎 Related Pairs to Watch (Correlation & Key Notes)
💠 BITSTAMP:BTCUSD (Bitcoin)
High correlation with total crypto liquidity.
Strong BTC breakouts often pull SOL upward because altcoins follow BTC’s macro flow.
If BTC loses trend support, SOL setups weaken.
💠 BITSTAMP:ETHUSD (Ethereum)
ETH and SOL share similar Layer-1 ecosystem flows.
When ETH rallies aggressively, funds rotate into strong alts like SOL.
Good to use as a sentiment confirmation tool.
💠 COINBASE:ADAUSD (Cardano)
Another L1 competitor; correlated during broad alt-season pushes.
When ADA moves, retail interest usually spreads across L1s — including SOL.
💠 COINBASE:AVAXUSD (Avalanche)
Solana + Avalanche often move together during risk-on bursts.
AVAX momentum adds conviction to SOL’s breakout reliability.
💠 BINANCE:SOLBTC
The most important relative strength pair for SOL.
If SOLBTC is trending upward, SOL outperforms majors — huge confirmation signal for swing trades.
📈 Final Thoughts
This trade plan balances momentum, trend structure, and dynamic WMA confirmation. Follow the breakout logic, respect your risk, and let the chart guide your exits. The idea is designed to help traders act with clarity, control, and professional-level precision.
Solana: Is the Bottom In, or More Downside Ahead?SOL has already climbed more than 15% from last Friday’s low at its peak, potentially signaling the completion of wave ii in orange. For now, however, we’re still keeping open the possibility that this move could dip to a new low—within our green Target Zone ($155.80–$113.20). In any case, once this interim correction wraps up, wave iii in orange should kick off an impulsive rally, only losing steam above resistance at $295.31.

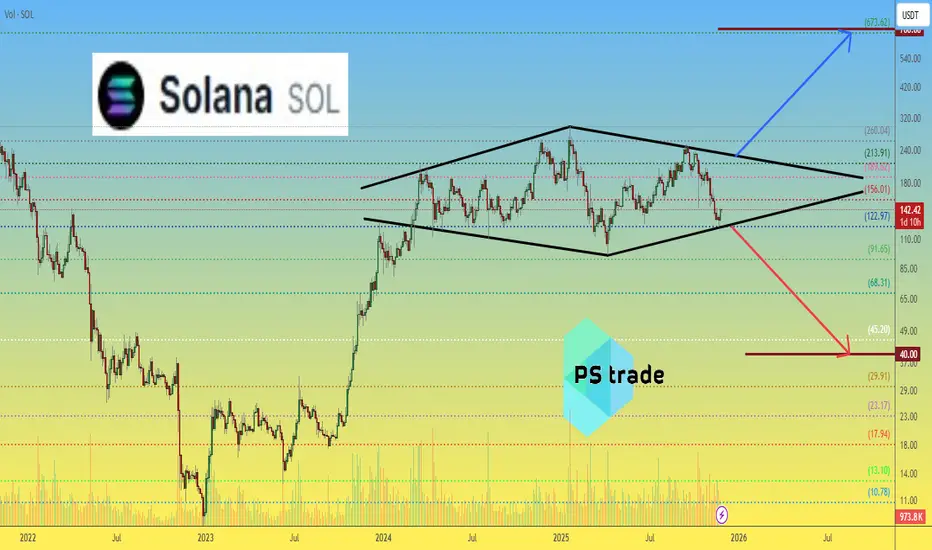
Solana SOL price analysisA notable long-term structure is developing on the OKX:SOLUSDT chart — a 1.5-year consolidation resembling a broad “diamond” formation.
Such structures in classical technical analysis often appear near the end of distribution phases and may precede a deeper downside continuation.
From this perspective, a potential move toward the $40 region cannot be excluded.
At the same time, market data presents a contrasting signal:
• #Solana ETF remains one of the few crypto-related instruments consistently showing positive daily inflows
• Both CRYPTOCAP:BTC and CRYPTOCAP:ETH ETFs have not demonstrated the same level of capital interest
• This suggests that institutional positioning around CRYPTOCAP:SOL may be slowly increasing
If capital inflows persist, higher-timeframe upside scenarios — even toward the $700 region — could remain on the table in the broader macrotrend.
What scenario do you find more probable at this stage: deeper correction or long-term continuation?
______________
◆ Follow us ❤️ for daily crypto insights & updates!
🚀 Don’t miss out on important market moves
🧠 DYOR | This is not financial advice, just thinking out loud
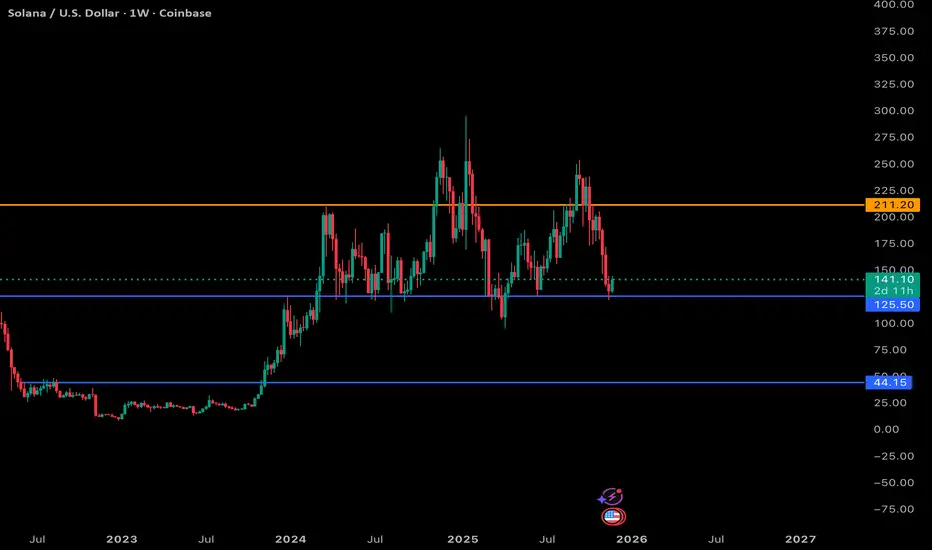
SOL UPDATE: My thoughts going into the Nov 28 2025 Weekend SOL is showing a solid reaction off the 125 support zone, which has been a major weekly level throughout this entire range.
As long as buyers defend this area, SOL can attempt a bounce back toward the mid-140s and potentially re-test the 170 region.
Still a choppy, range-bound structure overall, but this is the exact spot bulls needed to step in.
SOL/USDT: Strong Uptrend – Short-Term Buy Opportunity!We are witnessing an excellent opportunity on the SOL/USDT chart, as Solana (SOL) continues to maintain a strong upward trend. In the context of a gradually stabilizing cryptocurrency market and positive news about Solana's ecosystem development, SOL is entering a significant price increase phase.
Currently, SOL/USDT is trading within an ascending channel and has broken out of the 140.00 support zone . The price is fluctuating around 143.66, close to the 140.00 support, which could see a slight pullback before continuing the upward momentum.
The next target for SOL/USDT in the short term is 155.00, where it might encounter some resistance. However, if the price maintains above 140.00, there is a high probability that SOL could continue its strong upward momentum towards 156.00 and even beyond.
Trading Strategy:
Buy SOL around the 140.00–143.00 range, with a short-term target of 155.00 and 156.00.
Set stop-loss if the price breaks below 139.00, as this is a crucial support level within the current uptrend channel.
In conclusion, SOL/USDT is maintaining a solid uptrend, and with positive signals from both technical indicators and fundamental factors, buying around the support zone is a reasonable strategy to capitalize on the upward movement.
