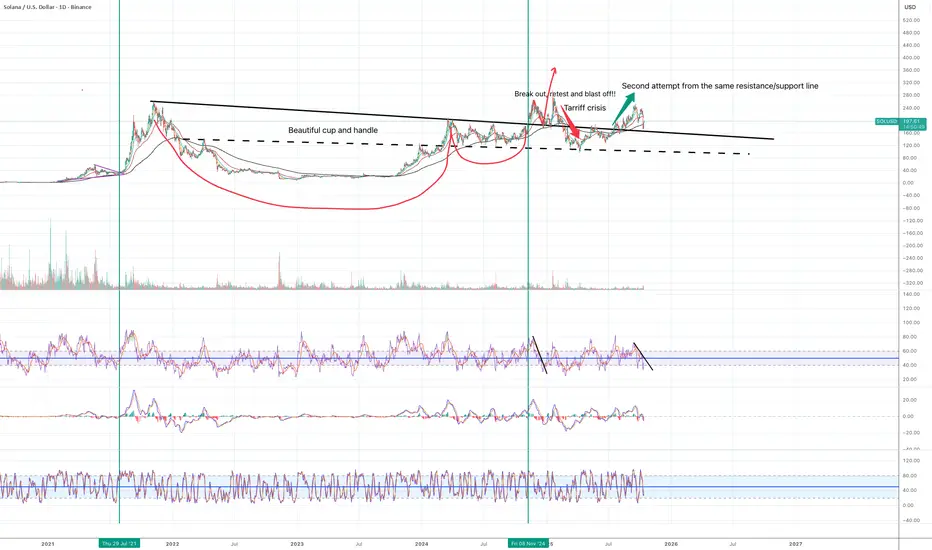
The second attempt to complete a massive cup and handle ?Solana is forming a massive cup and handle in the daily chart. In early November, Solana finally broke above the resistance line and (temporarily) completed the cup and handle pattern.
It is only the speculation, but if we did not have the US tariff drama, Solana (and the rest of the market) would have started a strong bull cycle.
In August 2025, the price finally broke above the resistance line again. It looked like the price was going to finally start to move to the upside. Then, we experienced another crypto bloodbath due to the US-China tariff issue last Friday. I have no idea how the next few weeks will unfold, but at this stage, the price managed to stay above the support line and it is recovering.
I already hold Solana positive for long term investment, but I intend to open a swing trade position when:
1. Daily RSI lines cross to the upside and break above the descending resistance line.
2. Stochastic move to the 50 zone.
3. MACD lines can stay in the bear zone, but the lines needs to cross and tilt to the upside.
Solana
Too Early to Buy Solana? Watch the $200–210 ZoneAs mentioned in my general crypto post yesterday, I remain bullish on the broader market and still hold some altcoins at this stage.
However, that doesn’t mean we should jump in blindly, assuming this is it.
Every setup needs confirmation — and Solana is no exception.
At the time of writing, SOL/USD is trading close to my initial entry area, but price action deserves a closer look.
1. What Happened on Friday
The general market sell-off pushed Solana below both a key horizontal support and the lower boundary of its rising channel — a clear bearish technical signal.
After that, we saw a strong recovery into the weekend, with price touching the psychological $200 level overnight before facing some resistance.
2. Current Market Structure
Despite the bounce, the structure remains bearish for now.
A clean stabilization and acceptance above the $200–210 zone would be the first technical sign of a potential trend shift to the upside.
3. Trading Plan
If you’re considering a long position on Solana, I believe it’s too early to enter.
The market looks overconfident in recovery, and when everyone assumes “the bottom is in,” that’s often when a new drop comes.
Wait for confirmation!

BTC/USD | BTC Crashes to $102K, Then Bounces Back – Still UnstabBy analyzing the Bitcoin (BTC) chart on the 12-hour timeframe, we can see that last night, following Trump’s tweet, the market faced a sharp sell-off, with BTC dropping all the way down to $102,000. After hitting this key demand zone, Bitcoin bounced back strongly, rallying up to $115,000, and is now trading around $110,000.
However, BTC still looks unstable, struggling to hold steady — to continue its bullish trend, it must stay above $110K. If it fails to hold this level, we could see the price dip below $100K again. This analysis will be updated soon as the market develops.
Please support me with your likes and comments to motivate me to share more analysis with you and share your opinion about the possible trend of this chart with me !
Best Regards , Arman Shaban

LTC/USDT | Litecoin’s 30% Rise Marks the Start of a Bigger Move!By analyzing the Litecoin (LTC) chart on the weekly (logarithmic) timeframe, we can see that the price started rising from around $115 after the last analysis and has now reached $133, marking a solid gain of over 30% so far!
If the current momentum continues, we could see Litecoin moving even higher. The next bullish targets are $155, $200, and $268.
Please support me with your likes and comments to motivate me to share more analysis with you and share your opinion about the possible trend of this chart with me !
Best Regards , Arman Shaban

What's up with Solana?As we can see, Solana is currently sitting at a resistance level and has managed to hold up well there. In addition, the uptrend has not been broken, since the candle closed back above the potential trend break.
The long wicks we’ve seen across several cryptocurrencies occurred because many trading algorithms on crypto exchanges were not designed to handle such situations properly. These algorithms often compare prices, demand, and supply across different exchanges to determine fair pricing.
For example, if $1 billion were to flow into Solana in a single day, it would have a much larger price impact than $100 million per day over ten days. That’s why traders should always wait for candle closures before making decisions.
The recent crash was triggered by an announcement from Donald Trump, which wasn’t directly related to cryptocurrencies themselves. The broader uptrend remains intact and continues.
Given the current uncertainty, prices are moving sideways. I would consider buying Solana around the $180 level or below, as that still represents a good entry price for this asset. If we soon see rate cuts and the U.S. dollar weakens further under Trump, more investors are likely to move into alternative assets such as cryptocurrencies and Solana remains one of the leading projects in that space.

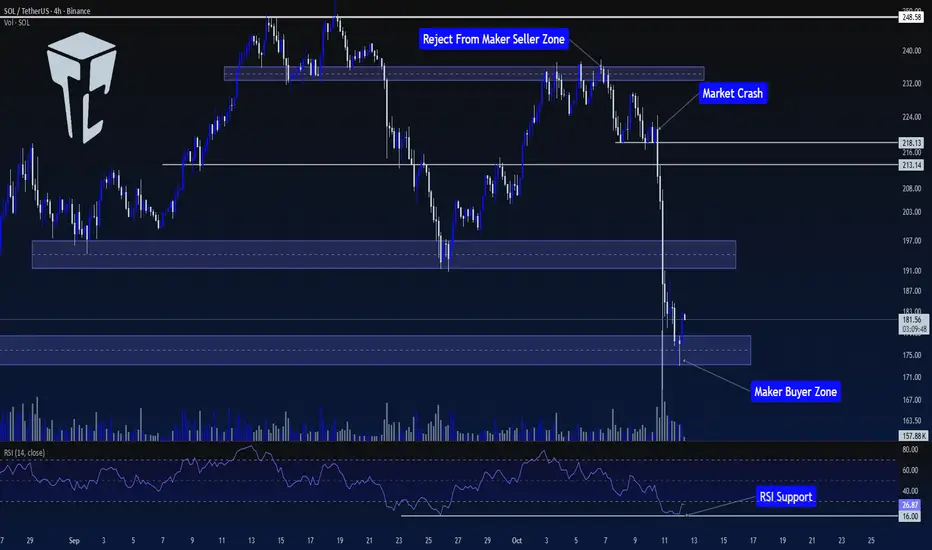
TradeCityPro | SOL: Market Calms After Sharp Move & RSI Support👋 Welcome to TradeCityPro!
Let’s analyze SOL, one of the most popular Ethereum killers with a market cap of $99.9 billion, currently ranking 6th on CoinMarketCap.
⏳ 4-Hour Timeframe
In the previous analysis, we had a Maker Buyer zone around $235. In that analysis, I mentioned that breaking this zone would be an early trigger for breaking $248.58.
🔍 However, the price never managed to sustain above this level, and after getting rejected from this zone, the price entered a corrective phase, forming a support at $218.13.
📊 After the price bounced from $218.13 for the first time, it failed to set a new high in line with previous highs and instead formed a lower high. The price returned to $218.13 again.
✔️ With the breakout of this level, coinciding with news between China and the U.S., the price started a sharp downward move, breaking through the $213.14 support.
✨ Over the course of 2-3 candles, SOL made a sharp move towards the first Maker Buyer zone, breaking it and reaching the second Maker Buyer zone.
💫 Naturally, there was a significant increase in selling volume during this move, and RSI dropped to 16, where it found support.
🧩 Currently, the market seems to have calmed down, with RSI still in the Oversell zone, but volatility has significantly decreased.
💡 Although the market has calmed, I believe the price needs to build a more structured setup before finding valid triggers, and the market conditions are not ideal for opening positions right now.
💥 So, for now, I won’t provide any triggers on this coin and will wait for more structure to form before making a better decision to open a position.
📝 Final Thoughts
Stay calm, trade wisely, and let's capture the market's best opportunities!
This analysis reflects our opinions and is not financial advice.
Share your thoughts in the comments, and don’t forget to share this analysis with your friends! ❤️
Solana Scenarios for the monthMonthly Scenarios
Bullish Scenario
SOL holds support in the $180-$184 range and breaks above $184-$190.
This will provide impetus to targets in the $230-$300+ range, especially if the market turns out favorable and there is positive news regarding SOL/ETF/on-chain activity.
Consolidation/Sideways
The price may remain stuck in the $180-$190 range without a clear direction, especially with light volume.
In this scenario, it is important to monitor reactions at the range boundaries.
Bearish Scenario
If SOL breaks below $180-$184 with volume, a decline to the lower support level of $143-$153 or even lower is possible.
Such a correction could serve as a "normalization" after a significant rise.
✅ Conclusion
The current monthly trend for SOL appears generally bullish, with strong potential for continued growth upon a breakout of resistance.
But the key area to watch is the $184–190 zone: if there's a breakout with volume, we expect an upward acceleration.
The $180 and especially $153–143 support zones are areas to monitor for trend stability.
The CoinCodex forecast (~3-5%) suggests moderate growth, but with the potential for strong momentum under favorable conditions.
DO NOT BUY THE DIP! Watch what Nasdaq is doing. My overall bias for Solana is bullish, but right now the trend is very bearish. I don't think it is the time to buy the dip and I think more aggressive downside move is possible.
I have listed the reasons for my views below:
Nasdaq chart:
1) The correlation between Bitcoin and Nasdaq has been very high. Nasdaq has been going up since April 2025 without any decent correction and this week's candle finally formed a clear bearish engulfing candle.
2) Daily RSI and Stochastic have formed clear negative divergence and they are rolling to the downside.
Bitcoin chart:
1) RSI in both monthly and weekly charts show clear negative divergence.
2) The price failed to break above the major ascending resistance line and started to drop aggressively.
Solana chart:
Solana follows Bitcoin and Solana's move is much more aggressive than that of Bitcoin. Based on the moves of Nasdaq and Bitcoin, I am anticipating Solana will continue to drop further. Temporary recovery might be possible but I need to wait and see how Nasdaq moves this week.
Solana weekly chart:
The price is moving inside the parallel channel for the last 5 years.
The price started to move in Oct 2023 and reached $204 at Fib 0.786 level in March 2024. However, since then the price has been basically moving sideways.
I have been using the three ascending trend lines in the weekly chart along with momentum indicators as rough guides to understand the price action.
The price moved up to the top of the green trend line, failed to break above and now is heading down to the purple trend line.
RSI also rolled to the downside. Stochastic formed negative divergence.
Solana daily chart:
Friday's daily candle formed a massive bottom wick. (see the yellow rectangular box in the daily chart).
In regard to a long wick, I found on many occasions if the price doesn't immediately start to move above the closing price in the following day, the length of the wick becomes the range where the price oscillates for a while and often it moves further to the downside. Therefore, I am closely watching the price move in shorter time frames such as 15 min and 1H.
Conclusions:
Given all the positive developments happening in the Solana ecosystem, it is very hard to accept the current price action. However, as a technical trader, I need to respect what the price is telling me and it is clearly bearish. I am not shorting Solana: I am waiting for the signs of recovery.
Three blue rectangular boxes in the weekly chart are unmitigated fair value gaps and I have set the buy orders in these zones. It is difficult to think the price will come down to the bottom blue box, however, if there is a massive capitulation event, it is possible for the price to wick down to that level.
I hope you are all doing well. It is a challenging market.
Can we buy?Most likely this can hit 150s and turn around, this has to happen with in a month or so. If it did then we will see it at 375. Happy trading !!
Not a financial advise.

SOLANA – Last Line of Defense🚨 CRYPTO:SOLUSD has completed a 3-wave corrective pullback, testing the April trendline and reaching the equal legs support zone at $175–$160. This area is acting as a potential launchpad for a bounce through the rest of the month.
💥 Can SOL break into new highs, or will this bounce form a lower high, signaling a possible trend reversal?

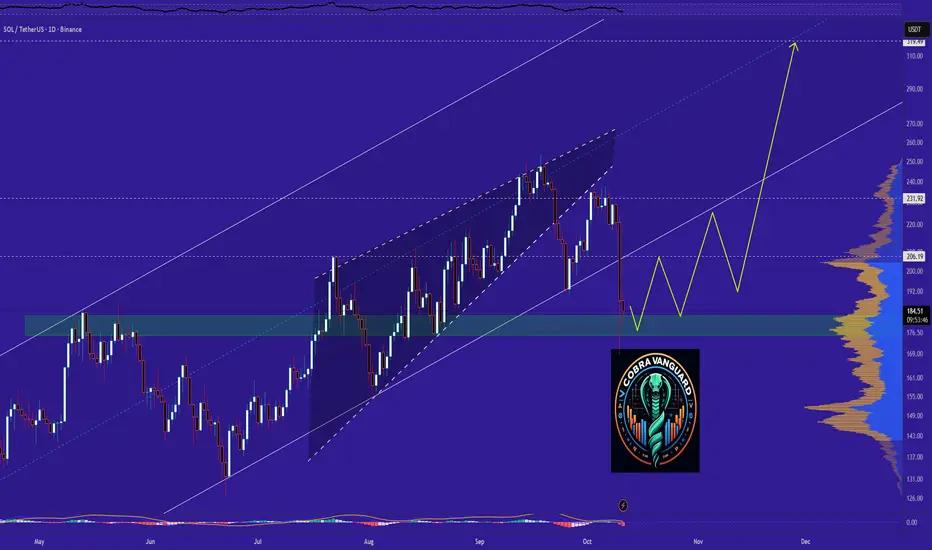
SOLANA Outlook after the Dip. What to expect NOW? has broken below its ascending channel support near $190, signaling short-term weakness. If buyers fail to reclaim this level, price could test the $150–$160 demand zone. A strong rebound from that area might restart the uptrend toward $220–$240.
The price can easily reach the shown targets from here.
Best regards CobraVanguard.💚
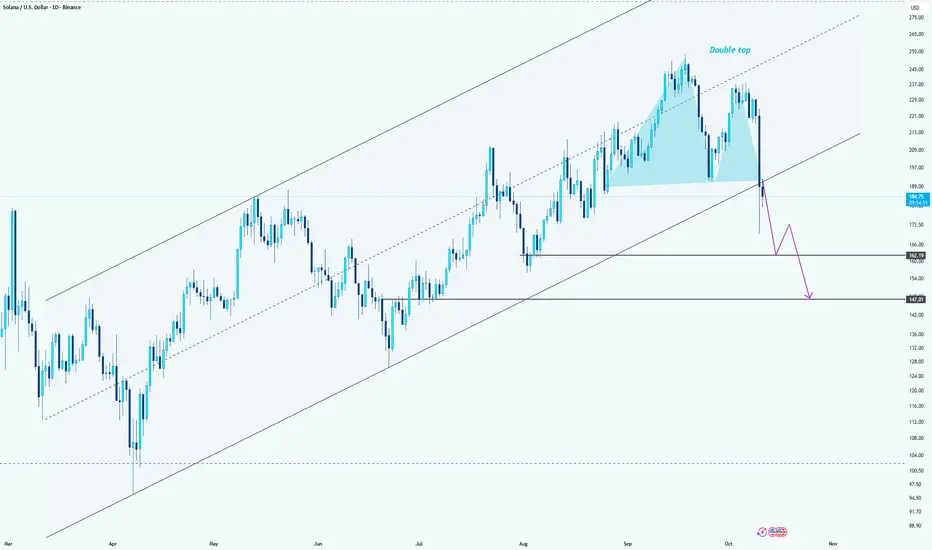
Solana Faces Bearish Pressure Below $190 SupportHi everyone!
Solana appears to be forming a double top pattern near the $250 zone, signaling potential bearish momentum. After failing to sustain above the upper channel resistance, the price broke below the midline support, confirming short-term weakness.
Currently, SOL is retesting the neckline area around $190. If it fails to reclaim this level, further downside is likely. The next key support zones lie around $165 and $147, aligning with the previous structure and the lower channel boundary.
A clean break below $165 would likely accelerate the move toward $147, confirming a deeper correction within the broader ascending channel.
Bias: Bearish below $190
potential targets at $165 → $147.
DO NOT BUY THE DIP!! It can go lower. My overall bias for Solana is bullish, but I must say it has been very frustrating asset to hold and trade for the last 18 months.
There are a lot of positive news coming up in the Solana ecosystem and the value of Solana should be much higher than the current price. However, the current chart set up is very bearish and I think it can potentially go lower. I will happily revise my view when the situation changes but I won't be buying the dip for the reasons below:
Weekly:
Stochastic indicator has formed a very clear negative divergence.
RSI lines have crossed to the downside and breached below the ascending trendline.
MACD histogram is losing bullish momentum and lines are about to cross (not confirmed)
The price has failed to go above not only the previous higher high, but also the previous cycle's all time high.
The price has breached below the ascending trendline, EMA 12 and EMA 21. (no confirmed until the end of tomorrow)
There is an unmitigated fair value gap (order block?) around $100 and $123 area (see light blue rectangular block). That is the April low when the market started to have a V-shape recovery.
I have been hearing over and over in the mainstream media that at the market bottom in April 2025, retail investors went in and bought the dip, but institutional players missed the rally by staying on the sideline. I am just wondering if big players are trying to push the price to the level where they were initially left behind. It is just my speculation, but the price is getting closer to that level.
Daily:
A daily candle closed below EMA55 and is now hovering over EMA200.
The price broke below the first ascending trendline (red line) and now moving toward the second one (black one)
All three momentum indicators have decisively entered the bear zone.
Conclusions:
I will only focus on daily and weekly charts for now. I have been watching the price move in the lower time frames and the price is refusing to go above yesterday's closing price, which makes me think there are lots of selling pressures still.
Good luck, everyone. I hope you are doing ok in this wild market.
$Solana $250+ or DOWN 216?In our recent post, we perfectly predicted the touch of 250 and 190.
Price has now reversed off the supply zone and is making its way back up, lets see what the potential out come for the next two weeks are!
Solana (SOL/USDT) 1H Chart Analysis
Current Price: ~$232
Trend : Price is was inside a clear ascending channel, respecting support and resistance lines - however has now breached resistance.
Key Levels
Support Zones:
$225 → Psychological support + 4H FVG.
$216 → Deeper 4H FVG and strong volume node. ( + 4 Hour Fib GP )
$200 → Major psychological level + prior supply zone flip.
Resistance Zones:
$250 → Psychological resistance + demand zone.
$275 → Next major resistance if $250 breaks.
Bullish Scenario
If SOL holds above $225 and consolidates within the trend channel, price could retest $250.
Break and close above $250 may extend rally toward $275.
Bearish Scenario
Failure to hold $225 could drag SOL to the $216 FVG or even $208.
A breakdown of $208 increases risk of revisiting $200.
Summary
Market structure remains bullish as long as price respects the rising trendline.
$225 is the key short-term pivot: holding above favors $250+, losing it opens downside risk toward $216–200.
Let me know what you think!

SOL - PERFECT PLAY.#SOL - MEDIUM TERM OUTLOOK - ON POINT 🔥📉
7.5% dump since this update.
Zooming on my macro time frame view, this could be the final dump before to see a huge move upward! 📈
(valid if 196 - 198$) act as key support.
Level by level.
Local support: 205 - 206$. (expecting some bull reaction soon, likely before the next dump?).
Also Keep an eye on the daily uptrend. 👀

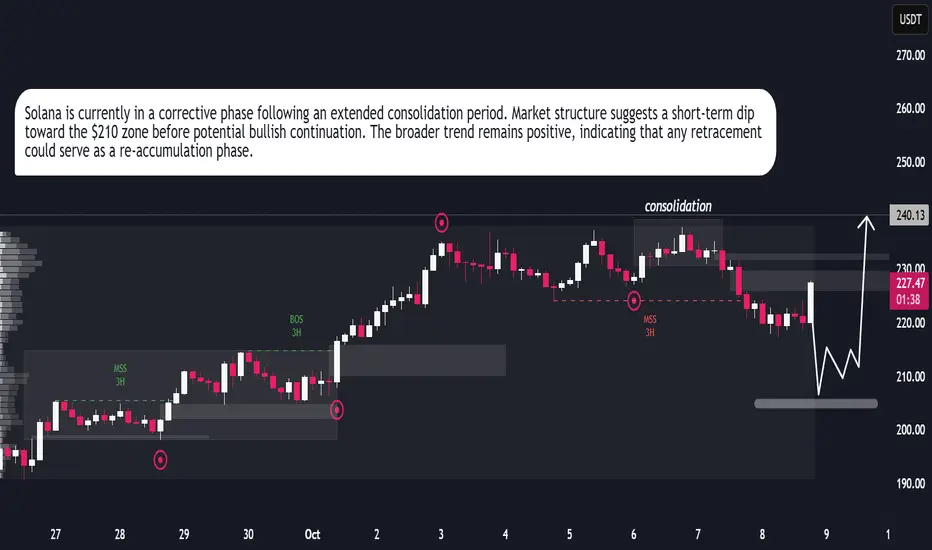
SOL | Network Strength Meets Market MomentumSolana (SOLUSDT) continues to show resilience as both technical and fundamental factors align for potential upside. On the technical side, the market has completed a controlled correction phase, suggesting liquidity buildup below recent lows. The structure remains bullish, with increasing volume and price stability hinting that buyers are regaining control. Fundamentally, Solana’s network growth and strong developer activity have reinforced investor confidence, supported by rising on-chain activity and ecosystem expansion in DeFi and NFTs. This combination of solid fundamentals and technical structure indicates the possibility of another bullish leg, with SOL positioning itself for a gradual climb toward the $240–$250 range in the near term.
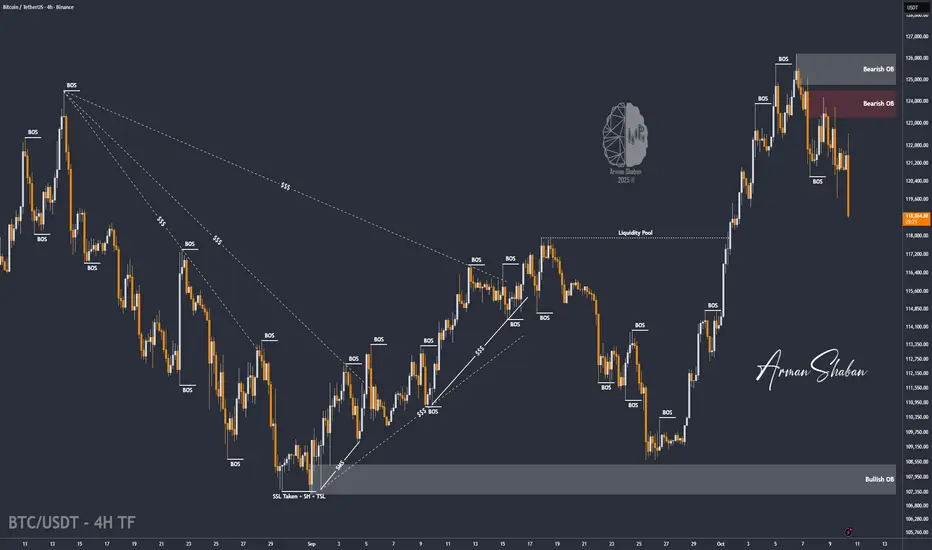
BTC/USDT | BTC Correction in Play – Will $117K Hold the Line?By analyzing the Bitcoin (BTC) chart on the 4-hour timeframe, we can see that after rallying up to $126,000 and setting a new all-time high (ATH), the price faced a sharp correction and is now trading around $119,000.
This drop could extend further toward $117,000, which is a key level to watch closely. If Bitcoin manages to hold above this zone, we could see the next bullish wave begin. Otherwise, the next major demand zones are at $115,000, $113,500, and $112,120.
Please support me with your likes and comments to motivate me to share more analysis with you and share your opinion about the possible trend of this chart with me !
Best Regards , Arman Shaban
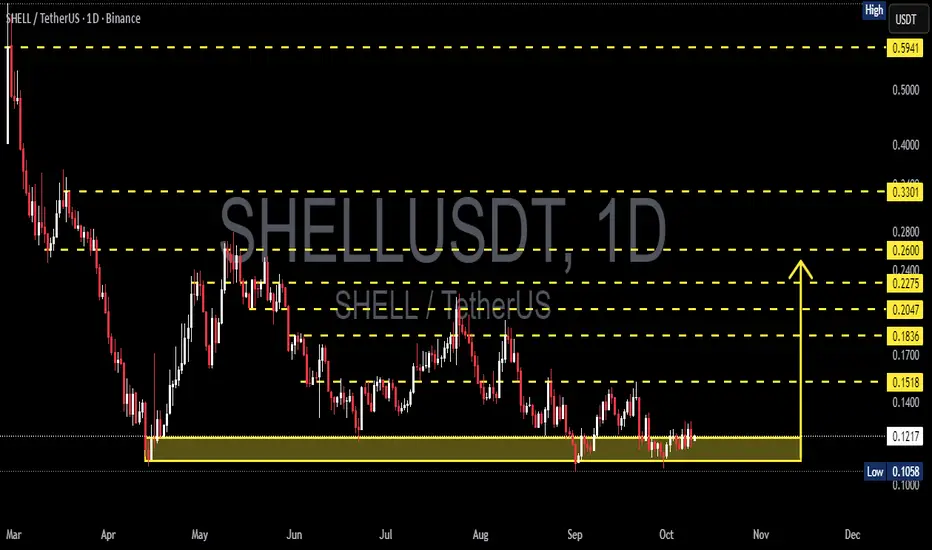
SHELL/USDT — Demand Zone: Accumulation or Final Breakdown?
SHELL is currently sitting at a critical support zone between 0.106–0.122 USDT, a region that has acted as a strong base since May. Each time price dips into this yellow zone, buyers have stepped in to absorb the selling pressure — marking it as a battlefield between bulls and bears.
However, sellers are still dominating the broader structure. The series of lower highs since August forms a clear descending triangle pattern, typically bearish — yet, in some cases, such formations become hidden accumulation zones once buying volume quietly starts building near the support.
---
Key Levels
Main Support Zone: 0.106–0.122 (highlighted in yellow — critical buyer defense)
Immediate Resistance: 0.1518 (first breakout trigger)
Next Resistance Levels: 0.1836 → 0.2047 → 0.2275 → 0.26
Major Resistance Targets: 0.33 and 0.59
Current Price: ≈ 0.1214 USDT
---
Market Structure
The current setup forms a descending triangle, defined by constant support and descending highs — a sign of ongoing bearish pressure.
Yet, if the support continues to hold and the market begins to form higher lows, this could shift into a reversal base, signaling the start of a potential trend recovery toward 0.18–0.20 USDT.
But if price breaks below 0.1058 with conviction, it may trigger a capitulation wave, driving SHELL down toward 0.06–0.08 USDT.
---
Bullish Scenario
Bullish confirmation checklist:
1. Price continues to hold above 0.106–0.122.
2. A daily close above 0.1518 with strong buying volume.
3. Successful retest of 0.1518 as new support.
Bullish targets:
0.1518 → 0.1836 → 0.2047 → 0.2275 → 0.26
Potential upside: +25% to +114% from current levels.
Bullish narrative:
If buyers manage to defend this zone, it could represent a final accumulation phase before a larger reversal. This structure often reflects where smart money starts positioning quietly before a trend shift.
---
Bearish Scenario
Bearish confirmation checklist:
1. A daily close below 0.1058 (confirmed breakdown).
2. Failed retest of previous support (turns into resistance).
3. Increasing sell volume confirming momentum continuation.
Downside projection (measured move):
Height of triangle ≈ 0.046 → Breakdown target ≈ 0.0598 USDT.
Potential drop: ~50% from current price.
Bearish narrative:
If the 0.106 zone collapses, buyers lose control. This could trigger a panic-sell phase, clearing out weak hands before the market finds its true bottom.
---
Strategic Takeaway
SHELL is at a make-or-break point:
Hold the zone: Possible start of a new accumulation and recovery.
Lose the zone: Likely continuation of the downtrend with deeper correction.
Aggressive traders may look for entries near support with tight stops below 0.1058.
Conservative traders can wait for confirmation above 0.1518 before taking a position.
Watch for volume spikes and daily closes — they’ll reveal whether this is the beginning of a new bullish cycle or a final breakdown before capitulation.
---
#SHELL #SHELLUSDT #CryptoAnalysis #SupportResistance #DescendingTriangle #Breakout #AltcoinSetup #CryptoChart #TechnicalAnalysis
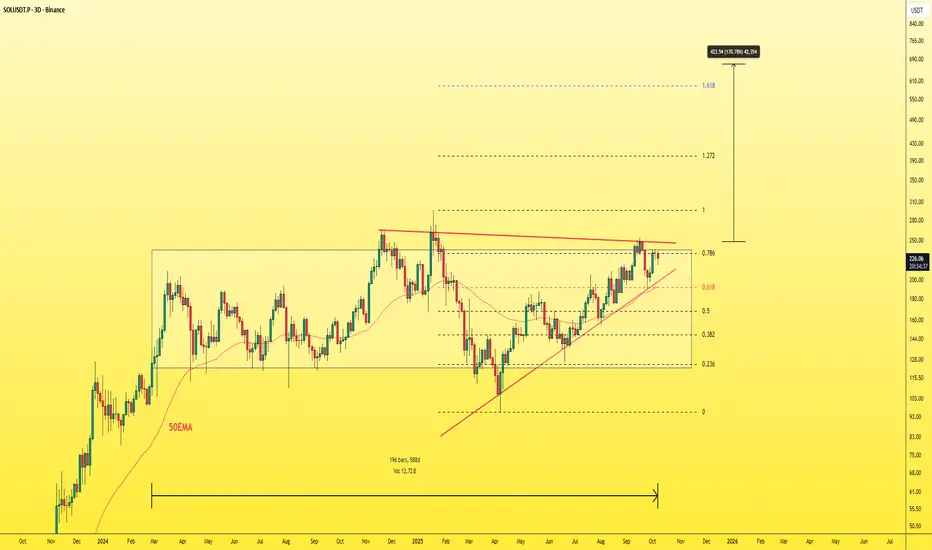
SOLUSDT - Smart Investment!If you missed the Ethereum rally, don’t miss Solana’s.
The 3-day chart looks insanely bullish — the coin has been consolidating for 588 days, almost 20 months.
Right now, it’s forming a massive triangle pattern with a minimum target of $650.
Trust me, you don’t need to put your money into crazy coins and risk losing it.
You’ve got SOL — with a strong chart and a solid market cap.
Forget those who say high market cap coins don’t move much.
Look at BNB, ETH, and BTC — they’ve all had massive runs and hit new all-time highs. It’s a much safer and smarter investment than chasing random volatile tokens.
Best Regards:
Ceciliones🎯
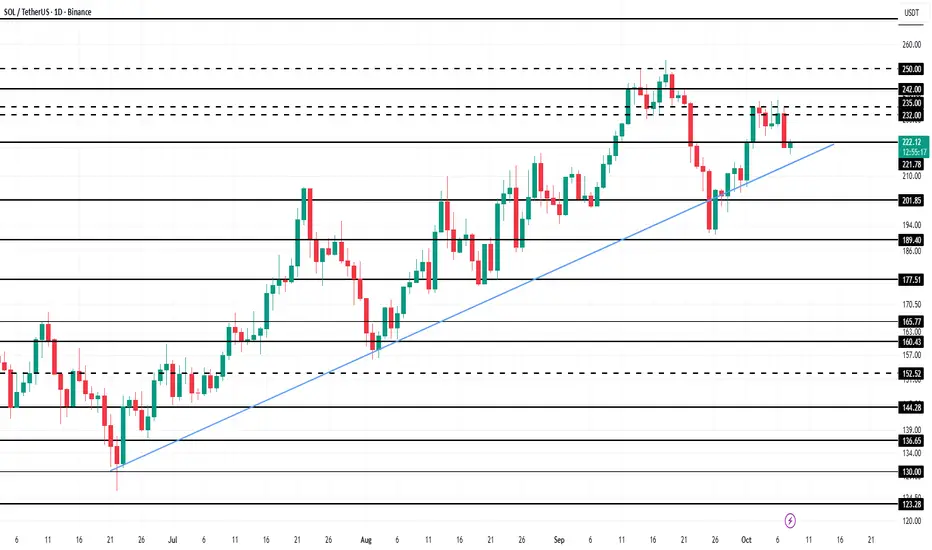
Solana Price’s 4-Month Uptrend Is Intact, But It May Not Last LoAt press time, Solana trades at $222, hovering just above the $221 support level. The altcoin has been in a consistent upward trend for the past three and a half months, making this level crucial for maintaining market structure.
Given current conditions, a dip to $213 seems likely if selling pressure increases. Stronger outflows could accelerate losses, pushing SOL to test the $200 level and breaking its multi-month uptrend.
Conversely, if Solana rebounds from $221 and market sentiment improves, it could climb toward $232 and beyond. Such a move would invalidate the bearish outlook and potentially reignite the rally.
KOMAUSDT — Trendline Breakout: Structural Reversal or Bull TrapOverview
KOMA/USDT has finally delivered a significant technical signal after months of consolidation within a tight accumulation range.
The latest daily candle successfully broke above a major descending trendline and a key horizontal resistance, signaling the early phase of a potential trend reversal from long-term bearish pressure to renewed bullish momentum.
This breakout could represent a psychological shift in market sentiment — from distribution to accumulation — and may define the next major leg of price expansion if confirmed by volume and structure.
---
Market Structure Insight
Primary Trend: Bearish since early 2025, marked by consistent lower highs and lower lows.
Structural Shift: A clear daily breakout above the descending trendline suggests the start of a higher-high structure formation.
Key Zone (Accumulation Range): The 0.020–0.027 area has acted as a multi-month resistance zone, now potentially flipping into new structural support (S-R Flip).
Momentum Confirmation: A strong breakout candle accompanied by volume expansion hints at growing institutional interest.
---
Technical Pattern Breakdown
The pattern combines two powerful structural elements:
Descending Trendline Breakout → indicates exhaustion of long-term selling pressure.
Range Accumulation Base → acts as the energy build-up phase before a new impulsive move.
If the price performs a successful retest of the breakout zone, this pattern transitions into a trend reversal base, which historically precedes sustained bullish continuation phases.
---
Bullish Scenario (Primary Bias)
1. Validation Conditions:
Daily close above 0.027 with sustained trading above the breakout zone.
Rising volume and RSI holding above the 50 line.
2. Continuation Setup:
A clean retest followed by a higher low formation would confirm structural reversal.
3. Upside Targets:
TP1: 0.0489 — First expansion resistance.
TP2: 0.0633 — Mid-term structural level.
TP3: 0.0935 — Major resistance zone.
Extended targets: 0.128 – 0.169 if momentum persists.
4. Stop-Loss Placement:
Below 0.020 or under the most recent swing low.
5. Risk/Reward Outlook:
Strong R:R potential (>3R) from the breakout base with multi-tier scaling opportunities.
---
Bearish Scenario (Alternative Bias)
1. Invalidation Trigger:
Daily close below 0.020 or a re-entry into the previous range (false breakout).
2. Market Implications:
A bull trap scenario could trigger a deeper correction toward 0.0142, the historical low support.
3. Volume Confirmation:
A drop with rising sell volume would confirm distribution rather than accumulation.
4. Bias Reversal:
If this occurs, the broader bearish structure remains intact and consolidation may resume.
This type of breakout often marks the transition from accumulation to markup phase, particularly if confirmed with a successful retest and sustained buying volume.
KOMA/USDT has just broken through the upper boundary of a long-standing downtrend — a technical milestone that could set the stage for medium-term reversal momentum.
However, confirmation is key. Without a retest that holds, this move could remain a temporary liquidity sweep.
Traders should closely monitor daily closes and reaction around the 0.027 zone to confirm whether this is a true structural reversal or merely a bull trap.
#KOMA #KOMAUSDT #CryptoAnalysis #BreakoutTrading #TechnicalAnalysis #PriceAction #AltcoinWatch #CryptoMarket #TrendReversal #SupportResistance #RiskManagement

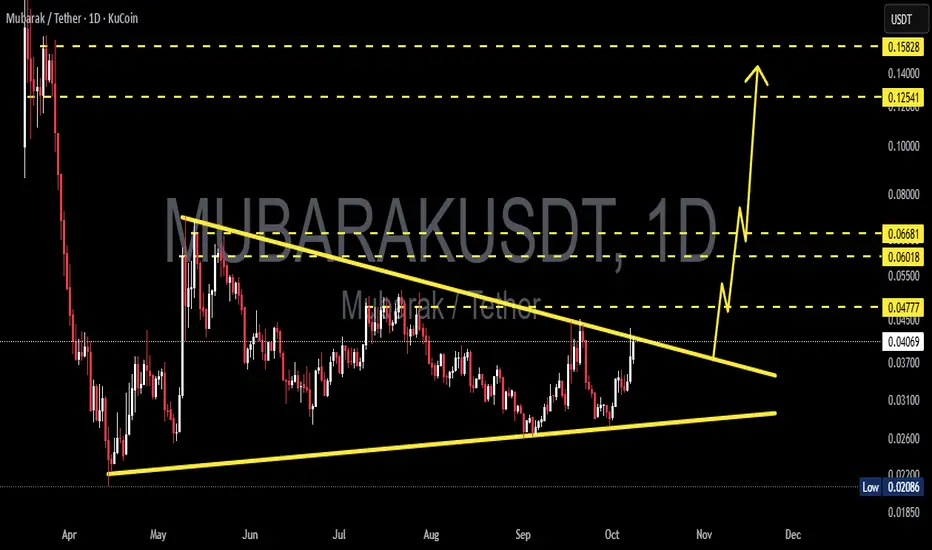
MUBARAKUSDT — On the Edge of an Explosive Move: Bullish BreakoutThe MUBARAK/USDT pair is approaching a crucial moment as price action compresses inside a Symmetrical Triangle, signaling the market’s tension before a major breakout.
Whenever price reaches the apex of a pattern like this, it often precedes a sharp expansion in volatility — a make-or-break moment for traders.
---
🔶 Pattern Overview & Technical Structure
The Symmetrical Triangle represents a battle of equilibrium between buyers and sellers:
The descending upper trendline keeps pushing lower highs.
The ascending lower trendline protects higher lows.
As both lines converge, energy builds up within the pattern — usually leading to an explosive breakout once one side wins.
Declining volume supports this setup, hinting that a big move is imminent.
---
💹 Key Technical Levels
Current Price: around 0.04050 USDT
Main Resistance: 0.04777 → 0.06018 → 0.06681
Dynamic Support: 0.03100 → 0.02600
Major Support: 0.02086 (historical low)
If a confirmed breakout occurs, the measured move projection from this triangle points toward a potential upside target near 0.086, depending on follow-through and volume confirmation.
---
🚀 Bullish Scenario (Upside Breakout)
Confirmation: A daily candle close above the descending trendline with strong volume.
Continuation: Retest of the breakout zone that turns former resistance into new support.
Upside Targets:
TP1 → 0.04777 (initial resistance)
TP2 → 0.060–0.0668 (supply zone)
TP3 → around 0.086 (measured move projection)
Momentum catalysts — such as surging volume or renewed altcoin rotation — could accelerate this breakout move.
---
⚠️ Bearish Scenario (Rejection / Breakdown)
Confirmation: Strong rejection at upper trendline with long wick and close back below resistance.
Breakdown Trigger: Daily close below the ascending trendline with increasing sell volume.
Downside Targets:
0.026–0.031 (dynamic support zone)
Below that → retest of 0.02086 (historical demand level)
Failure to hold support could spark panic selling, especially given MUBARAK’s relatively low liquidity profile.
---
📊 Momentum Checklist
Watch closely for:
Volume spikes → true breakout confirmation.
Daily close above 0.04777 → bullish validation.
Daily close below 0.03100 → bearish confirmation.
Avoid reacting to intraday wicks — focus on daily candle closes for real signals.
---
🧭 Conclusion & Technical Bias
MUBARAK is standing at a critical compression point — the calm before the storm.
A confirmed breakout could open the path toward 0.06–0.086, while rejection at the trendline risks sending price back below 0.03.
Volume and daily close confirmation will determine whether bulls or bears take control next.
---
#MUBARAK #MUBARAKUSDT #CryptoBreakout #TrianglePattern #TechnicalAnalysis #Altcoin #KuCoin #CryptoTrading #SymmetricalTriangle #ChartAnalysis
$300 Solana Inevitable!Nice rejection on Solana. Now lets see if we will get the move to the downside for a nice long trade to target $300.
Calculate Your Risk/Reward so you don't lose more than 1% of your account per trade.
Every day the charts provide new information. You have to adjust or get REKT.
Love it or hate it, hit that thumbs up and share your thoughts below!
This is not financial advice. This is for educational purposes only.
