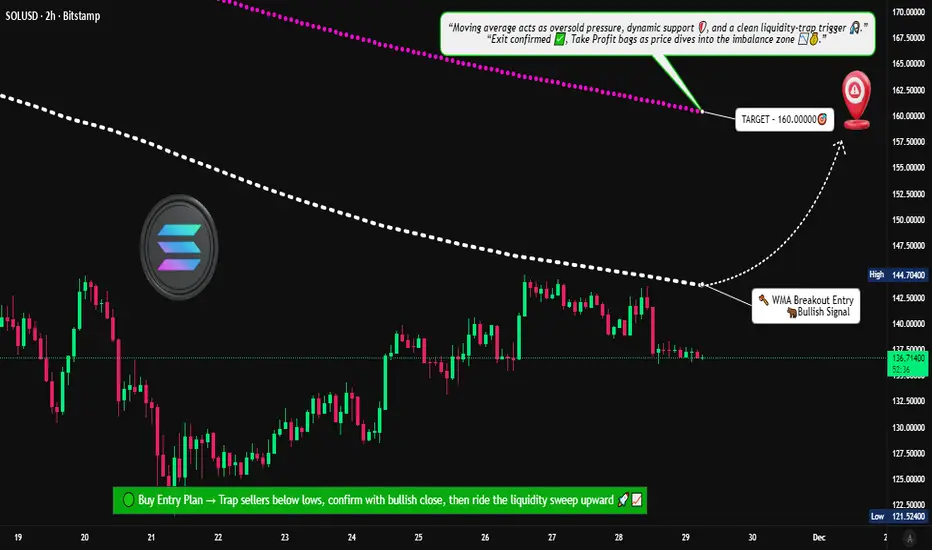
Is Solana Preparing for a New Upside Wave After WMA Breakout?📊 SOL/USD – “SOLANA VS U.S Dollar” Crypto Market Opportunity Blueprint (Swing Trade)
🟢 Trade Plan Overview
The bullish structure is confirmed after Weighted Moving Average (WMA) dynamic support breakout, signalling fresh momentum entering the market. This setup favors continuation as long as SOL holds above the breakout zone.
📌 Entry Zone
➡️ Entry: Any price level after the WMA breakout above 145.00000
The breakout + retest combination is your strongest confirmation. Let the chart validate the move—no rush entries.
🛡️ Stop Loss (Risk Protection)
➡️ Suggested SL: 132.50000
Dear Ladies & Gentlemen (Thief OG’s):
Use this SL only as a reference. Adjust based on your personal execution style, risk tolerance, and position size.
Place SL only after breakout confirmation — not before.
🎯 Profit Target
➡️ Target: 160.00000
Weighted moving averages are acting as dynamic resistance, and indicators show signs of potential overbought traps, so secure profits early instead of overstaying.
Dear Ladies & Gentlemen (Thief OG’s):
TP is your own choice. Lock in profits based on your comfort, not just my blueprint.
📚 Market Reasoning
WMA breakout shows renewed bullish strength.
Structure support aligned with higher-timeframe trend.
Volume expansion confirms buyers stepping in.
Resistance cluster around 160 remains the key zone to offload profits.
🔎 Related Pairs to Watch (Correlation & Key Notes)
💠 BITSTAMP:BTCUSD (Bitcoin)
High correlation with total crypto liquidity.
Strong BTC breakouts often pull SOL upward because altcoins follow BTC’s macro flow.
If BTC loses trend support, SOL setups weaken.
💠 BITSTAMP:ETHUSD (Ethereum)
ETH and SOL share similar Layer-1 ecosystem flows.
When ETH rallies aggressively, funds rotate into strong alts like SOL.
Good to use as a sentiment confirmation tool.
💠 COINBASE:ADAUSD (Cardano)
Another L1 competitor; correlated during broad alt-season pushes.
When ADA moves, retail interest usually spreads across L1s — including SOL.
💠 COINBASE:AVAXUSD (Avalanche)
Solana + Avalanche often move together during risk-on bursts.
AVAX momentum adds conviction to SOL’s breakout reliability.
💠 BINANCE:SOLBTC
The most important relative strength pair for SOL.
If SOLBTC is trending upward, SOL outperforms majors — huge confirmation signal for swing trades.
📈 Final Thoughts
This trade plan balances momentum, trend structure, and dynamic WMA confirmation. Follow the breakout logic, respect your risk, and let the chart guide your exits. The idea is designed to help traders act with clarity, control, and professional-level precision.
Solanaanalysis
#SOL/USDT IS AT DECISIVE POINT! WHO WILL WIN? BULLS OR BEARS?SOL/USDT – Daily Outlook
SOL is attempting a trend shift after forming a higher low near the lower boundary of the descending channel. Price has bounced with strength and is now trading above the short-term moving averages.
The 13 EMA (green) is leading the move and has crossed above the 21 EMA (blue), which typically signals improving momentum and short-term trend reversal. As long as price holds above these EMAs, bulls remain in control.
🔑 Major Resistance Zone:
$155–158 → a strong resistance cluster formed by prior support-turned-resistance and EMA congestion.
📈 Bullish Scenario:
A daily close above $158 would confirm a breakout and trend continuation, opening the path toward $175–180, followed by $ 190 or higher if momentum sustains.
⚠️ Risk / Invalidation:
Rejection from $155–158 may lead to short-term consolidation or a pullback toward $133 to 127.
Overall, the structure is constructive, momentum is improving, and $158 remains the key trigger level for the next leg higher.
If you like this chart, do hit the like button and share your views in the comments.
Thank you
#PEACE

SOLANA OBAMA - pamp itSOLANA OBAMA - pamp it
levels to watch for in case we are just being bull trapped
basically ; if the price action ledges out here and then pukes ,, well ya know whats up and wait for red fractal tripple bottom to try to buy again with tight stop. but those two negative options suck pretty bad, would be a multi year bear again. just accumulate btc if thats the case as we've seen the obvious change in the ALT market.
or
valhalla awaits us. and the whole 'alt season is dead' trap was sprung very well.
this cycle has been hard. gl

SOL BTC - finally?? looks somewhat convincing @@SOL BTC - finally?? looks somewhat convincing @@
*insert jack nicholson meme
yes yes
cmon you pos
SOL PLAYS: MET, PUMP, RAY, ORCA
*sort defilama sol protocols by highest yearly revenue
shovels and all that

SOL BTC - finally?? looks somewhat convincing @@SOL BTC - finally?? looks somewhat convincing @@
lets see. looking kinda good though.
SOL RAY ORCA maybe JUP?
lfg surprise alt run after pretty good smashing there.
gl

Solana - Massive Inverse Head And ShouldersIt´s hard not to be bullish right now. ETH and SOL is making the same massive IHS. Could´t be more bullish. Im buying Sharplink and Sol Strategies .

Solana: Edging HigherSOL has edged slightly higher, but remains well within our green Target Zone ($155.80 – $113.20). If it hasn’t already, the altcoin is expected to establish the low for wave ii in orange within this range before turning higher. The subsequent wave iii in orange should then drive price above the resistance levels at $249.68 and $295.31.

SOLANA: Wave energy on the brink of a new movementSOLANA: Wave energy on the brink of a new movement
SOLANA Wave Overview (D1 and H4)
As a trader who has been practicing wave analysis for over ten years, I note that the current Solana structure demonstrates the completion of an extended corrective formation and the potential for a new impulse to emerge.
Chart D1: The global picture indicates that the market is completing a sideways phase. The wave structure appears to be the end of a corrective sequence, which serves as the foundation for the next trend move.
Chart H4: Local dynamics confirm the formation of key entry points. Here, the first signs of an emerging impulse are visible, which could mark the beginning of a larger wave.
Main Scenario
After the completion of the corrective phase, a descending impulse sequence is expected to develop. This movement will be accompanied by increased seller activity and a gradual shift in priority to the downside.
Alternative Scenario
If the price holds above recent highs and forms a stable upward impulse structure, the priority will shift to continued growth. In this case, the correction will be considered incomplete, and Solana may show an additional rebound.
Trading Idea
Conservative approach: wait for confirmation of a breakout of key levels and enter with the trend.
Aggressive approach: use local impulses on H4 for earlier entries, but with tight stops.
In both cases, it is important to maintain strict risk management and adjust the plan as new impulses emerge.
Results
Solana is at the transition point between a correction and a new impulse. The wave structure on D1 and H4 provides clear guidelines for action: watch for confirmation of the scenario and act with discipline.

New Court Case DISASTEROUS for SOLANA?Quite silently, Solana may be heading into one of the most consequential legal challenges it has faced to date.
The implications reach far beyond short-term market of SOL -it will likely affect MANY more crypto's and projects.
A US federal judge has recently (past few days) approved a class action lawsuit to proceed against several parties tied to the Solana ecosystem, including Solana Labs and entities connected to PumpFun. This isn’t speculative rumors; the court has ruled that the claims presented are substantial enough to warrant deeper examination.
The argument of the case is an allegation that cuts directly into Solana’s technical design. Plaintiffs argue that certain insiders benefited from preferential access created by the network’s validator structure and transaction-ordering mechanisms. In practice, this allegedly allowed privileged actors to enter positions earlier, exit faster, and systematically offload risk onto retail participants.
The court’s decision suggests regulators and judges are increasingly willing to scrutinize not just token issuers or apps, but the underlying blockchain infrastructure itself when assessing fairness and market access. Therefore, it could be consequential for the rest of the crypto market as well in the near to long term.
That framing introduces a serious existential risk.

Solana (SOL/USD) — Weekly Neckline Test + Ecosystem ContextTimeframe: Weekly
Bias: Long-term bullish / Short-term neutral
COINBASE:SOLUSD Solana is currently trading directly on the weekly head-and-shoulders neckline (~$120–130) following a strong multi-year expansion and a clear 2025 distribution phase.
This area represents a major inflection zone:
Structural neckline support
Long-term trend support
Prior high-volume demand from earlier in the cycle
Technical Scenarios
Bullish Hold
If this zone holds on a weekly closing basis, SOL can base and attempt a reclaim toward $150–180
Acceptance above that range would invalidate the right shoulder and favor longer-term continuation
Bearish Breakdown
Failure to hold near current levels increases the probability of a retest of prior lows, with $100–90 as the next major demand zone
At this stage, price is compressing, not confirming. Weekly closes matter more than intraday volatility.
Ecosystem Perspective (Why SOL Still Matters Long Term)
Beyond the chart, Solana continues to differentiate itself as a high-throughput, low-friction execution layer for real-world and consumer-facing applications.
Key strengths:
Fast finality and low fees enable non-financial, utility-driven use cases
Growing density of consumer apps, tooling, and on-chain UX
Strong builder activity despite volatility in price
Increasing focus on real-world alignment, not just speculative DeFi
The long-term value of SOL is increasingly tied to application depth and ecosystem stickiness, not short-term price momentum.
I’m personally bullish long term and building on Solana through a real-world–anchored ecosystem that uses on-chain incentives to support off-chain infrastructure, compliance, and maintenance workflows. This type of usage benefits from durable chains with low overhead and strong composability, which is where Solana continues to excel.
Final Take
COINBASE:SOLUSD is at a macro decision level
This is not a prediction zone, it’s a confirmation zone
Long-term thesis remains intact as long as higher-timeframe support is respected
Watching weekly closes for direction
Not financial advice. High-risk asset.

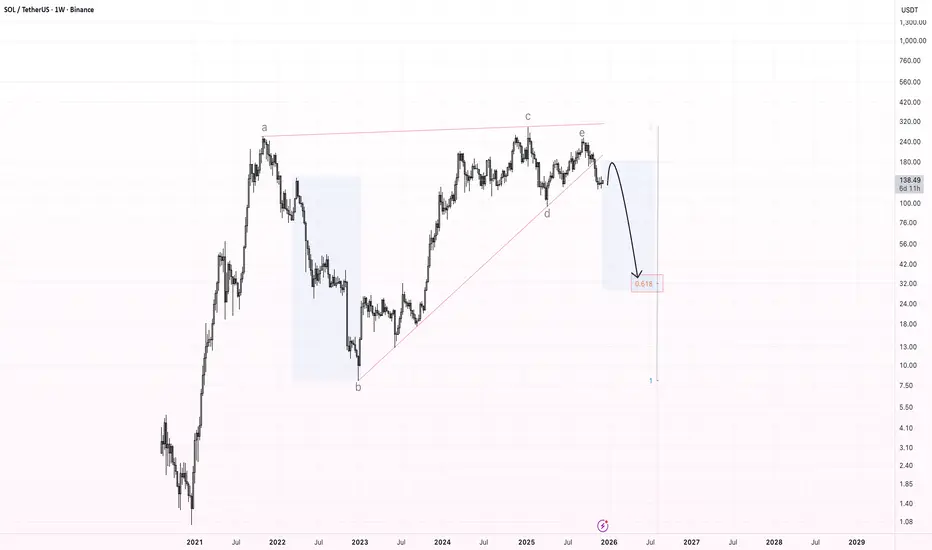
SOL – Bearish Rising Wedge Breakdown (Weekly Chart)The chart shows a large multi-year bearish rising wedge , which has now been broken to the downside. This wedge has been forming since the 2022 bottom and consists of clear wave structure (a–b–c–d–e), with the final wave e rejecting at the upper boundary and triggering the breakdown.
After this kind of pattern, the market often provides a relief bounce back into the broken support , which should now act as resistance . For SOL, the expected retest zone is located around $170–$190.
If price confirms resistance there, I expect the beginning of a larger downward wave , targeting the main Fibonacci zone near the 0.618 retracement, which aligns with a long-term target around $30–$40.
This zone marks the primary downside target for a full wedge breakdown.
Key Points:
Multi-year bearish rising wedge has broken.
Expected retest: $170–$190.
Major downside target: $30–$40 (0.618 zone).
Potential start of a macro corrective wave.
$SOL/USDT ANALYSISOn the 2-hour SOL/USDT chart, price action is clearly moving inside a descending channel, showing sustained bearish control. The last strong impulse leg pushed price lower and that move has not been meaningfully recovered, which keeps the directional lean to the downside. Structurally, the market has already shifted bearish with lower highs and lower lows, and every bounce has been capped below prior supply. The Ichimoku Cloud is above price and acting as resistance, reinforcing weak flow tone. Recent candles show price reacting near the lower boundary of the channel, which marks a short-term reaction area, but there is no confirmed bullish shift yet. From a price-action perspective, prior bullish order blocks have been invalidated, while bearish order blocks overhead remain respected. Liquidity has been swept on the downside recently, followed by only a shallow reaction, which suggests absorption rather than reversal. There is also visible inefficiency from the last drop that has not been filled, keeping downside pressure active. Overall, the local market structure remains bearish, momentum is weak, and flow is still aligned with continuation rather than reversal until a clear structure change occurs on this timeframe.

Solana (SOL): towards $117?Hi!
SOL remains in a clear descending channel, indicating sustained bearish momentum. After a period of consolidation within the rectangular range, the price recently rejected the upper boundary, forming a potential continuation pattern. The RSI sits near 40, signaling slight oversold conditions but no strong reversal yet. Price action suggests a likely retest of the channel’s lower boundary near $117.48, aligning with the support zone highlighted. Traders should watch for confirmation of a bounce at this level or continuation lower. Short-term pullbacks may occur, but the dominant trend remains bearish.
Conclusion: Trend-following strategy favored; bearish continuation likely, $117 support key.

Solana Fakeout: Bulls Caught, Bears in ControlMarket Context
In my previous publication about Solana, I clearly defined an Invalidation Level for the bearish setup. Price has now swept buy-side liquidity above that level, forming a false breakout with strong rejection.
This move appears to be a stop hunt, not genuine acceptance above resistance.
Structure & Intent
The long bullish candle above the invalidation level failed to hold, signaling lack of follow-through and confirming distribution at premium prices.
This behavior reinforces the expectation of further downside expansion.
Scenarios Recap
Previously, two downside scenarios were outlined:
• Scenario 1 : mitigation toward 116–118, followed by potential stabilization
• Scenario 2 : continuation toward 108 and below
The recent liquidity grab confirms Scenario 2 activation.
Execution Plan
📉 Bias: Bearish
🎯 Primary Target: 106
🧲 Intermediate liquidity: 116
❌ Invalidation : 129.4
Any acceptance or touch above this level invalidates the bearish thesis and opens the door for bullish continuation.
Conclusion
As long as price remains below the invalidation zone, Solana is expected to expand lower in search of sell-side liquidity.

Solana vs USD – Bearish Playbook High-Probability Swing Setup🔹 Asset: SOL/USD – “SOLANA VS U.S. DOLLAR”
🔹 Trade Style: Crypto Market Opportunity Blueprint (Swing Trade)
🔻 Plan: Bearish Plan
📍 Entry Zone
You can enter at any price level according to your strategy and confirmation signals.
🛑 Stop Loss (SL)
This is Thief SL → @ 152.50
Dear Ladies & Gentleman (Thief OG’s), adjust your SL based on your own strategy & risk levels.
🔔 Important:
Place SL only after breakout confirmation.
I am not recommending to use only my SL. It’s your choice — you make money, you take money at your own risk.
🎯 Target (TP)
Market has strong support + oversold conditions + potential trap zones, so kindly exit with profits.
Our Target → @ 125.00
🔔 Important:
Dear Ladies & Gentleman (Thief OG’s), I am not recommending to use only my TP.
It’s your choice — you make money, you take money at your own risk.
📊 Related Pairs to Watch (Correlation Guide)
1️⃣ BITSTAMP:BTCUSD – Bitcoin
King of crypto; SOL often follows BTC’s direction.
If BTC breaks down, SOL bearish continuation becomes stronger.
2️⃣ BITSTAMP:ETHUSD – Ethereum
High correlation with major altcoins.
ETH weakness usually signals pressure on L1 chains like SOL.
3️⃣ COINBASE:AVAXUSD – Avalanche
Competitor L1 chain; often moves in similar sentiment flow.
If AVAX also shows bearish structure → confirms broad L1 weakness.
4️⃣ COINBASE:LTCUSD – Litecoin
Old major coin; used for risk-on/risk-off sentiment checks.
If LTC dumps → market-wide bearish confirmation.
5️⃣ CRYPTOCAP:TOTAL2 – Altcoin Market Cap
Measures overall altcoin health.
If TOTAL2 breaks its support → SOL likely accelerates toward bearish target.
🔍 Why These Pairs Matter? (Key Correlation Points)
BTC sets the tone – SOL follows the major trend 75–85% of the time.
ETH determines altcoin liquidity – if ETH dominance rises, SOL loses capital flow.
AVAX acts as sector correlation – L1 competitors weaken together during bearish cycles.
TOTAL2 confirms broad alt weakness, making SOL’s downside more reliable.

SOL/USDT Update — Bullish Trend Structure and Resistance Ahead“🚨 Solana vs Tether: Bullish Heist on SOL/USDT 💰”
📊 Description
Market: SOL/USDT
Bias: Bullish (Swing / Day Trade)
✅ Trade Plan
Entry: 🎯 Any good support / demand area — stay alert & flexible.
Stop Loss: 🛡️ “Thief SL” @ 160.00 USDT — this is my SL, not yours. Manage your own risk!
Targets (TP):
• 🎯 Target 1: 215.00 USDT
• 🏁 Target 2: 240.00 USDT
⚠️ Heads up: Use your discretion. Do not blindly follow my SL/TP — trade responsibly, at your own risk.
🔍 Key Insights / Logic
🚧 Expect resistance & traps near 215–240 — don’t get stuck in overbought zones.
📈 Momentum is building; structure is favorable on retests.
🔊 Watch volume on impulsive moves — rising volume = strength.
🔄 Related pairs / correlation watch:
• BINANCE:SOLBTC — strength vs BTC strengthens the bullish case.
• BINANCE:ETHUSDT — altcoin momentum may carry SOL upward.
• BINANCE:BNBUSDT — BNB strength can support ecosystem flow.
✨ “If you find value in my analysis, a 👍 and 🚀 boost is much appreciated — it helps me share more setups with the community!”
#SOL #SOLUSDT #Solana #CryptoSwing #CryptoDayTrade #AltcoinAnalysis #TradingViewIdeas #CryptoFun

My trading plan is SOL.I will be buying Solana in this price range, aiming to reach $146.
Remember that today is FOMC day, so expect high volatility! Follow your risk management strategy and make your own decisions.
SOLANA – Key Support Retest, Watching HTF Structure CloselySOL is interacting with one of the most important HTF zones on the chart — the multi-year support level that has repeatedly defined trend transitions. This zone has served as structural support during expansion phases, a breakout base during the run toward all-time highs, and later as a liquidity pool during corrective cycles. Every major deviation from this line has led to a significant move in the opposite direction, making this retest highly meaningful.
Earlier in the chart, support broke and produced a full liquidity sweep, clearing long-position stop clusters before price reclaimed the level and initiated a multi-month advance. The presence of an order block just above this zone adds additional structure: it acted as a redistribution area during the breakdown, and later as the origin of re-accumulation. The recent taps into this region suggest the market is again probing for resting liquidity and responsive buy orders.
Price is now compressing between HTF support and declining 50/100 EMAs, creating a classic higher-timeframe squeeze. EMAs continue to slope downward, signaling a bearish macro trend, but candles remain supported at the long-term horizontal level. This type of compression typically resolves with a decisive expansion once liquidity is absorbed from one side.
The FVG Reaction Zone earlier in the trend shows how SOL tends to return to inefficiencies before choosing direction. The current circled region may represent the same behavior on a larger scale — an attempt to rebalance price before either reclaiming the EMAs or continuing displacement lower.
Momentum indicators add another layer: Stoch RSI is turning upward from deeply oversold territory, suggesting momentum exhaustion on the downside but not yet confirming a trend reversal. Historically on this timeframe, these rotations have preceded multi-week expansions when aligned with structural reclaim, but have also failed when EMAs continued to reject price.
Overall, SOL is positioned at a pivotal HTF decision point:
Hold support → potential base formation and EMA reclaim attempts
Lose support → opens the door to a fresh liquidity sweep into prior structural lows
Until a break in structure or EMA reclaim occurs, this remains a compression zone with elevated importance for trend continuation or reversal.

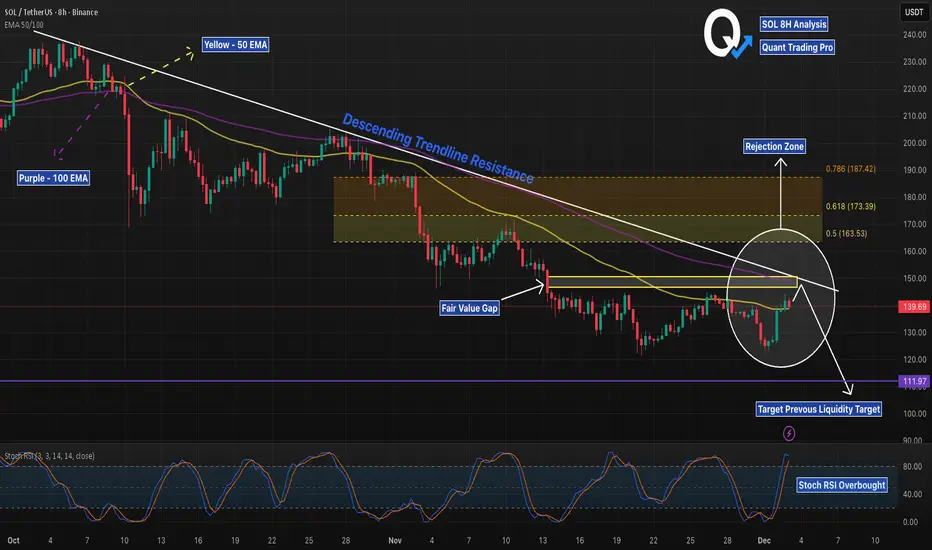
SOL 8H – FVG + EMA Rejection, Liquidity Next?SOL has tapped a clean multi-confluence rejection zone: the descending trendline, the 50/100 EMA cluster, and a filled Fair Value Gap all stack at the same price level. This area has acted as a strong pivot throughout November, and today’s reaction is consistent with prior trendline rejections.
The Stoch RSI is already in overbought territory on the 8H, adding momentum exhaustion to the setup. Bears will watch for continuation toward the major liquidity level around $111.97, which remains untested below.
For bulls to regain control, price must break and hold above the EMA cluster and FVG, flipping the trendline into support. Until then, the path of least resistance remains down toward liquidity.
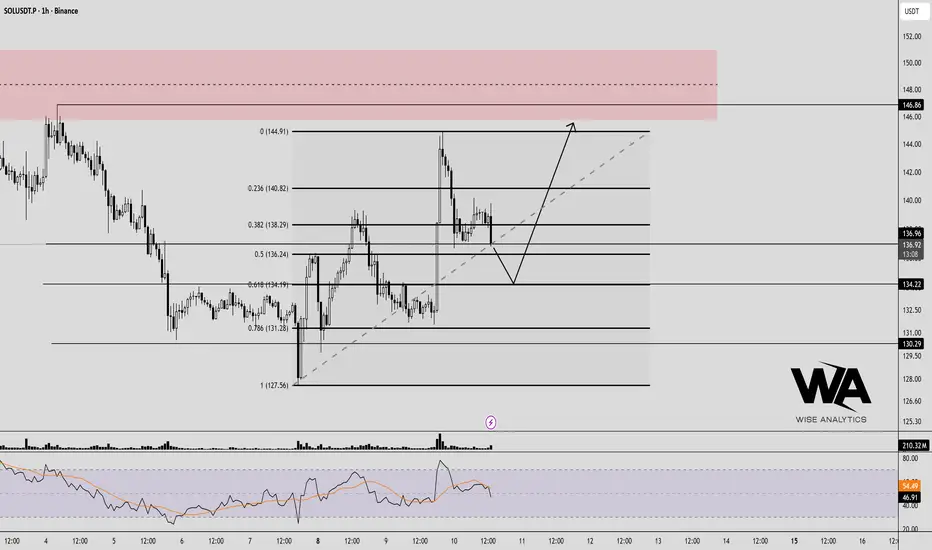
$SOL/USDT ANALYSISOn the **1-day chart**, BINANCE:SOLUSDT is currently rebounding strongly from a well-defined horizontal support zone around **$131–$137**, which has acted as a major demand area multiple times in the past. Buyers stepped in again from this zone with rising volume, showing accumulation interest after an extended downtrend. The price has now pushed back above the short-term daily lows and is testing the descending trendline drawn from the November swing highs, indicating that the market is trying to shift momentum.
The candlesticks are forming higher lows while rejecting deeper downside, suggesting short-term strength. However, the overall structure still remains under the broader bearish trendline and below the daily Ichimoku cloud, so this recovery phase will only confirm a reversal if SOL manages a **daily close above $150–$155**, which would break the trendline resistance and open room toward $170 and $190. If the price fails to close above the trendline and faces rejection near $145–$150, it may retest the $135–$131 support zone again.
In short, SOL is currently in a **corrective bullish bounce within a larger downtrend**, holding key support and attempting to break structure. A sustained breakout and close above $150 will mark a possible shift to medium-term bullish momentum, while failure to do so keeps it in a consolidating range between $131 and $150.

SOLANA: Wave Energy on the Threshold of ImpulseSOLANA: Wave Energy on the Threshold of Impulse
Based on the current wave structure, Solana is completing its corrective phase and preparing to form a new movement. The chart shows a transition from sideways momentum to a more pronounced impulse, which could set the direction for the near term.
Primary scenario: After the correction ends, a downward impulse sequence is expected to develop. Alternative scenario: If the market consolidates above recent highs, it could continue to rise, delaying the start of a new downward wave.
Idea for traders: Watch for confirmation of the structure on lower timeframes and enter only after clear reversal signals appear.
Risk management: Use clear stop levels and adjust your plan as new impulses emerge.
Friends, more wave analysis is available in our profile.
Subscribe to stay up to date with wave analysis!
Solana: Is the Bottom In, or More Downside Ahead?SOL has already climbed more than 15% from last Friday’s low at its peak, potentially signaling the completion of wave ii in orange. For now, however, we’re still keeping open the possibility that this move could dip to a new low—within our green Target Zone ($155.80–$113.20). In any case, once this interim correction wraps up, wave iii in orange should kick off an impulsive rally, only losing steam above resistance at $295.31.

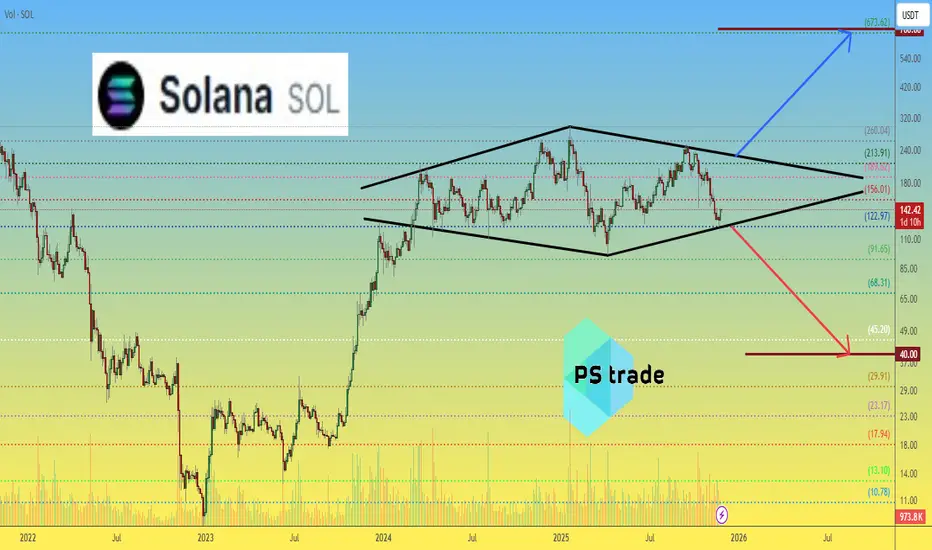
Solana SOL price analysisA notable long-term structure is developing on the OKX:SOLUSDT chart — a 1.5-year consolidation resembling a broad “diamond” formation.
Such structures in classical technical analysis often appear near the end of distribution phases and may precede a deeper downside continuation.
From this perspective, a potential move toward the $40 region cannot be excluded.
At the same time, market data presents a contrasting signal:
• #Solana ETF remains one of the few crypto-related instruments consistently showing positive daily inflows
• Both CRYPTOCAP:BTC and CRYPTOCAP:ETH ETFs have not demonstrated the same level of capital interest
• This suggests that institutional positioning around CRYPTOCAP:SOL may be slowly increasing
If capital inflows persist, higher-timeframe upside scenarios — even toward the $700 region — could remain on the table in the broader macrotrend.
What scenario do you find more probable at this stage: deeper correction or long-term continuation?
______________
◆ Follow us ❤️ for daily crypto insights & updates!
🚀 Don’t miss out on important market moves
🧠 DYOR | This is not financial advice, just thinking out loud