SOLANA – Key Support Retest, Watching HTF Structure CloselySOL is interacting with one of the most important HTF zones on the chart — the multi-year support level that has repeatedly defined trend transitions. This zone has served as structural support during expansion phases, a breakout base during the run toward all-time highs, and later as a liquidity pool during corrective cycles. Every major deviation from this line has led to a significant move in the opposite direction, making this retest highly meaningful.
Earlier in the chart, support broke and produced a full liquidity sweep, clearing long-position stop clusters before price reclaimed the level and initiated a multi-month advance. The presence of an order block just above this zone adds additional structure: it acted as a redistribution area during the breakdown, and later as the origin of re-accumulation. The recent taps into this region suggest the market is again probing for resting liquidity and responsive buy orders.
Price is now compressing between HTF support and declining 50/100 EMAs, creating a classic higher-timeframe squeeze. EMAs continue to slope downward, signaling a bearish macro trend, but candles remain supported at the long-term horizontal level. This type of compression typically resolves with a decisive expansion once liquidity is absorbed from one side.
The FVG Reaction Zone earlier in the trend shows how SOL tends to return to inefficiencies before choosing direction. The current circled region may represent the same behavior on a larger scale — an attempt to rebalance price before either reclaiming the EMAs or continuing displacement lower.
Momentum indicators add another layer: Stoch RSI is turning upward from deeply oversold territory, suggesting momentum exhaustion on the downside but not yet confirming a trend reversal. Historically on this timeframe, these rotations have preceded multi-week expansions when aligned with structural reclaim, but have also failed when EMAs continued to reject price.
Overall, SOL is positioned at a pivotal HTF decision point:
Hold support → potential base formation and EMA reclaim attempts
Lose support → opens the door to a fresh liquidity sweep into prior structural lows
Until a break in structure or EMA reclaim occurs, this remains a compression zone with elevated importance for trend continuation or reversal.
Solanaanalysis

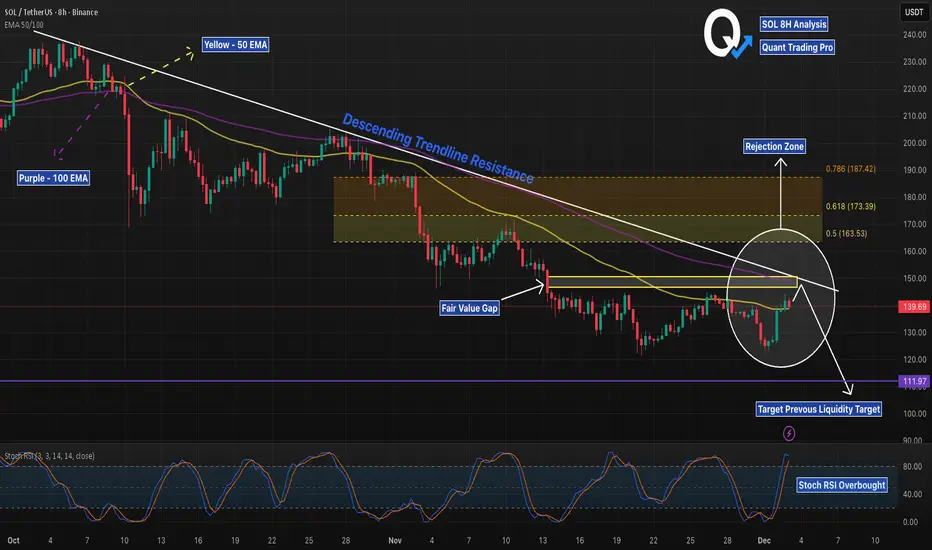
SOL 8H – FVG + EMA Rejection, Liquidity Next?SOL has tapped a clean multi-confluence rejection zone: the descending trendline, the 50/100 EMA cluster, and a filled Fair Value Gap all stack at the same price level. This area has acted as a strong pivot throughout November, and today’s reaction is consistent with prior trendline rejections.
The Stoch RSI is already in overbought territory on the 8H, adding momentum exhaustion to the setup. Bears will watch for continuation toward the major liquidity level around $111.97, which remains untested below.
For bulls to regain control, price must break and hold above the EMA cluster and FVG, flipping the trendline into support. Until then, the path of least resistance remains down toward liquidity.
$SOL/USDT ANALYSISOn the **1-day chart**, BINANCE:SOLUSDT is currently rebounding strongly from a well-defined horizontal support zone around **$131–$137**, which has acted as a major demand area multiple times in the past. Buyers stepped in again from this zone with rising volume, showing accumulation interest after an extended downtrend. The price has now pushed back above the short-term daily lows and is testing the descending trendline drawn from the November swing highs, indicating that the market is trying to shift momentum.
The candlesticks are forming higher lows while rejecting deeper downside, suggesting short-term strength. However, the overall structure still remains under the broader bearish trendline and below the daily Ichimoku cloud, so this recovery phase will only confirm a reversal if SOL manages a **daily close above $150–$155**, which would break the trendline resistance and open room toward $170 and $190. If the price fails to close above the trendline and faces rejection near $145–$150, it may retest the $135–$131 support zone again.
In short, SOL is currently in a **corrective bullish bounce within a larger downtrend**, holding key support and attempting to break structure. A sustained breakout and close above $150 will mark a possible shift to medium-term bullish momentum, while failure to do so keeps it in a consolidating range between $131 and $150.

SOLANA: Wave Energy on the Threshold of ImpulseSOLANA: Wave Energy on the Threshold of Impulse
Based on the current wave structure, Solana is completing its corrective phase and preparing to form a new movement. The chart shows a transition from sideways momentum to a more pronounced impulse, which could set the direction for the near term.
Primary scenario: After the correction ends, a downward impulse sequence is expected to develop. Alternative scenario: If the market consolidates above recent highs, it could continue to rise, delaying the start of a new downward wave.
Idea for traders: Watch for confirmation of the structure on lower timeframes and enter only after clear reversal signals appear.
Risk management: Use clear stop levels and adjust your plan as new impulses emerge.
Friends, more wave analysis is available in our profile.
Subscribe to stay up to date with wave analysis!
Solana: Is the Bottom In, or More Downside Ahead?SOL has already climbed more than 15% from last Friday’s low at its peak, potentially signaling the completion of wave ii in orange. For now, however, we’re still keeping open the possibility that this move could dip to a new low—within our green Target Zone ($155.80–$113.20). In any case, once this interim correction wraps up, wave iii in orange should kick off an impulsive rally, only losing steam above resistance at $295.31.

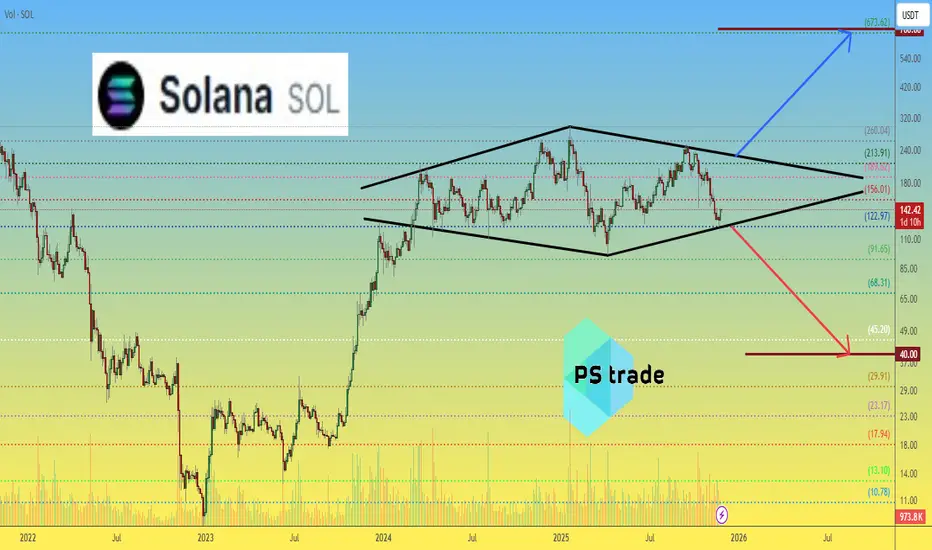
Solana SOL price analysisA notable long-term structure is developing on the OKX:SOLUSDT chart — a 1.5-year consolidation resembling a broad “diamond” formation.
Such structures in classical technical analysis often appear near the end of distribution phases and may precede a deeper downside continuation.
From this perspective, a potential move toward the $40 region cannot be excluded.
At the same time, market data presents a contrasting signal:
• #Solana ETF remains one of the few crypto-related instruments consistently showing positive daily inflows
• Both CRYPTOCAP:BTC and CRYPTOCAP:ETH ETFs have not demonstrated the same level of capital interest
• This suggests that institutional positioning around CRYPTOCAP:SOL may be slowly increasing
If capital inflows persist, higher-timeframe upside scenarios — even toward the $700 region — could remain on the table in the broader macrotrend.
What scenario do you find more probable at this stage: deeper correction or long-term continuation?
______________
◆ Follow us ❤️ for daily crypto insights & updates!
🚀 Don’t miss out on important market moves
🧠 DYOR | This is not financial advice, just thinking out loud
SOL UPDATE: My thoughts going into the Nov 28 2025 Weekend SOL is showing a solid reaction off the 125 support zone, which has been a major weekly level throughout this entire range.
As long as buyers defend this area, SOL can attempt a bounce back toward the mid-140s and potentially re-test the 170 region.
Still a choppy, range-bound structure overall, but this is the exact spot bulls needed to step in.
SOL/USDT: Strong Uptrend – Short-Term Buy Opportunity!We are witnessing an excellent opportunity on the SOL/USDT chart, as Solana (SOL) continues to maintain a strong upward trend. In the context of a gradually stabilizing cryptocurrency market and positive news about Solana's ecosystem development, SOL is entering a significant price increase phase.
Currently, SOL/USDT is trading within an ascending channel and has broken out of the 140.00 support zone . The price is fluctuating around 143.66, close to the 140.00 support, which could see a slight pullback before continuing the upward momentum.
The next target for SOL/USDT in the short term is 155.00, where it might encounter some resistance. However, if the price maintains above 140.00, there is a high probability that SOL could continue its strong upward momentum towards 156.00 and even beyond.
Trading Strategy:
Buy SOL around the 140.00–143.00 range, with a short-term target of 155.00 and 156.00.
Set stop-loss if the price breaks below 139.00, as this is a crucial support level within the current uptrend channel.
In conclusion, SOL/USDT is maintaining a solid uptrend, and with positive signals from both technical indicators and fundamental factors, buying around the support zone is a reasonable strategy to capitalize on the upward movement.

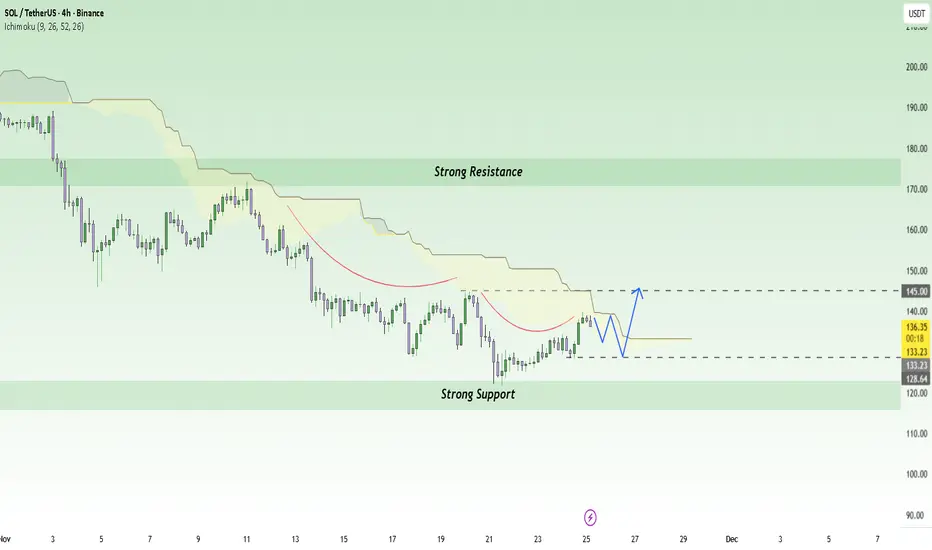
SOL/USDT: Growth Fueled by Inflows and Network ExpansionNews: The Solana spot ETF in the U.S. has seen a significant inflow of capital , with over $476 million USD coming in over 17 consecutive days. At the same time, the Solana network has reported strong revenue growth , reaching around $2.85 billion USD . These factors have bolstered investor confidence in Solana, creating a favorable environment for the upward trend of SOL/USDT.
Chart: On the H4 chart, SOL/USDT is currently trading within a strong uptrend channel , supported by the Ichimoku cloud at 133.23 USD. The price is in the support zone around 128 USD, and there is potential for a strong rebound if it continues to hold above this level. If SOL/USDT maintains this trend, the next target could be 145 USD, where there is strong resistance in the short term.
Outlook: With positive macro factors and a clear technical structure , SOL/USDT could continue its strong uptrend, aiming for the 145 USD resistance level in the near future, as long as the price stays above 128 USD.
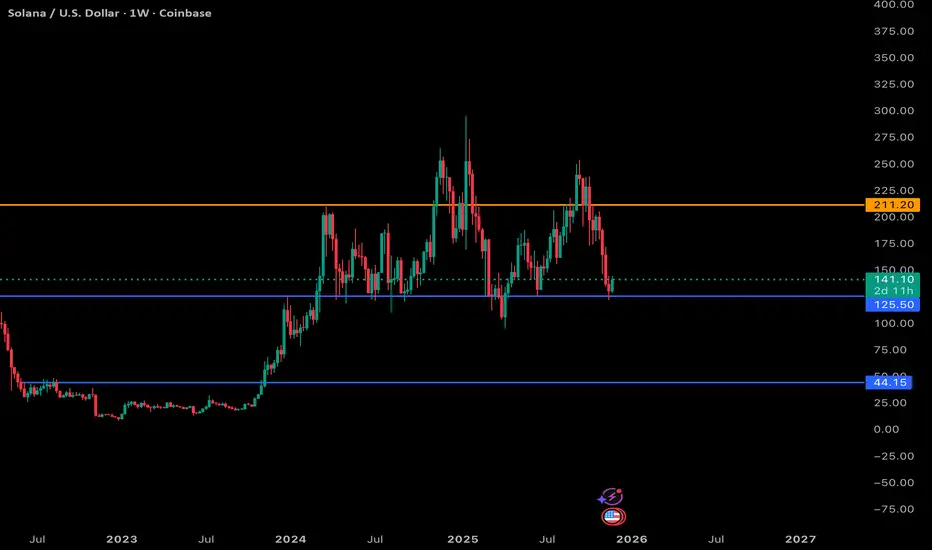
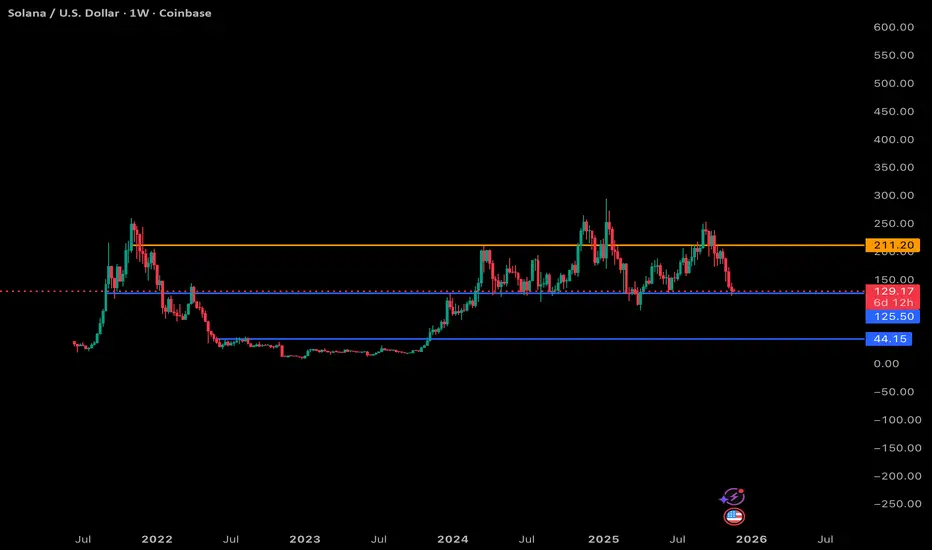
SOL 1W Breakdown: Key Levels, What I’m Watching Next Nov 24 2025Here’s my read on Solana’s weekly chart using the same structure as the BTC and ETH analyses.
Blue = support, orange = resistance, and the dotted mid-range is acting like a pivot zone.
Support Levels (Blue)
$125.50: This is the line SOL is sitting right on top of right now. It’s been a key mid-range level for almost two years. Losing this on the weekly would be a clear bearish signal because there isn’t much structural support underneath until the next major zone.
$44.15: This is the big, deep support from the 2022–2023 accumulation base. I’m not calling for this immediately, but structurally there’s a lot of empty space between $125 and $44. If the macro rolls over and SOL can’t defend the mid-range, we could see a slow bleed or capitulation wick toward this zone.
Resistance (Orange)
$211: This is the major weekly resistance for SOL and has been the top of every rally since 2022. Until SOL can close above this level and hold it, any upside is still just range movement.
My Current Thoughts
SOL is in a tricky spot. We’re sitting right on that $125ish support, and this is basically the “bounce here or things get uncomfortable fast” level.
If we don’t get a bounce:
The chart opens up a pretty big air pocket down to the next structural support.
Weekly structure turns decisively bearish.
SOL likely enters a multi-month corrective phase similar to what it did in 2022/2023 (but obviously not the same magnitude).
If we do bounce:
SOL can chop around this mid-range again, possibly retesting $150–175.
But it still needs a clean reclaim of $211 to resume a real macro uptrend.
Overall View
SOL’s weekly chart is way less forgiving than BTC or ETH right now. The range is clear, but we’re testing the bottom of it, and losing this level puts a lot of downside in play. From a structural standpoint, this is the most important support SOL has tested in a long time. If it holds, cool, if it breaks, we probably enter a much deeper reset.
Slow grind or big drop, the next weekly close is going to be telling.
SOLUSDT: Liquidity Tightens – Every Pullback Drops Even Deeper!When talking about Solana right now, the clearest feeling is that the market is losing strength day by day . Recent news shows that SOL has dropped sharply in November, and large capital keeps exiting the market — turning every bounce into an excuse for holders to sell rather than a sign of reversal.
On the H4 chart, SOL is trapped inside a descending wedge , repeatedly rejected by the Ichimoku cloud — an area that has consistently blocked every recovery attempt. Each previous bounce has only led to an even stronger downward leg.
The $130 level is the nearest immediate resistance and also aligns with the descending trendline. If price pulls back to this zone, there is a high probability of fresh selling pressure emerging. When that happens, SOL could continue dropping toward the psychological support at $100 — the key target in the current bearish outlook.
In summary, with both negative news and a weak technical structure, the most reasonable strategy now is to follow the downtrend , wait for price to pull back into resistance to find cleaner entries, and avoid catching bottoms when the market shows no clear reversal signals.

Solana: Room for moreSOL recently dipped further into the now green Target Zone between $155.80 and $113.20. Within this area, we expect the low of wave ii in orange to be established imminently. Afterward, we anticipate a strong wave iii rally, which should peak above resistance at $295.31.

Solana is still far from a bearish phase (3D)From the point where we placed the red arrow on the chart, a corrective phase has developed on Solana, and the buying pressure has been so strong that the corrections have established a new high. Currently, the decline we are experiencing is for Wave E.
All these fluctuations between the high and low are for re-accumulation, and Solana is targeting above $350.
We expect a price reversal from the green zone on higher timeframes, and this view will only be invalidated if a weekly candle closes below the invalidation level.
For risk management, please don't forget stop loss and capital management
When we reach the first target, save some profit and then change the stop to entry
Comment if you have any questions
Thank You

SOLUSDT: Sellers in Control – Downtrend Remains DominantSolana is falling right at the moment when the altcoin market is under the most pressure. This week, a series of negative developments have weighed heavily on sentiment: strong ETF outflows, risk-off behavior, and fading expectations of a Fed rate cut in December. All of this makes it difficult for SOL to form any sustainable recovery.
On the 4H chart, SOL is sliding within a clear descending channel and has repeatedly been rejected at the upper trendline. The 150 USD level is now acting as a short-term resistance — every touch is pushed back immediately, showing how weak the buying pressure is.
If SOL continues to fail to break above 150 USD, the most likely scenario is a move back down to the 140 USD (TP1) zone. And if market sentiment remains bearish, a deeper target lies around 130 USD (TP2) — where the channel bottom aligns with a previous demand zone.
With negative news flow, weakening liquidity, and a technical structure fully favoring the downside, the short-term trend of SOLUSDT remains in the hands of the sellers. Any bounce here is more likely to become an opportunity for short positions rather than a true reversal signal.

Solana – Daily Chart AnalysisSolana is currently holding around $140 after a sharp correction from the upper channel resistance. Price is testing a key ascending trendline and horizontal support zone near $135.
📉 RSI at 32.76 signals oversold conditions, watch for potential bullish reversal setups.
🔮 Possible Path Ahead (White Projection):
• Bounce to $180 → Consolidation
• Breakout toward $240
• Target zone: $280–$300 by mid-2026
(based on channel re-entry and momentum recovery)
❗If support fails, next major demand zone sits around $100–$110.
📊 Watching closely for confirmation of trend reversal.
Solana: Bears are in Full ControlFenzoFx—Solana is up by 3.30% today, after the sharp decline on November 25. The daily candle of this date is a bearish engulfing, meaning the sellers are in control of the $171.70. This level has the highest volume spike level as shown on the chart.
The immediate resistance is at $171.70. From a technical perspective, the downtrend will likely resume if the price holds below this level. In this scenario, the next bearish target could be the sell-side liquidity at $137.60, followed by $126.00.

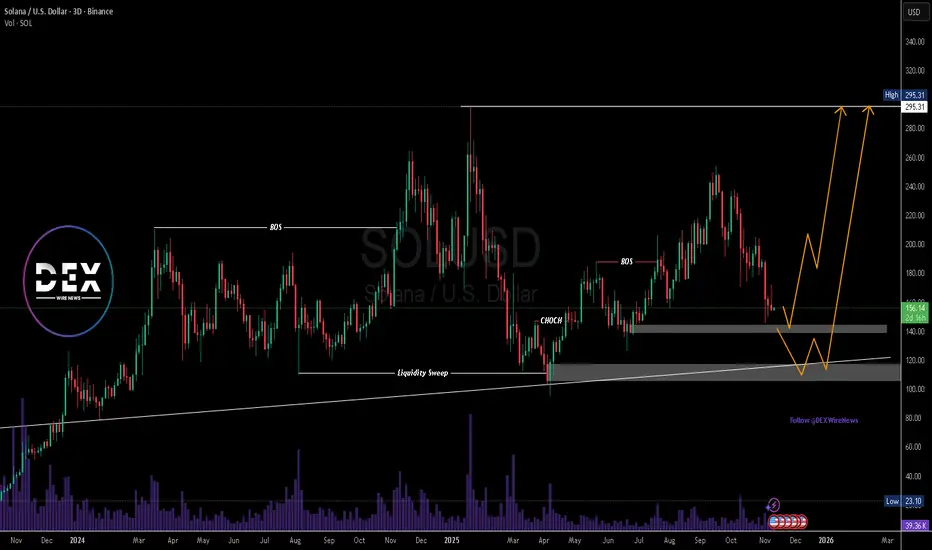
$SOLUSD Eyes Key Demand Zone Before Potential Macro BreakoutSolana (SOL/USD) is approaching a pivotal technical zone that could define its next major move. After an extended corrective leg from the $254 region, the price has retraced toward key demand areas, around $140, and around $120 where prior liquidity sweeps and structural reversals have historically emerged.
The chart reveals a repeating market behavior where Solana establishes a base within strong demand zones before launching decisive bullish impulses. An external structure Break of Structure (BOS) from previous swing highs, followed by an internal Change of Character (CHOCH) confirmation, after a retracement, suggests the broader bullish structure remains intact despite short-term weakness due to macro- economic challenges.
Should price hold the $120 range, a rebound toward the $295 previous highs appears probable. However, if sellers drive price lower, deeper liquidity could be collected near the $115–$120 region, aligning perfectly with the ascending trendline and long-term support base. This would likely create a high-probability accumulation phase before another impulsive leg higher.
Volume trends show healthy market participation during both expansions and pullbacks, reflecting consistent investor interest in Solana’s price action. Fundamentally, Solana’s growing adoption across DeFi, NFTs, and high-performance dApp ecosystems continues to strengthen the bullish bias.
A confirmed reversal from current levels could set the stage for a macro breakout toward the $295 zone, which represents a higher high of the external bullish structure and a psychological milestone for market participants.
In summary, Solana’s technical framework signals that the market is in a late-stage correction within a larger bullish cycle. A clean defense of the $140 zone would reinforce the bullish continuation narrative, while a brief dip into the $115 zone could form the final liquidity trap before another surge toward new highs
SOL Short SOL Short 📉
In the medium term, I am bearish.
Rebalancing the bearish inefficiency (POI) is likely to lead to continued aggressive markdowns, which can be used to open a short position.

SOLANA Pullback - DailyThis crypto coin has been bearish on the past few days, but it seems as it is a slight pullback towards the demand zone at 160 and 130, before it shoots upwards.
Let us wait and see if we can have a selling opportunities, aiming towards those zones.

SOLANA HIGH PROBABILITY SETUPS SOON!!!🚨 SOL HIGH PROBABILITY SELL/BUY SETUP 🚨
* Here We Can See Clearly The Next Potential Moves For SOLUSD Coming Hours/Days.
* Keep Your Eyes Close On Your Trading Positions.
* Happy PIP Hunting Traders.
FXKILLA.

SOLANA: The last wave before takeoff or a deep pullbackSOLANA: The last wave before takeoff or a deep pullback
📈 Weekly Scenarios
Bullish scenario: SOL holds above ~$190, breaks through ~$260.83 → start of uptrend → target ~$300+.
Consolidation: price trades between ~$190 and ~$260, wave structure not defined until breakout.
Bearish scenario: breakout of support at ~$190 with volume → likelihood of a significant correction to ~$150–$160.
✅ Conclusion
Solana is at a key decision point for the coming week:
The ~$260.83 level is a benchmark for a bullish resumption.
The ~$190 level is a critical support level.
A breakout upward will provide upward momentum; a breakout downwards is likely a pullback. Follow price reactions at the highlighted levels and confirmation of the wave structure before making trading decisions.

Bearish Pressure Builds Below $208FenzoFx—Solana's uptick momentum has been capped by the descending trendline, even though the price flipped above the $185.00 mark.
The daily chart shows long-wick bearish candles, indicating the selling pressure persists below the $208.00 resistance. From a technical perspective, the downtrend will likely resume if the price closes below the inverted fair value gap. In this scenario, SOLANA could decline toward the primary support at $172.00.
Please note that the bearish outlook should be invalidated if the price exceeds the $208.00 mark.

Solana Still ChillsSolana continues its correction phase. I am expecting a move toward 190 now
The invalidation zone for this scenario is marked on the chart
