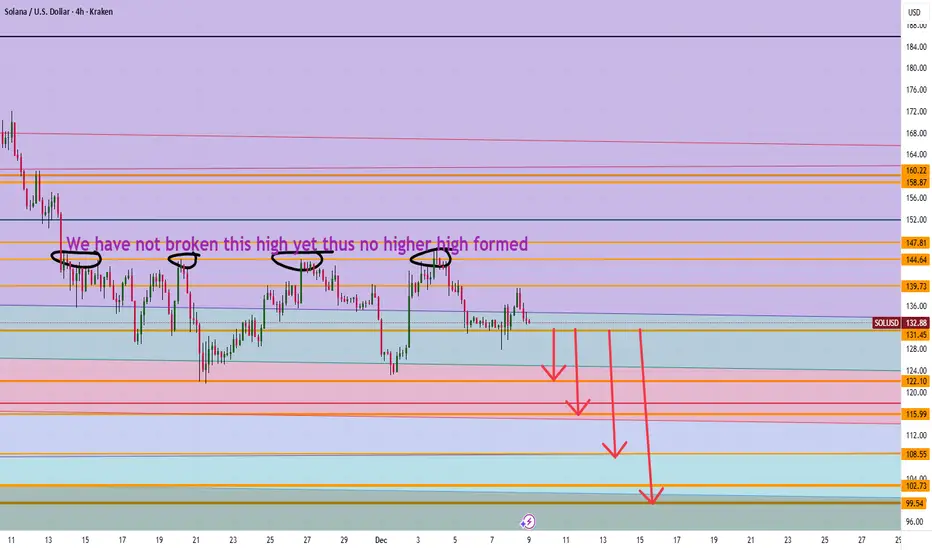
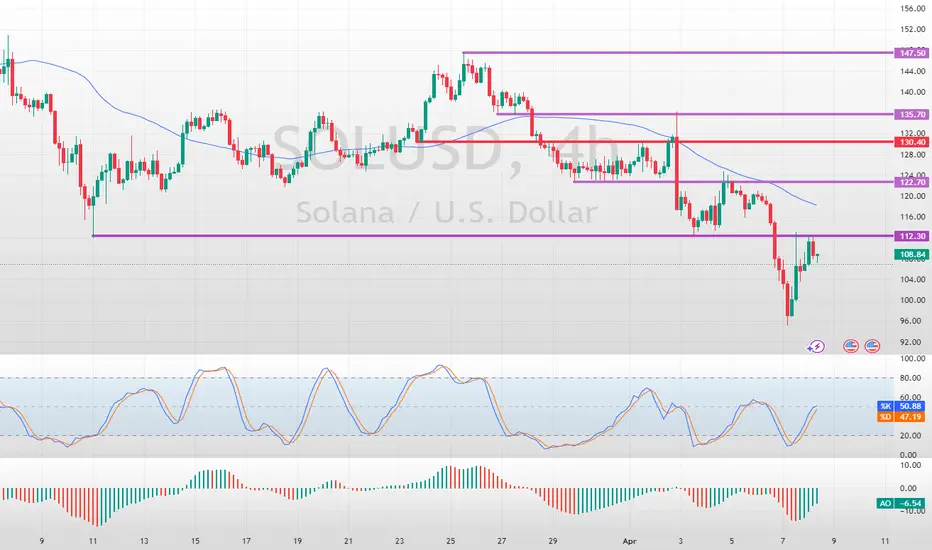
Is Solana heading to $100 It appears we have not made new higher highs in price action on the 4 hour and thus a possible movement down to $108 then 100 levels make sense. However if we can break 139 level then 147 can make sense going up.
Trade Smarter Live Better
Kris
Solanaforecast
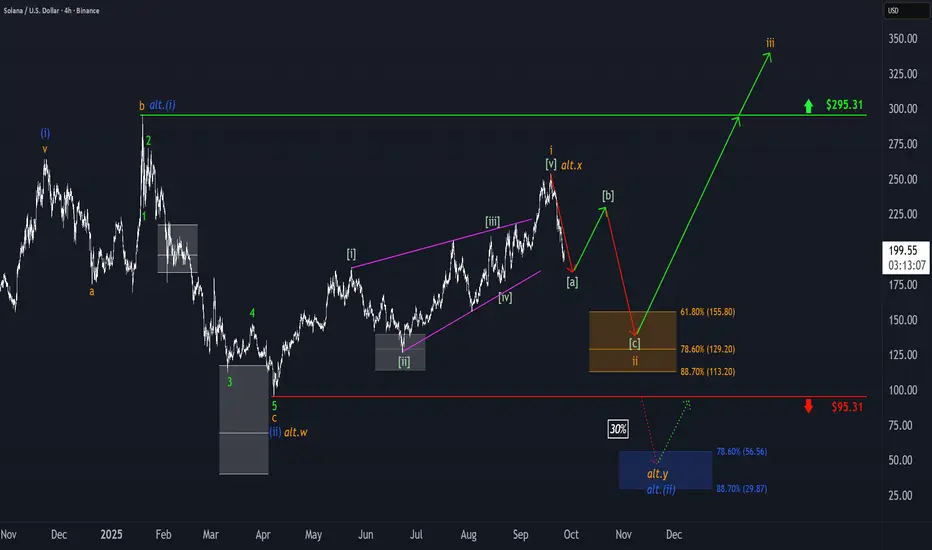
Solana: Is the Bottom In, or More Downside Ahead?SOL has already climbed more than 15% from last Friday’s low at its peak, potentially signaling the completion of wave ii in orange. For now, however, we’re still keeping open the possibility that this move could dip to a new low—within our green Target Zone ($155.80–$113.20). In any case, once this interim correction wraps up, wave iii in orange should kick off an impulsive rally, only losing steam above resistance at $295.31.

Solana: Bears are in Full ControlFenzoFx—Solana is up by 3.30% today, after the sharp decline on November 25. The daily candle of this date is a bearish engulfing, meaning the sellers are in control of the $171.70. This level has the highest volume spike level as shown on the chart.
The immediate resistance is at $171.70. From a technical perspective, the downtrend will likely resume if the price holds below this level. In this scenario, the next bearish target could be the sell-side liquidity at $137.60, followed by $126.00.

BTC ETH SOL Ready for a DIVE?Just a knee jerk high bounce before a waterfall event into Wednesday...

Bearish Pressure Builds Below $208FenzoFx—Solana's uptick momentum has been capped by the descending trendline, even though the price flipped above the $185.00 mark.
The daily chart shows long-wick bearish candles, indicating the selling pressure persists below the $208.00 resistance. From a technical perspective, the downtrend will likely resume if the price closes below the inverted fair value gap. In this scenario, SOLANA could decline toward the primary support at $172.00.
Please note that the bearish outlook should be invalidated if the price exceeds the $208.00 mark.

SOLANA Buying Opportunity Solana has established support at the daily trendline and successfully closed above the key daily resistance level at $191.32. The daily RSI is also indicating a potential buying opportunity, suggesting renewed bullish momentum. If this upward trend continues, the next potential target for Solana is around $250.

Solana: Target Zone in FocusSOL has dropped more than 20% from last Thursday’s high. In light of this, we now believe that last week’s high—reached on Thursday—marked the top of wave i in orange, and that price is currently undergoing a wave ii corrective phase. This correction should play out as a downward, three-part move labeled - - in green, ultimately targeting our orange zone between $155.80 and $113.20. We expect the low of this wave ii to occur within that Target Zone, which should set the stage for a bullish reversal. The following wave iii in orange is projected to push SOL to new all-time highs, breaking through resistance at $295.31.
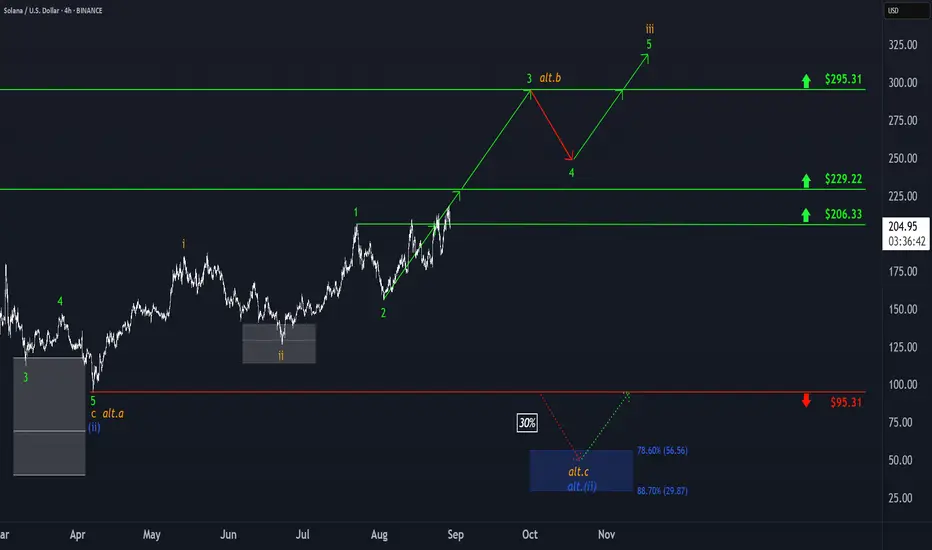
Solana: Stay the Course!Solana started the week with a sharp pullback but quickly bounced back, breaking through resistance at $206.33 for the third time in just two weeks. Our primary outlook points to another push higher, with price expected to clear resistance at $229.22 and complete the ongoing green wave 3 near $295.31. From there, the broader green five-wave sequence should ultimately break above this level and finish the larger orange wave iii. We still assign a 30% probability to the alternative scenario, which calls for a fresh wave (ii) correction low within the blue downside Target Zone between $56.56 and $29.87.
Solana's Bullish Breakout: Eyes on $228.1FenzoFx—Solana broke the structure on July 21, and then pulled back below this level, providing discount entries. We expect the uptrend to resume and target the resistance at $228.1.
A dip toward $170.0 followed by a better price for bullish entry at $161.2 could be ideal and low risk. Monitoring these levels for candlestick patterns, break of structure in 5 minutes, and fair value gaps to confirm if there would be a bounce and continuation of the uptrend from any of these two levels.

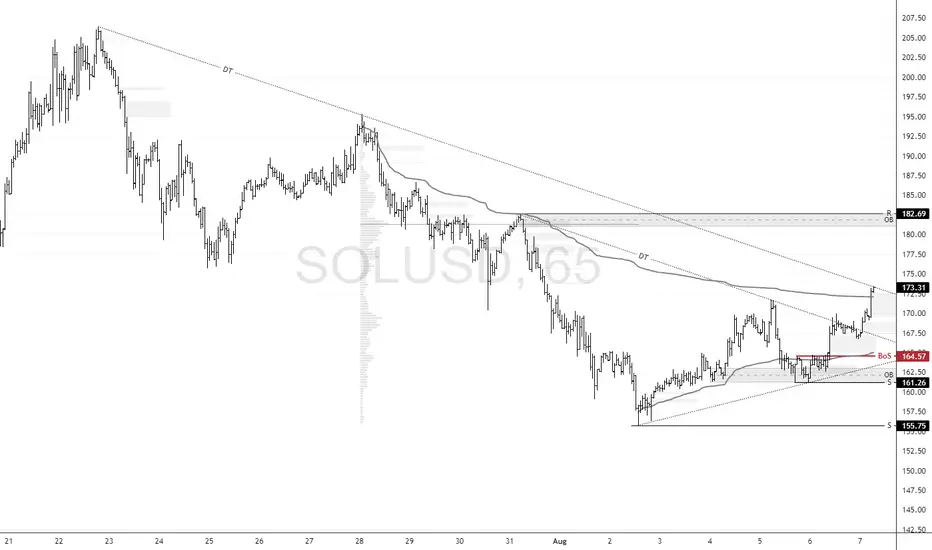
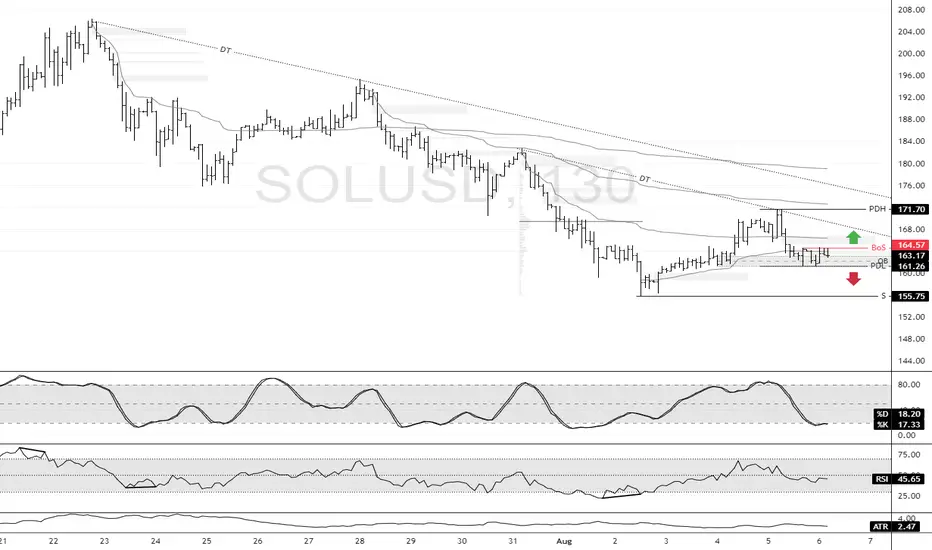
Solana Surges, Yet Still Lags Behind LTCFenzoFx—Solana targeted the primary descending trendline after it broke the structure by closing above $164.5. While LTC, which is a cryptocurrency like Solana with a price range between $100.0 and $200.0, reached its previous monthly highs, Solana still lags behind.
Currently, SOL is testing the average volume weight at approximately $173.0, in conjunction with the primary descending trendline.
Forecast : With the primary support at $161.2, we expect SOL/USD to resume its uptick momentum. In this scenario, the price should target the order block with peak resistance at $182.6.
Solana Lags While LTC SurgesFenzoFx—Solan trades sideways, slightly above the previous day's high. Sol's price did not rise while other cryptocurrencies, such as LTC, had a significant surge in price this week. Therefore, we expect the price to rise, and we will be bullish on this cryptocurrency.
The immediate resistance is at $167.5. From a technical perspective, we expect a bullish move toward the previous day's high at $171.7 if this level breaks. If this scenario unfolds, we can market this level as a break of structure.
Please note that the bullish outlook should be invalidated if Solana falls below the previous day's low. If this scenario unfolds, the current bearish momentum will likely target $155.7.
Solana Holds Firm Above VWAP and TrendlineFenzoFx—Solana remained above the ascending trendline and the monthly VWAP, currently trading sideways inside the wedge.
Critical support is at $173.3, and the market outlook remains bullish above this level. If this demand level holds, we expect Solana to resume its bullish trajectory and target the recent highs at $206.4.

Solana Bullish Outlook Above $140.0Solana's decline from 163.9 eased near the $148.4 support. However, this demand zone expands to $140.0, which is backed by the high volume node.
From a technical perspective, the outlook is bullish as long as Solana trades above $140.0. In this scenario, we expect the price to target at least 50.0% of its previous range, which is approximately $155.38.

SOLANA Eyes Recovery After Retesting Monthly LowFenzoFx—Currently, SOL/USD trades at approximately $148.37, testing the previous monthly low, which aligns with a bullish fair value gap and is backed by a high-volume node area.
A close and stabilization above $149.3 can spark the uptrend. In this scenario, the next bullish target could be the $168.38 resistance.

Solana: Below ResistanceOur primary scenario for Solana is that the coin is already close to the top of the green wave 4. Therefore, we expect a bearish trend reversal below the resistance at $192.33, followed by a move toward our blue Target Zone (coordinates: $56.56 – $29.87) with the green wave 5. Down there, we see an opportunity for long trades with the low of the blue wave (ii), which should be followed by a fresh upward impulse. According to our alternative scenario (probability: 38%), however, we may have already seen the low with wave alt.(ii) in blue prematurely. To validate this alternative scenario, the price would have to rise directly above the resistance at $192.33 from here and extend the blue wave alt.(iii) .

Solana: More RoomSolana’s countermovement of the green wave 4 has some more room on the upside. Once the wave-4-top is established (below the resistance at $192.33), we primarily anticipate a wave 5 sell-off down into the blue Target Zone on the downside (coordinates: $56.56 – $29.87). In this range, the wave (ii) corrective movement should conclude, and the altcoin should start the next sustainable upward impulse. However, if the price rises above the mentioned $192.33 mark during the current upward movement (36% likely), this will suggest that the low has already formed via wave alt.(ii) in blue.

Solana Found Resistance at $112.0FenzoFx—Solana is trading bearishly and has encountered resistance at $112.0. If this level holds, the downtrend is likely to resume, with a target of $90.0.
>>> Trade SOL/USD, swap free at FenzoFx Decentralized Broker
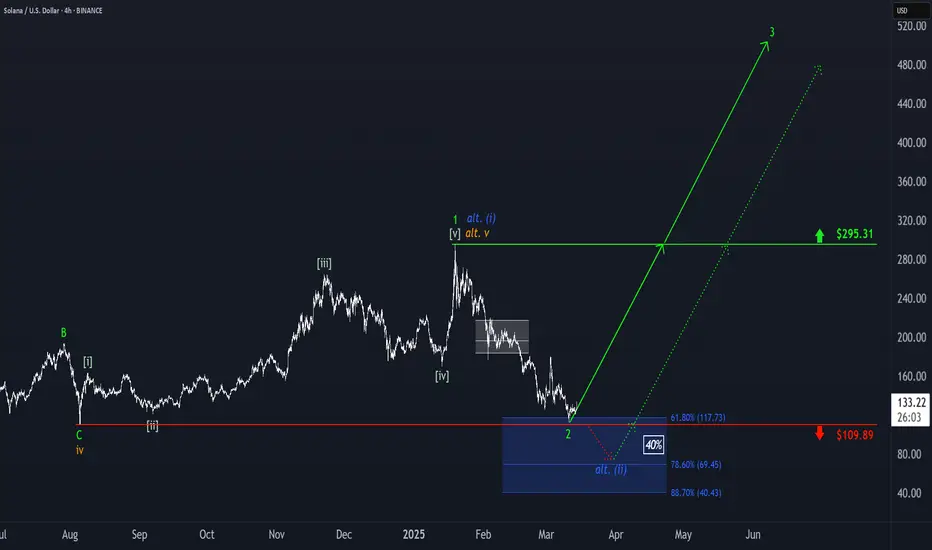
Solana: Precision Landing?!Solana extended its sell-off and reached our blue long Target Zone between $117.73 and $40.43. The price then reacted right at the $109.89 support level, indicating that the low of the green wave 2 has been settled. Thus, the next step should involve a strong rally driven by the green wave 3, ultimately pushing SOL well beyond the $295.31 resistance and past its current all-time high. However, our Target Zone remains active, as there is a 40% chance that the price could revisit this range to complete the blue alternative wave (ii) below the $109.89 mark.
Solana Analysis Solana Analysis
Solana is currently finding robust support on the daily chart, as indicated by the significant impact of the recent bearish trend that has dominated the cryptocurrency market over the past week. A rebound towards a bullish trend is anticipated, as the asset has recently bounced off this strong support level.
Please note that this is my personal analysis and should not be construed as financial advice to invest in or purchase this asset. It is crucial to exercise your own judgment and conduct thorough research and analysis prior to making any investment decisions.
Trade cautiously and ensure you fully understand the associated risks before executing any trades
Cheers!!

Solana's All-Time High: Symmetrical Triangle Pattern in Play..!Solana is currently exhibiting a symmetrical triangle pattern as it approaches its all-time high of $260. This pattern typically indicates a period of consolidation, where the buying and selling pressures are in relative equilibrium. Traders and analysts are closely monitoring this development, as a breakout from this formation could lead to a significant price movement, either upwards or downwards. The potential direction of the move will depend on which side the price ultimately breaks out from. Therefore, investors must stay vigilant and watch the market closely for any signs of a breakout, as it could herald a pivotal change in momentum for Solana.

Sol might Head to new ATHAfter braking March high 202.59 in November last Year. Price can back to retest the poi 176.52 and rejection kicks in strong.
I'm anticipating the price to clear the November high 252.88 and probably create a new High.

Solana: In Wave [ii]Since the light green wave 2’s low at $133.18, Solana has been working on wave 3, which should develop via a green five-wave substructure. Currently, the internal wave correction should still be in progress, as no significant upward impulses have emerged thus far. Accordingly, we anticipate further declines, but the price should transition into the subsequent green wave above the support at $133.18. If the coin falls below this key level, our 30% likely alternative wave count will come into play. On the other hand, Solana has already tested important levels during wave , so we cannot rule out an immediate rally above the resistance at $264.32.

SOL/USD "SOLANA" Crypto Market Heist Plan on Bearish Side🌟Ola! Bonjour! Hi! Hallo!🌟
Dear Money Makers & Robbers, 🤑 💰
Based on 🔥Thief Trading style technical analysis🔥, here is our master plan to heist the SOL/USD "SOLANA" Crypto market. Please adhere to the strategy I've outlined in the chart, which emphasizes short entry. Our aim is the high-risk Green Zone. Risky level, oversold market, consolidation, trend reversal, trap at the level where traders and bullish robbers are stronger. 👀 So Be Careful, wealthy and safe trade.💪🏆🎉
Entry 📉 : You can enter a trade anywhere,
however I advise placing sell limit orders within a 15 or 30 minute timeframe. Entry from the most recent or closest high level should be in retreat.
Stop Loss 🛑: Using the 2H period, the recent / nearest high level.
Goal 🎯: 192.00
Scalpers, take note : only scalp on the Short side. If you have a lot of money, you can go straight away; if not, you can join swing traders and carry out the robbery plan. Use trailing SL to safeguard your money 💰.
Warning⚠️ : Our heist strategy is incompatible with Fundamental Analysis news 📰 🗞️. We'll wreck our plan by smashing the Stop Loss 🚫🚏. Avoid entering the market right after the news release.
Take advantage of the target and get away 🎯 Swing Traders Please reserve the half amount of money and watch for the next dynamic level or order block breakout. Once it is resolved, we can go on to the next new target in our heist plan.
💖Supporting our robbery plan will enable us to effortlessly make and steal money 💰💵 Tell your friends, Colleagues and family to follow, like, and share. Boost the strength of our robbery team. Every day in this market make money with ease by using the Thief Trading Style.🏆💪🤝❤️🎉🚀
I'll see you soon with another heist plan, so stay tuned 🫂
