SOLANA: Wave energy on the brink of a new movementSOLANA: Wave energy on the brink of a new movement
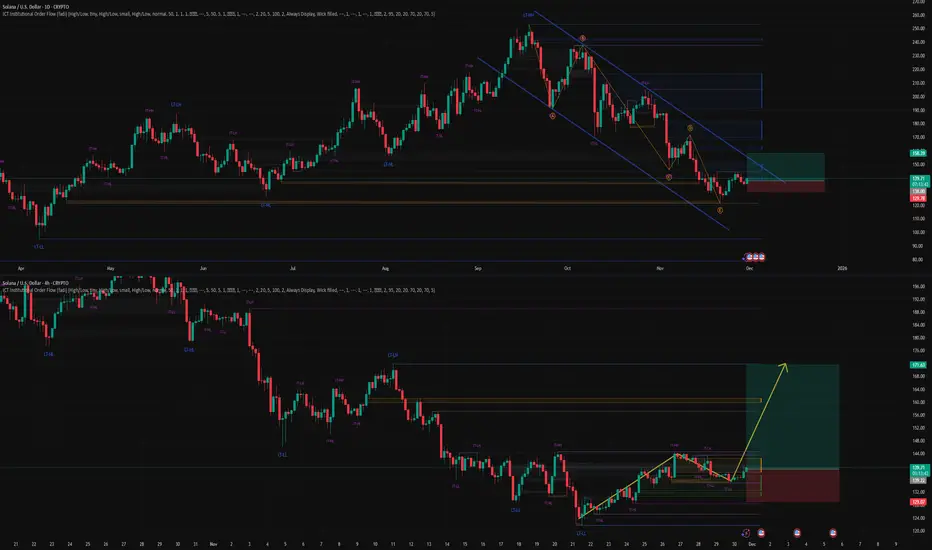
SOLANA Wave Overview (D1 and H4)
As a trader who has been practicing wave analysis for over ten years, I note that the current Solana structure demonstrates the completion of an extended corrective formation and the potential for a new impulse to emerge.
Chart D1: The global picture indicates that the market is completing a sideways phase. The wave structure appears to be the end of a corrective sequence, which serves as the foundation for the next trend move.
Chart H4: Local dynamics confirm the formation of key entry points. Here, the first signs of an emerging impulse are visible, which could mark the beginning of a larger wave.
Main Scenario
After the completion of the corrective phase, a descending impulse sequence is expected to develop. This movement will be accompanied by increased seller activity and a gradual shift in priority to the downside.
Alternative Scenario
If the price holds above recent highs and forms a stable upward impulse structure, the priority will shift to continued growth. In this case, the correction will be considered incomplete, and Solana may show an additional rebound.
Trading Idea
Conservative approach: wait for confirmation of a breakout of key levels and enter with the trend.
Aggressive approach: use local impulses on H4 for earlier entries, but with tight stops.
In both cases, it is important to maintain strict risk management and adjust the plan as new impulses emerge.
Results
Solana is at the transition point between a correction and a new impulse. The wave structure on D1 and H4 provides clear guidelines for action: watch for confirmation of the scenario and act with discipline.
Solanalong

SOLANA: Wave Energy on the Threshold of ImpulseSOLANA: Wave Energy on the Threshold of Impulse
Based on the current wave structure, Solana is completing its corrective phase and preparing to form a new movement. The chart shows a transition from sideways momentum to a more pronounced impulse, which could set the direction for the near term.
Primary scenario: After the correction ends, a downward impulse sequence is expected to develop. Alternative scenario: If the market consolidates above recent highs, it could continue to rise, delaying the start of a new downward wave.
Idea for traders: Watch for confirmation of the structure on lower timeframes and enter only after clear reversal signals appear.
Risk management: Use clear stop levels and adjust your plan as new impulses emerge.
Friends, more wave analysis is available in our profile.
Subscribe to stay up to date with wave analysis!
SOL 1W Breakdown: Key Levels, What I’m Watching Next Nov 24 2025Here’s my read on Solana’s weekly chart using the same structure as the BTC and ETH analyses.
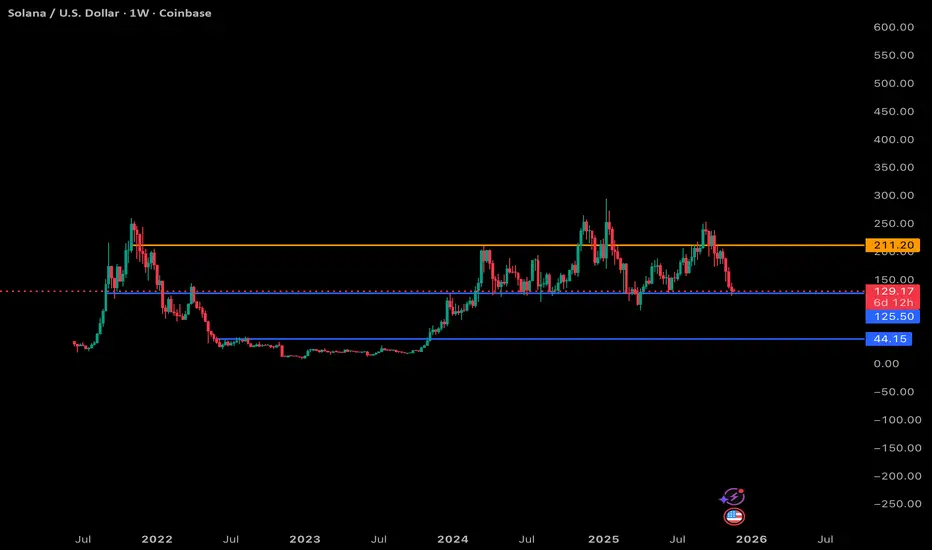
Blue = support, orange = resistance, and the dotted mid-range is acting like a pivot zone.
Support Levels (Blue)
$125.50: This is the line SOL is sitting right on top of right now. It’s been a key mid-range level for almost two years. Losing this on the weekly would be a clear bearish signal because there isn’t much structural support underneath until the next major zone.
$44.15: This is the big, deep support from the 2022–2023 accumulation base. I’m not calling for this immediately, but structurally there’s a lot of empty space between $125 and $44. If the macro rolls over and SOL can’t defend the mid-range, we could see a slow bleed or capitulation wick toward this zone.
Resistance (Orange)
$211: This is the major weekly resistance for SOL and has been the top of every rally since 2022. Until SOL can close above this level and hold it, any upside is still just range movement.
My Current Thoughts
SOL is in a tricky spot. We’re sitting right on that $125ish support, and this is basically the “bounce here or things get uncomfortable fast” level.
If we don’t get a bounce:
The chart opens up a pretty big air pocket down to the next structural support.
Weekly structure turns decisively bearish.
SOL likely enters a multi-month corrective phase similar to what it did in 2022/2023 (but obviously not the same magnitude).
If we do bounce:
SOL can chop around this mid-range again, possibly retesting $150–175.
But it still needs a clean reclaim of $211 to resume a real macro uptrend.
Overall View
SOL’s weekly chart is way less forgiving than BTC or ETH right now. The range is clear, but we’re testing the bottom of it, and losing this level puts a lot of downside in play. From a structural standpoint, this is the most important support SOL has tested in a long time. If it holds, cool, if it breaks, we probably enter a much deeper reset.
Slow grind or big drop, the next weekly close is going to be telling.
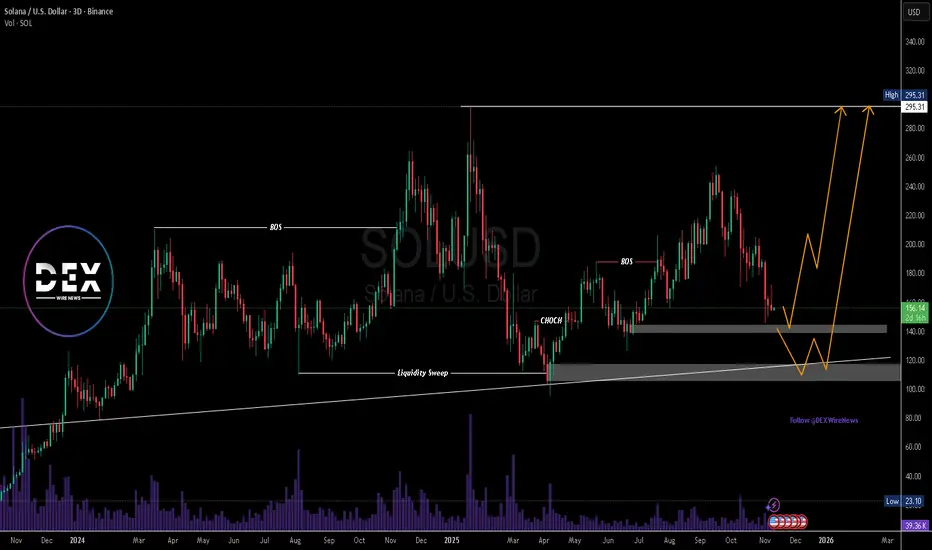
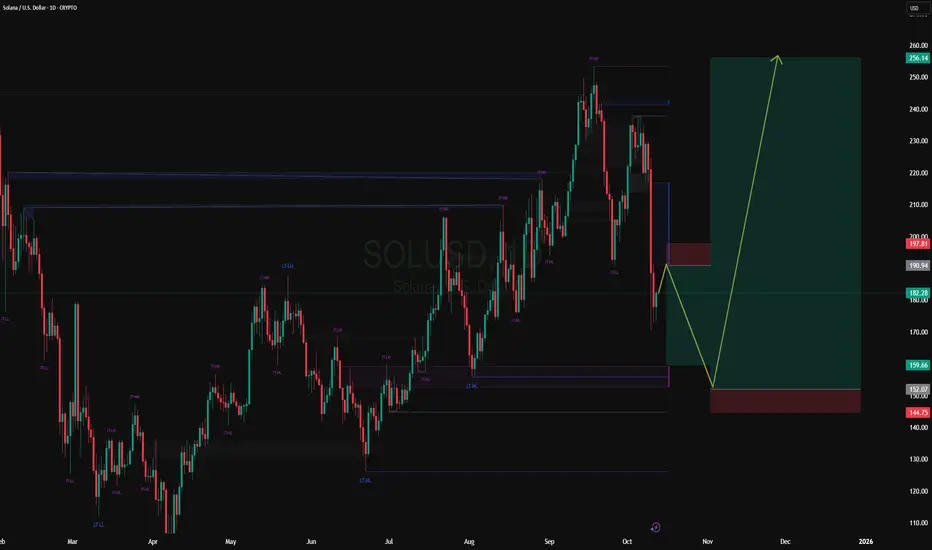
$SOLUSD Eyes Key Demand Zone Before Potential Macro BreakoutSolana (SOL/USD) is approaching a pivotal technical zone that could define its next major move. After an extended corrective leg from the $254 region, the price has retraced toward key demand areas, around $140, and around $120 where prior liquidity sweeps and structural reversals have historically emerged.
The chart reveals a repeating market behavior where Solana establishes a base within strong demand zones before launching decisive bullish impulses. An external structure Break of Structure (BOS) from previous swing highs, followed by an internal Change of Character (CHOCH) confirmation, after a retracement, suggests the broader bullish structure remains intact despite short-term weakness due to macro- economic challenges.
Should price hold the $120 range, a rebound toward the $295 previous highs appears probable. However, if sellers drive price lower, deeper liquidity could be collected near the $115–$120 region, aligning perfectly with the ascending trendline and long-term support base. This would likely create a high-probability accumulation phase before another impulsive leg higher.
Volume trends show healthy market participation during both expansions and pullbacks, reflecting consistent investor interest in Solana’s price action. Fundamentally, Solana’s growing adoption across DeFi, NFTs, and high-performance dApp ecosystems continues to strengthen the bullish bias.
A confirmed reversal from current levels could set the stage for a macro breakout toward the $295 zone, which represents a higher high of the external bullish structure and a psychological milestone for market participants.
In summary, Solana’s technical framework signals that the market is in a late-stage correction within a larger bullish cycle. A clean defense of the $140 zone would reinforce the bullish continuation narrative, while a brief dip into the $115 zone could form the final liquidity trap before another surge toward new highs
SOLANA: The last wave before takeoff or a deep pullbackSOLANA: The last wave before takeoff or a deep pullback
📈 Weekly Scenarios
Bullish scenario: SOL holds above ~$190, breaks through ~$260.83 → start of uptrend → target ~$300+.
Consolidation: price trades between ~$190 and ~$260, wave structure not defined until breakout.
Bearish scenario: breakout of support at ~$190 with volume → likelihood of a significant correction to ~$150–$160.
✅ Conclusion
Solana is at a key decision point for the coming week:
The ~$260.83 level is a benchmark for a bullish resumption.
The ~$190 level is a critical support level.
A breakout upward will provide upward momentum; a breakout downwards is likely a pullback. Follow price reactions at the highlighted levels and confirmation of the wave structure before making trading decisions.

Solana (SOL): Wave 5 Starting or Set to Crash?Solana (SOL): Wave 5 Starting or Set to Crash?
Weekly Scenarios
Bullish scenario: SOL holds support at ~$197, then breaks through ~$260.83 → possible rise to ~$300+.
Consolidation: The price trades in the ~$197–$260 range without a clear direction, preparing for momentum.
Bearish scenario: A breakout below ~$183 with volume → possible correction to ~$174 and below.
✅ Conclusion
Weekly analysis shows: SOL is at a crossroads.
A hold of support near ~$197 and a break of resistance at ~$260.83 could trigger a new uptrend.
However, a breakout below ~$183 significantly increases the risk of a correction.
Monitor the wave structure, volatility levels, and volume confirmation before choosing a strategy.
Solana - We have to see new all time highs!🚀Solana ( CRYPTO:SOLUSD ) has to break out:
🔎Analysis summary:
Over the course of the past couple of months, Solana has been rallying another +100%. This rally ultimately resulted in another, third retested of the previous all time high. And if Solana now creates bullish confirmation, we can all expect new all time highs very soon.
📝Levels to watch:
$250
SwingTraderPhil
SwingTrading.Simplified. | Investing.Simplified. | #LONGTERMVISION

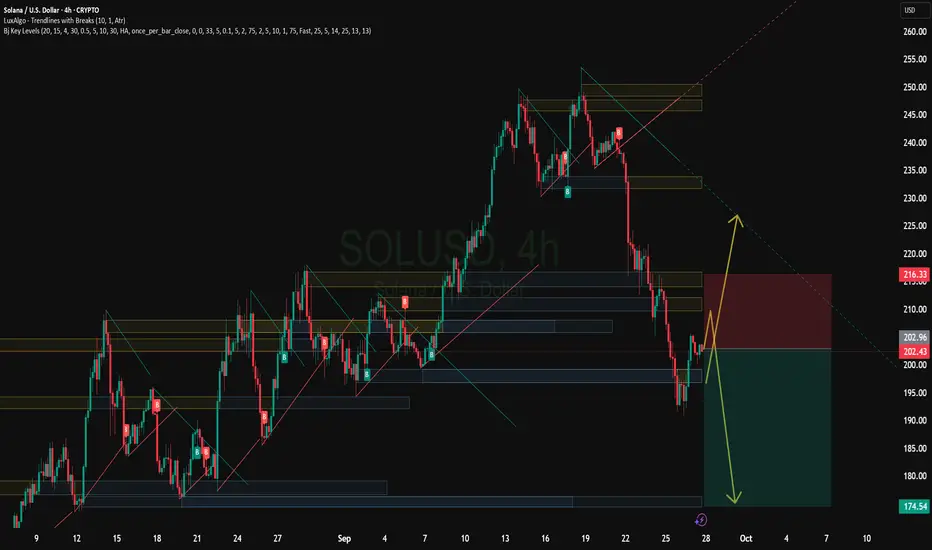
SOLANA (SOL): Wave 5 awaits – upward momentum or bear trap?SOLANA (SOL): Wave 5 awaits – upward momentum or bear trap?
Weekly Scenarios
Bullish scenario: Price holds the ~$185-190 zone, breaks resistance at ~$260 → wave 5 starts up, target is approximately ~$300+.
Consolidation: Price moves in the ~$185-260 range without a significant breakout; energy is accumulating, waiting for a signal.
Bearish scenario: Break of support at ~$185 with volume → confirmation of the start of wave C correction → possible decline to ~$150-160.
✅ Conclusion
On the weekly timeframe, SOL is at a crossroads:
If it holds above ~$185 and manages to break ~$260, the chance of a strong rally increases.
If support fails to hold, the risk of a correction remains. Traders should watch for price reaction on levels, volume, and confirmation of wave structure before taking a position.

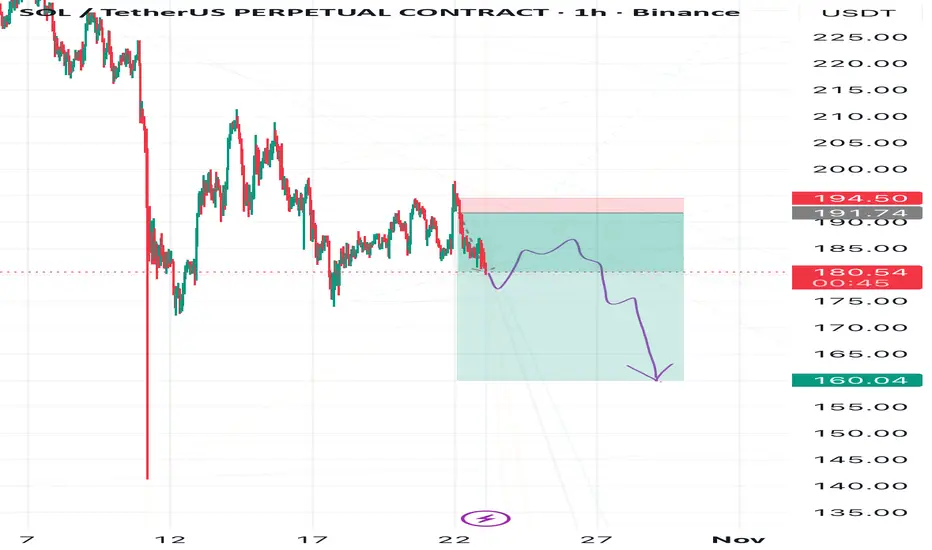
Don’t Trust the Twist — Solana’s Fall May PersistBe careful with Solana — the market might trick you into thinking a bullish reversal is forming.
In reality, the downtrend hasn’t finished yet.
A descending triangle is forming, and the breakout could be strongly to the downside.
🎯 Targets:
1️⃣ 164
2️⃣ 156
3️⃣ 138
❌ Invalidation: if price reaches the red zone marked on the chart
SOLANA Buying Opportunity Solana has established support at the daily trendline and successfully closed above the key daily resistance level at $191.32. The daily RSI is also indicating a potential buying opportunity, suggesting renewed bullish momentum. If this upward trend continues, the next potential target for Solana is around $250.

Solana Scenarios for the monthMonthly Scenarios
Bullish Scenario
SOL holds support in the $180-$184 range and breaks above $184-$190.
This will provide impetus to targets in the $230-$300+ range, especially if the market turns out favorable and there is positive news regarding SOL/ETF/on-chain activity.
Consolidation/Sideways
The price may remain stuck in the $180-$190 range without a clear direction, especially with light volume.
In this scenario, it is important to monitor reactions at the range boundaries.
Bearish Scenario
If SOL breaks below $180-$184 with volume, a decline to the lower support level of $143-$153 or even lower is possible.
Such a correction could serve as a "normalization" after a significant rise.
✅ Conclusion
The current monthly trend for SOL appears generally bullish, with strong potential for continued growth upon a breakout of resistance.
But the key area to watch is the $184–190 zone: if there's a breakout with volume, we expect an upward acceleration.
The $180 and especially $153–143 support zones are areas to monitor for trend stability.
The CoinCodex forecast (~3-5%) suggests moderate growth, but with the potential for strong momentum under favorable conditions.
Why Solana Could Surpass $300 in 2025–2026Hey guys, today I want to share my full view on Solana (SOL) .
For a long time, my main focus as an investor and trader was always on Bitcoin and Ethereum. But in the last 12 months, I started massively investing into Solana. The reason is simple: the ecosystem is not only recovering from its darkest days but is now proving real resilience, adoption, and growth.
When FTX collapsed in November 2022, Solana took one of the hardest hits. FTX and Alameda were among the biggest backers of the Solana ecosystem. When they went bankrupt, SOL crashed under $12 and many people stopped believing in its future. The market saw Solana as “FTX’s chain.” But fast forward to today, and we are witnessing a complete turnaround. Users are coming back, new protocols are being launched, and on-chain activity is stronger than ever.
In our crypto prop trading company , we’re building new infrastructure for our traders, and after careful research, we chose Solana as the best chain for implementation . Its speed, scalability, and near-zero fees make it the most practical blockchain to build on. And it’s not just us — many other companies and institutions are starting to integrate with Solana, which will bring even more growth in the months ahead.
⚠️ Quick disclaimer: This is not financial advice — only my humble opinion based on research, analysis, and experience.
Solana Price Action & Key Events (2022–2025)
To understand Solana’s current position, let’s look back at its journey over the last few years:
Bridge Breach (Feb 2022): The Wormhole bridge hack stole ~$325M, hurting trust in Solana DeFi.
DeFi Winter (May 2022): The Terra UST/LUNA collapse triggered a full liquidity crisis across all DeFi. Solana’s TVL drained fast.
FTX Implosion (Nov 2022): The turning point. FTX and Alameda went bankrupt, SOL crashed under $12, and the bear market bottom was defined.
Meme Season (Early 2024): Retail users came back with BONK and other meme coins. Solana’s speed and low fees made it the perfect hub for speculation.
WIF Mania (Spring 2024): Dogwifhat (WIF) went viral, volumes on Solana even surpassed Ethereum at times.
Pump.fun Frenzy (Apr 2024): Millions of tokens launched through Pump.fun, onboarding hundreds of thousands of wallets and driving record on-chain activity.
Full Recovery (2025): After two years of stagnation, SOL broke above $200 again, fully recovering to pre-FTX levels and proving that it can thrive as a community-driven, retail-driven chain.
Solana On-Chain TVL (Total Value Locked)
TVL (Total Value Locked) shows how much capital is locked in DeFi protocols on Solana — lending, staking, DEXes, and yield farming.
2021–2022: First boom, TVL surged past $10B.
2022–2023: Collapse after Terra and FTX, TVL fell close to zero.
2024–2025: Strong recovery — TVL passed $9–10B again, showing users are back and Solana DeFi is alive.
Why this matters: TVL growth proves Solana is not only about meme coins. Capital and liquidity are returning, and users are once again trusting the chain with real money.
Solana DEX Volume & Pump.fun Impact
In just one day, DEXs on Solana processed $10.3B in trading volume.
Pump.fun alone made up ~80% of that ($7.93B).
Pump.fun is unique because it allowed anyone to instantly create and trade tokens, onboarding massive numbers of new users. At its peak, Pump.fun had over 400,000 weekly active addresses , and even today it still makes up around 10% of all Solana DEX activity .
This shows two things:
Solana is the clear leader in retail-driven trading.
The ecosystem still needs broader use cases to sustain growth once meme speculation slows.
Futures Open Interest – Market Confidence
Open interest (OI) in Solana futures collapsed after FTX, but in 2024–2025 it came roaring back, growing alongside SOL’s price.
Positive: Rising OI shows traders trust Solana again, and rallies are backed by real activity.
Risk: Very high OI means higher liquidation risk. If markets turn, leveraged positions could cause sharp corrections.
Pump.fun Traders Data – Not Everyone Wins
According to Dune Analytics, 99.6% of Pump.fun traders never made more than $10K in realized profits . Only a small fraction hit big wins, while most made little or lost money.
This highlights the gambling-style nature of meme trading: it drives huge network activity but is not sustainable long-term. For Solana, the key is converting this short-term hype into long-term adoption.
Why Solana Could Rise in Late 2025–2026
Looking forward, here are the main reasons I believe Solana has strong upside potential:
1. Tokenization Boom
By 2033, $20T in assets could be tokenized.
Solana has the scalability, low fees, and adoption needed to be the leading infrastructure.
2. On-Chain Usage
Solana already surpasses Ethereum in active addresses and transactions (100M monthly users, 3.5B monthly txs).
More usage → more fees → higher staking yield → stronger SOL demand.
3. Institutional Adoption
Major players like BlackRock, Franklin Templeton, Visa, and PayPal are already launching tokenized products or stablecoin integrations on Solana.
4. Ecosystem Growth
Solana dominates in trading, token creation (60% of new tokens), and new sectors like AI agents.
From Pump.fun (retail) to xStocks and OnRe.finance (institutional), Solana is proving versatile.
5. Technology Roadmap
With Firedancer and other upgrades, Solana is moving toward 100k–1M TPS capacity, making it “internet-scale finance.”
6. Investment Case
SOL is scarce (~750M fixed supply), yield-bearing (7–13% staking), and directly tied to network growth.
Analysts project potential 4x–30x appreciation (short-term ~$900, medium ~$2,000, long-term ~$6,000).
Outlook – Target $300+
If 2022–2023 was about survival, and 2024–2025 was about recovery, then 2026 could be Solana’s breakout moment as the backbone of digital finance.
With on-chain activity at record highs, institutional adoption growing, and scalability improvements rolling out, a move above $300 in late 2025 or 2026 is not only possible but realistic.

Solana Weekly Forecast and ScenariosWeekly Forecast and Scenarios
Bullish scenario: SOL holds support near $200–$210 and breaks through the $245–$250 zone, leading to a directional move toward $270 and beyond (even to $300).
Consolidation: The price may fluctuate within the $200–$245 range, awaiting volume and news, without a clear trend.
Bearish scenario: A breakout from the support range (below ~$188–$200) could lead to a pullback to lower levels of $170–$180.
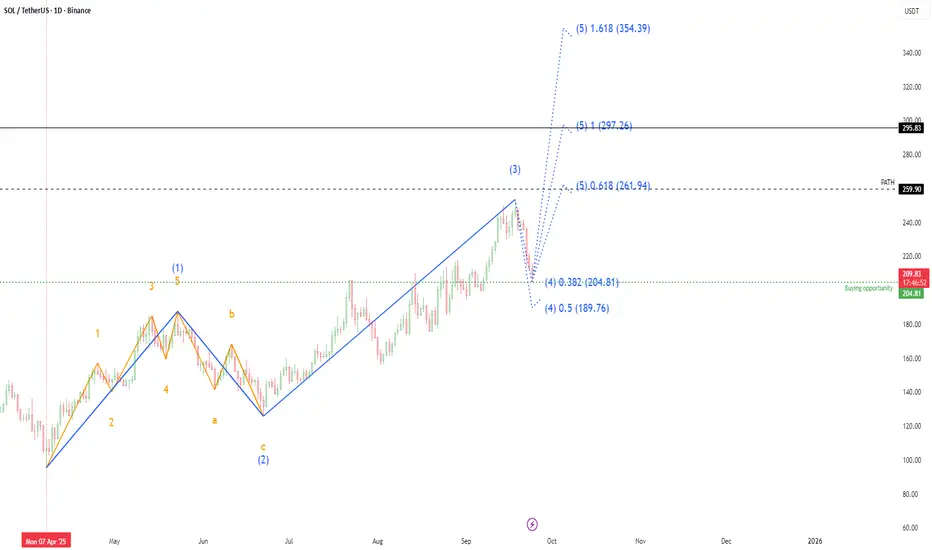
Solana - Elliott Wave Analysis Based on Elliott Wave Theory, Solana appears to be completing Corrective Wave 4, with a potential buying opportunity in the $189 – $204 range. The market structure suggests the development of Impulse Wave 5, which is becoming increasingly evident on the daily chart.
Solana - The sleeping giant waking up!🔦Solana ( CRYPTO:SOLUSD ) will still head higher:
🔎Analysis summary:
Yes, over the past four years, Solana has overall been just consolidating. But eventually, Solana will catch up with the entire crypto market and create a new all time high. Specifically with bulls picking up momentum lately, it becomes more and more likely that Solana will do exactly that.
📝Levels to watch:
$250
SwingTraderPhil
SwingTrading.Simplified. | Investing.Simplified. | #LONGTERMVISION

Signal Breakout as SOL Targets ATH and $300+Solmate’s $300M Launch in the UAE Sparks Solana Treasury Wave: Institutions Signal Breakout as SOL Targets ATH and $300+
The Solana ecosystem is entering a critical new phase of institutional adoption and capital formation, with multiple catalysts converging to form one of the strongest bullish narratives in crypto today. The headline development: Solmate has launched with a $300 million mandate to establish a Solana-focused treasury in the United Arab Emirates. This move, paired with growing institutional interest, potential ETF approvals, and increasingly favorable technicals, has set the stage for a potential breakout rally. Some market participants now see a credible pathway to $300+ for SOL, while others point to new all-time highs as fundamentals and momentum align.
This piece explores the strategic implications of Solmate’s treasury launch, the growing momentum behind Solana among institutions like Forward Industries, the macro tailwinds surrounding ETF approvals, and the technical structure that supports a bullish continuation. We’ll also assess the potential risks, the role of on-chain growth, and how the UAE’s regulatory and capital environment could accelerate Solana’s trajectory.
Solmate’s $300M UAE Treasury: Why It Matters
Solmate’s $300 million capital pool dedicated to establishing a Solana treasury in the UAE is more than a headline number—it’s a signal that institutional-grade asset management for crypto-native assets is globalizing beyond traditional finance hubs. The UAE, and particularly Abu Dhabi and Dubai, have positioned themselves as crypto-forward jurisdictions with clear regulatory sandboxes and proactive frameworks. Establishing a Solana treasury there creates:
• A regional liquidity hub: Concentrating capital in a friendly regulatory environment can improve market depth for SOL and Solana-native assets during aggressive expansion phases.
• Institutional standardization: A treasury framework can adopt disciplined risk controls, custody standards, and transparent rebalancing strategies, making it a template for other funds and corporates to emulate.
• On-ramp for Middle Eastern capital: Sovereign wealth funds, family offices, and regional asset managers have shown interest in digital assets. A Solana-focused treasury in the UAE lowers friction for capital allocation.
•
Mechanics of a Solana Treasury
Treasury operations are more than passive holdings. They typically involve:
• Core SOL accumulation: A base allocation that reflects long-term conviction in network value capture, staking yields, and governance.
• Liquidity provisioning: Deploying assets in DeFi protocols, AMMs, and order books to enhance liquidity and earn fees, subject to risk controls.
• Staking strategies: Validator diversification, slashing protection, and yield optimization through auto-compounding and programmatic rebalancing.
• Venture and ecosystem exposure: Strategic allocations to Solana-native projects, tokens, real-world asset (RWA) initiatives, and infrastructure plays (or via index-like baskets).
• Hedging overlays: Options and perp hedges to manage drawdowns while maintaining directional exposure.
By anchoring these flows in the UAE, Solmate not only signals conviction; it operationalizes a repeatable structure that can absorb larger institutional checks as compliance frameworks and counterparties mature.
Forward Industries Bets Big on Solana
Forward Industries’ publicized pivot toward SOL underscores a broader shift: institutions are no longer simply “diversifying” into Solana—they are actively rotating into it as a core position. The drivers include:
• Performance-to-throughput ratio: Solana’s execution environment continues to deliver high throughput and sub-second finality with low fees, supporting consumer-grade applications such as payments, on-chain order books, and gaming without UX compromise.
• DePIN, payments, and consumer apps: From real-time order execution to growth in tokenized assets and payments rails, Solana’s app layer is demonstrating product-market fit in areas where latency and cost matter.
• Developer momentum: Tooling, runtimes, and TypeScript-centric development are attracting teams that want to ship quickly with rich UX. Growth in Saga and mobile-focused experiments adds tailwind.
• Liquidity concentration: As more capital pools into SOL pairs and Solana’s native DEXs, slippage decreases and the market becomes more attractive for block-sized orders.
The “buying frenzy” moniker stems from combined flows across centralized exchanges, on-chain wallets, staking platforms, and prime brokers. Institutional trade sizes are up, and block liquidity providers report rising interest for SOL borrow and cross-margin facilities—both signposts that levered directional exposure and basis trades are heating up.
The ETF Wave: SEC Approvals Could Reshape Flows
A critical macro catalyst is the likelihood of multiple ETF approvals in the coming months. While much of the focus has been on Bitcoin and Ethereum, the structural changes triggered by ETF adoption—standardized custody, audited NAV calculations, and regulated market-making—create spillover effects across large-cap crypto assets.
Here’s why ETF approvals matter to Solana:
• Legitimacy funnel: When institutions obtain board approvals for crypto exposure via ETFs, internal compliance friction declines. From there, investment committees often explore other large-cap crypto assets with similar liquidity and adoption—enter SOL.
• Portfolio construction: Multi-asset crypto strategies reweight based on momentum, liquidity, and correlations. If BTC and ETH ETF flows stabilize, allocators often diversify into high-beta assets with compelling adoption narratives—again, SOL is a prime candidate.
• Derivatives market deepening: ETF market-making expands basis, options, and hedging activity. Robust hedging tools lower the barrier to building large SOL positions.
Even if a Solana ETF is not immediately approved, the institutional infrastructure and behavioral changes catalyzed by BTC/ETH ETFs provide a clear path for capital to migrate into SOL through other compliant vehicles.
Technical Structure: SOL Aligns for a Breakout
From a technical perspective, SOL’s setup reflects several bullish elements frequently observed in assets that break into new cyclical highs:
• Higher lows and a strong weekly structure: Persistent higher lows on the weekly timeframe suggest bid support from larger accounts. Breakouts from multi-month accumulation ranges often lead to trend extensions.
• Volume confirmation: Rising volume on up weeks and muted sell volume on retracements indicate absorption by patient buyers. This is often a hallmark of institutional accumulation.
• Moving average alignment: When the 50-day and 200-day moving averages turn up in tandem and compress beneath price, they function as dynamic support. Golden cross conditions on high timeframes historically reinforce trend persistence.
• Momentum oscillators: Constructive RSI behavior (staying in bullish regimes, respecting 50-55 on pullbacks) supports the case for sustained upside. MACD crossovers above the zero line add confirmation.
• Market structure breaks: If SOL clears prior supply zones with strong breadth in Solana ecosystem tokens, it often precedes a sharp expansion leg.
From a pure charting lens, the path to retest the all-time high (ATH) becomes plausible once prior resistance shelves are flipped to support with convincing retests. The next leg can extend if funding stays balanced and derivatives don’t overheat.
Why $300+ Is on the Table
Calling specific price targets in crypto is always probabilistic, but the $300+ scenario reflects a confluence of factors:
• Elastic demand: As SOL regains narrative dominance, every incremental institutional participant must source supply in a relatively illiquid float, especially with high staking participation. This creates reflexivity: higher prices attract more attention and flows.
• Ecosystem beta: When Solana majors rally, Solana ecosystem tokens and NFTs often follow, generating wealth effects that feedback into SOL via fees, staking, and treasury rebalancing.
• On-chain revenues and usage: Fees and MEV-like revenue capture, combined with consistent L1 usage, differentiate SOL as more than a speculative token. If fee markets remain healthy without compromising UX, valuations can adjust quickly.
• Capital markets maturity: Prime brokerage services, credit lines, and custodial lending for SOL increase leverage capacity for funds. Managed responsibly, this deepens liquidity and smooths volatility while supporting upside.
•
Institutional Signaling and Order Flow Dynamics
Institutions leave footprints:
• Options skew: A shift toward call dominance and tightening call spreads near key strikes suggests demand for upside exposure. Calendar spreads can hint at timing expectations around catalysts like ETF decisions or protocol upgrades.
• Basis behavior: Persistent positive basis with manageable funding indicates steady demand for levered long exposure without frothy excess. Sharp basis expansions often precede blow-off tops, but controlled elevations are constructive.
• Block trade prints: Larger fills on the offer with minimal price impact imply sophisticated execution algorithms are absorbing liquidity. VWAP-style participation in uptrends is a hallmark of fund flows.
•
Solana Fundamentals: Not Just Hype
The bullish case is reinforced by fundamentals:
• Throughput and reliability improvements: Ongoing client and scheduler upgrades have meaningfully reduced congestion and improved consistency, aligning the chain for mainstream-scale apps.
• Developer ecosystem: Grants, hackathons, and venture inflows are driving an uptick in deployment across DeFi, DePIN, payments, and consumer social. More apps mean more transactions, fees, and network effects.
• Staking and validator health: A broad validator set with improving decentralization metrics, plus liquid staking growth, provides both security and capital efficiency. Mature slashing protections and monitoring infrastructure reduce operational risk.
• Cross-ecosystem bridges and RWAs: Safer bridging architectures and the growth of tokenized real-world assets on Solana expand the total addressable market and institutional relevance.
The UAE Vector: Why Location Matters
The decision to anchor a Solana treasury in the UAE amplifies several advantages:
• Regulatory clarity: Entities can obtain approvals and operate with predictable oversight, facilitating custody, staking, and DeFi participation at institutional scale.
• Geographic diversification: Reduces dependence on US and EU regulatory cycles, creating a global liquidity map that supports 24/7 markets.
• Access to sovereign and family office capital: The region’s investor base is comfortable with alternative assets, infrastructure, and frontier technologies, making Solana’s high-throughput narrative particularly compelling.
• Talent and infrastructure: The UAE’s growing fintech and crypto workforce supports operational resilience for treasury and market activities.
Risk Factors and What Could Go Wrong
No thesis is complete without acknowledging risk:
• Regulatory shifts: Unexpected adverse rulings in key jurisdictions, or delays/denials around ETFs, could dampen flows and sentiment.
• Network incidents: Performance degradation or security issues would hurt adoption narratives and compress multiples.
• Liquidity shocks: If derivatives positioning becomes crowded, a deleveraging event could trigger cascading liquidations. Watch funding, OI, and CVI-like measures.
• Macro correlation: A sharp risk-off in global markets—driven by rates, growth scares, or geopolitical events—can compress crypto valuations, including SOL, even amid strong fundamentals.
• Competitive pressure: Advances from competing L1s or L2s, especially around modular architectures and data availability, could siphon developer and liquidity attention.
Signals to Track in the Coming Months
For investors and observers, keep an eye on:
• ETF decision timelines: Not just for SOL, but for broader crypto products. Watch S-1 updates, surveillance-sharing agreements, and authorized participant rosters.
• On-chain metrics: Daily active addresses, fee revenue, transaction success rates, and validator participation. Sustained growth here supports the fundamental re-rating.
• Derivatives health: Funding rates, options IV, skew, and term structure. Healthy markets allow trends to persist without disorderly squeezes.
• Treasury disclosures: Any public filings, attestations, or wallet monitoring from Solmate and similar entities. Evidence of steady accumulation bolsters the thesis.
• Ecosystem catalysts: Major app launches, RWA integrations, payments partnerships, and mobile distribution wins (e.g., Saga ecosystem) that translate to real usage.
Strategy Considerations for Different Participants
• Long-only funds: Dollar-cost averaging with disciplined rebalancing can mitigate timing risk. Consider partial hedges around known catalysts to manage drawdowns.
• Crypto-native funds: Use options to express directional views while capping tail risk. Calendar call spreads around ETF windows or ecosystem launches can be capital-efficient.
• Corporates and treasuries: For those inspired by Solmate’s model, start with staking policies, custody/vendor selection, and risk dashboards. Establish governance before deploying into DeFi strategies.
• Retail participants: Avoid over-leverage. Respect invalidation levels and maintain a cash buffer. Focus on time in market rather than perfect entries.
•
Why This Cycle Is Different for Solana
Cycles rhyme, but specific drivers evolve. For SOL, three differentiators stand out:
• Real usage at scale: Consumer-grade apps processing real volumes, with fee revenues that matter.
• Institutional-grade infrastructure: Custody, staking-as-a-service, credit lines, and compliance tooling that make large allocations feasible.
• Global capital alignment: The UAE initiative symbolizes a broader dispersion of crypto capital formation—less dependent on any single regulator or geography.
The Road to ATH and Beyond
Reclaiming all-time highs requires both narrative strength and structural support. Solana’s current setup has:
• Narrative: High-throughput chain powering next-gen consumer and financial apps, now validated by serious capital allocators.
• Structure: Disciplined treasury formation, institutional flows, deepening derivatives, and growing on-chain revenues.
A move to fresh ATHs could unfold in stages:
1. Clearance of major resistance with rising spot volume
2. Healthy consolidation with elevated but not extreme funding
3. Fresh leg higher fueled by ecosystem beta and positive macro catalysts (ETF approvals, corporate adoption)
4. Volatility expansion near psychological round numbers, followed by a volatility contraction if treasuries and market makers absorb flows
If these stages play out with controlled leverage and robust spot participation, the path toward $300+ becomes more than aspirational—it becomes a function of order flow and narrative reflexivity.
Bottom Line
• Solmate’s $300 million launch to build a Solana treasury in the UAE is a landmark institutional milestone that could catalyze regional and global capital into SOL and its ecosystem.
• Institutional players like Forward Industries are signaling a pronounced shift toward Solana, reinforcing a buying frenzy dynamic supported by liquidity and execution improvements.
• The likely approval of multiple crypto ETFs later this year is a macro tailwind that indirectly benefits SOL, even before any Solana-specific ETF comes to market.
• Technicals align with fundamentals: higher lows, constructive volume, favorable moving averages, and bullish momentum patterns support the case for an ATH retest and potential breakout toward $300+.
• Risks remain—regulatory, network, liquidity—but the balance of probabilities currently favors continued upside as on-chain usage, institutional infrastructure, and global capital alignment strengthen.
As always, this is not financial advice. Markets are volatile, and conditions can change quickly. But with treasury formation ramping, institutional flows accelerating, and technicals confirming, Solana’s next chapter is setting up to be its most consequential yet. If the current trajectory holds—anchored by the UAE treasury initiative and sustained by institutional adoption—SOL’s bid for new all-time highs and beyond looks not just plausible, but increasingly likely.

SOLANA (SOL/USDT) – TP: 170 - 252 & 295SOLANA (SOL/USDT) is currently trading at $130.17 after rebounding from a well-defined sell-side liquidity zone between $98 and $131. The recent weekly candle shows a strong bullish recovery (+22.93%), suggesting that liquidity has been swept and buyers are stepping in. This level has historically served as a key accumulation zone, and the bounce aligns with oversold conditions on the StochRSI, which is now curling upward — indicating growing bullish momentum. If price sustains above the $125–131 level, the next immediate upside target lies between $170 and $188, where prior supply and consolidation occurred. A confirmed breakout above this range opens the path toward a higher resistance zone between $254 and $295 — a region that aligns with unfilled inefficiencies and previous price distribution.
The ideal swing trade approach would be to enter on a pullback within the $110–125 range, set a stop loss below $98, and scale out at the $170 and $254 levels. This setup offers a favorable risk-to-reward ratio of approximately 1:3.5.
Trade Strategy Suggestion (Swing or Positional):
Entry: Ladder between $115–$125 on retrace
SL: $105–110 (below wick low)
TP1: $170–188
TP2: $254–295
Scaling Out: 50% at TG1, rest at TG2 or trail stops above $200
With macro tailwinds like renewed interest in Solana’s DeFi and meme coin ecosystems, institutional flow returning, and technical confirmation across multiple timeframes, this could be a high-conviction mid-term play for swing traders and positional investors alike.
🔮 Narrative & Fundamentals:
ETH L2 congestion → SOL gets transactional inflows
SOL’s DeFi, NFT, and memecoin activity resurging (e.g., SEED_WANDERIN_JIMZIP900:WIF , SEED_DONKEYDAN_MARKET_CAP:BONK ecosystem)
Institutional flow picking up (Grayscale SOL trust rallying)
SOL remains one of the fastest L1s with growing developer traction

Solana - The future is clear!🎯Solana ( CRYPTO:SOLUSD ) breaks out soon:
🔎Analysis summary:
Solana is currently trading at the exact same level as it was about four years ago. In the meantime we witnessed crazy corrections and parabolic rallies, leading to another all time high retest. Quite likely therefore that Solana will break the previous all time high in the near future.
📝Levels to watch:
$250
SwingTraderPhil
SwingTrading.Simplified. | Investing.Simplified. | #LONGTERMVISION

Solana is trading around $207-208, showing strong growth.1. Current dynamics
Solana is trading around $207–208, showing steady growth. During the last day, the price has added about 0.5–0.7%, with a weekly gain of about +8%.
2. General technical picture
On timeframes from 1 hour to a month, SOL receives a general “Strong Buy” signal; the pace slows down only on the minute chart.
Indicators confirm: RSI — ~62 (Buy), MACD — Buy, ADX shows a strengthening trend — also Buy.
3. Fundamental levels and scenarios according to TipRanks
The price is above MA100 and MA200, which forms a stable bullish base. However, the price is below EMA20, the signal is Sell, while EMA50 supports Buy.
Pivot points (pivot) approximately:
Support: $177-182
Resistance: $187-200
4. Short-term driver
SOL is trading around $204, forming a triple top at $210.
Breaking this resistance can lead to +10% growth, with targets at $218-$228, and then to $250.
Current indicators: RSI - ~67 (bullish), MACD - confirms bullish momentum.
5. Trading activity review
SOL is trading with a volume of about $7.2-7.7 billion. Market capitalization is about $112 billion.

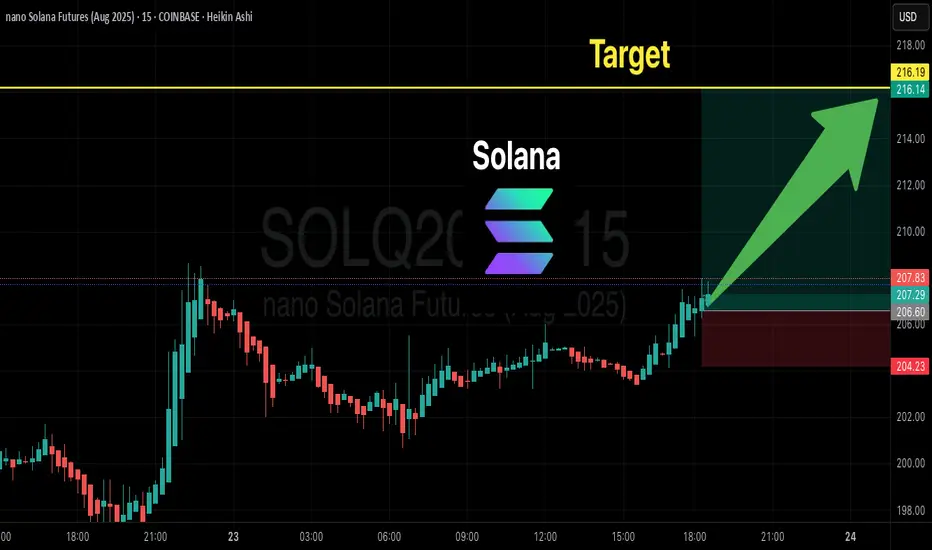
SOLANA (SOL) Ready for Takeoff? | Bullish Trade Setup to $216🚀 SOL (Solana) Crypto Trade Setup – Aug 23, 2025 🚀
🔎 Market Direction
✅ Bias: Mildly Bullish → Price holding above key MAs (EMA9/EMA21/SMA20/SMA50).
⚠️ Caution: Momentum weakening + missing OI data → need tape confirmation (volume/OI).
📊 TRADE DETAILS (Quick View)
🎯 Instrument: SOL
📈 Direction: LONG
💵 Entry: 198.0
🛑 SL: 182.0
🎯 TP: 216.0 (with scaling)
📊 Size: 0.25
💪 Confidence: 70%
⏰ Timing: Market Open
🕒 Signal Time: 2025-08-23 17:09:22
Solana shows weak growth of +0.12%,Short-term support and resistance levels
Main resistance: $200 — SOL has already bounced off this mark, confirming its importance.
Support: $172 — a key zone where a reversal occurred earlier in early August.
Analytical review and scenarios for today
Financial sources indicate that SOL has turned bearish from $200, forming a "Bearish Engulfing" pattern. A pullback to $172 is possible.
Other forecasts believe that SOL is testing resistance at $188-190, and if broken, it may aim for $210-225.
Futures volume and open interest have grown significantly, indicating accumulating institutional interest and support for bullish dynamics.
Overview of other scenarios: technically, SOL is still neutral — mixed signals, but positive on-chain dynamics (for example, TVL) remain.

Solana: $178 Holds - Next Step To $200+📈 Solana (SOL/USD) – Technical Review — August 2025
- Support at $178 (20-day EMA) is keeping the price from falling. A rebound from this zone provided growth to $190-195. The current price is around $193.
- Technical “Buy” signals: Bitget is a pure BUY on the daily chart (13 Buy vs 4 Sell), TipRanks — Strong Buy, TradingView — Buy (weekly and monthly timeframes).
- Market volumes and dynamics: Growing trading volumes and maintaining upward dynamics confirm the upward momentum.
- Next growth targets: the nearest resistance is $200-205. A breakout of this range will open the way to an extension of the movement to the $220-250 area.
Conclusion: SOL is showing a solid bullish trend. Key area to watch is $178-$180: holding above confirms upside potential to $200+. Breakout of $200 will open the way to new highs.
Recommendation:
- Buy on dip: rebound from $178
- Buy breakout: on volume breakout of $200
- Stop-loss: can be placed below $178
- Targets: $200 → $220 → $250

Solana - Don't miss it General background and conclusions
Solana is showing a pre-split state - neutral with an upward slope, holding above MA-200 and receiving confirmation from structural patterns.
Technical signals point to the importance of the $188 level: its breakout will open the way to $200-206 and potentially to $247.
In the short term, growth to $180 is possible if the direction is confirmed.
In the absence of volumes and strength, a downward movement to the lower support of $160 and further is possible.
Recommendations
Strategy "buy on breakout": entry at the close and holding above $188 with a target of $200-206. Alternative: buy on dip to $160 in case of a technical rebound.
Stop loss: it is reasonable to place it just below $160.
Additional monitoring: It is important to monitor the dynamics of volumes, price behavior around $188, as well as the development of fundamental drivers (ETF, Firedancer, etc.) in order to clarify the movement scenario.
