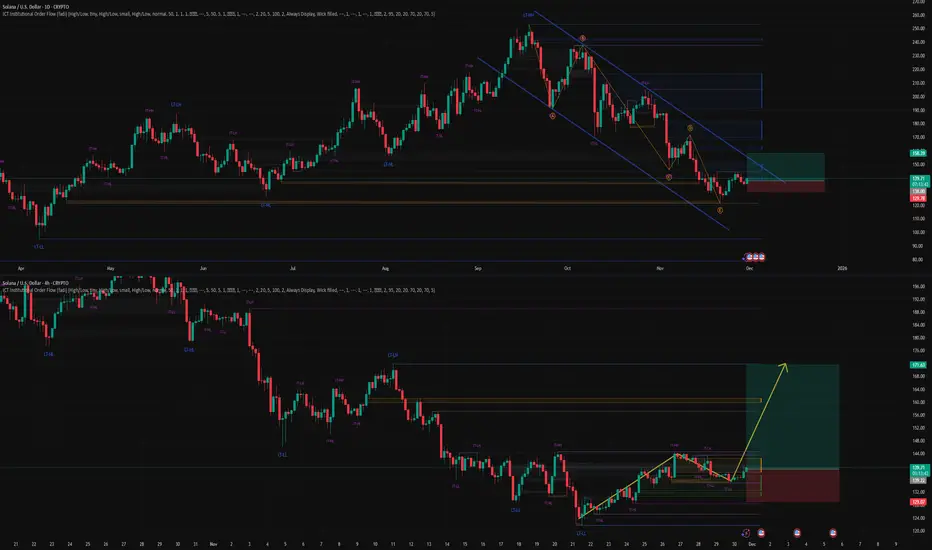
Solana: Edging HigherSOL has edged slightly higher, but remains well within our green Target Zone ($155.80 – $113.20). If it hasn’t already, the altcoin is expected to establish the low for wave ii in orange within this range before turning higher. The subsequent wave iii in orange should then drive price above the resistance levels at $249.68 and $295.31.
Solanalysis

SOLANA: Wave energy on the brink of a new movementSOLANA: Wave energy on the brink of a new movement
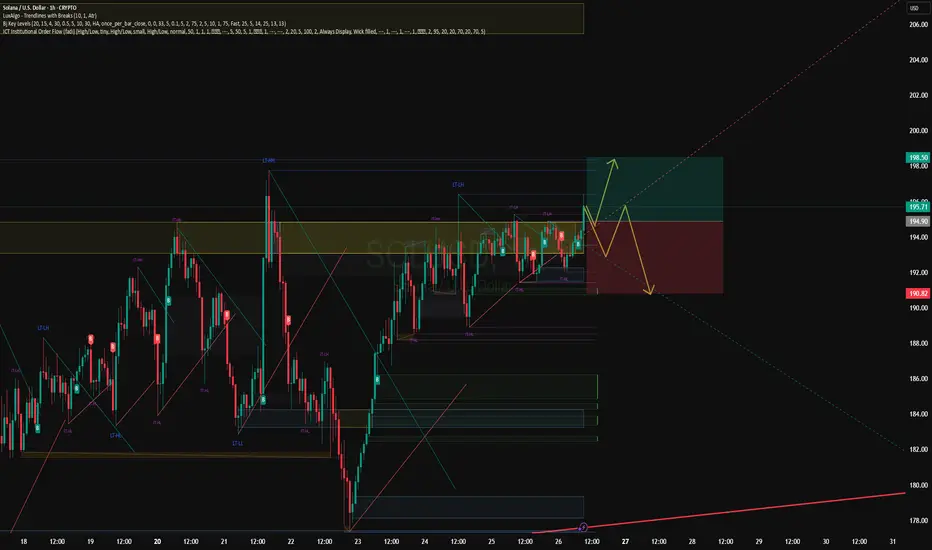
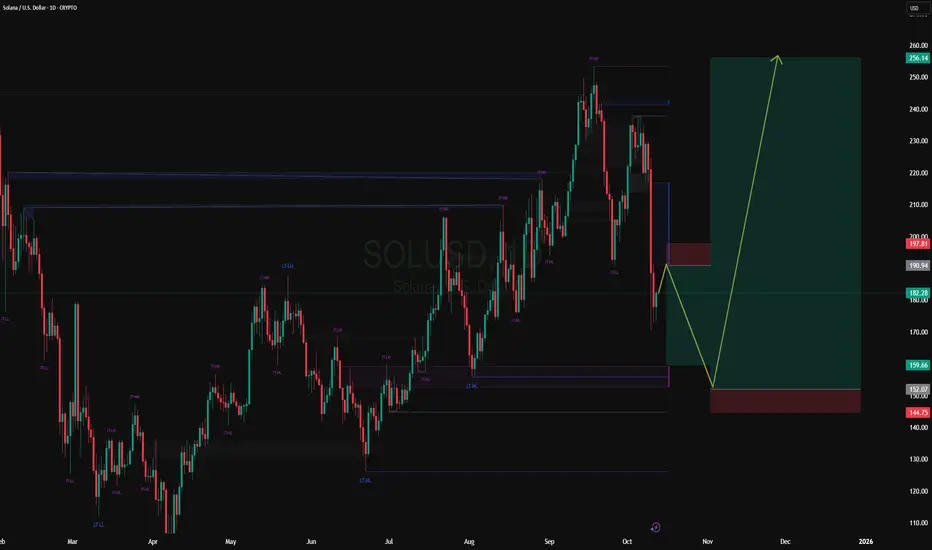
SOLANA Wave Overview (D1 and H4)
As a trader who has been practicing wave analysis for over ten years, I note that the current Solana structure demonstrates the completion of an extended corrective formation and the potential for a new impulse to emerge.
Chart D1: The global picture indicates that the market is completing a sideways phase. The wave structure appears to be the end of a corrective sequence, which serves as the foundation for the next trend move.
Chart H4: Local dynamics confirm the formation of key entry points. Here, the first signs of an emerging impulse are visible, which could mark the beginning of a larger wave.
Main Scenario
After the completion of the corrective phase, a descending impulse sequence is expected to develop. This movement will be accompanied by increased seller activity and a gradual shift in priority to the downside.
Alternative Scenario
If the price holds above recent highs and forms a stable upward impulse structure, the priority will shift to continued growth. In this case, the correction will be considered incomplete, and Solana may show an additional rebound.
Trading Idea
Conservative approach: wait for confirmation of a breakout of key levels and enter with the trend.
Aggressive approach: use local impulses on H4 for earlier entries, but with tight stops.
In both cases, it is important to maintain strict risk management and adjust the plan as new impulses emerge.
Results
Solana is at the transition point between a correction and a new impulse. The wave structure on D1 and H4 provides clear guidelines for action: watch for confirmation of the scenario and act with discipline.

FireHoseReel | All Eyes on Solana at This Critical Level🔥 Welcome to FireHoseReel!
Let’s jump into the Solana (SOL) market structure.
👀 SOL – 4H Overview
After breaking its descending curve structure, SOL faced strong resistance at $144 but failed to break it, leading to a sharp rejection.
Price then formed a double bottom and pushed back toward the same resistance. SOL is now trading near this critical zone once again.
📊 Volume Analysis
Volume increased significantly during the formation of the double bottom, driving a sharp move back toward resistance.
If buy volume remains sustained, the probability of a breakout above $144 increases.
✍️ SOL Trading Scenarios
You can use the following scenarios alongside your own trading strategy:
🟢 Long Scenario (Breakout Setup)
A confirmed breakout above $144, supported by a strong increase in buy volume, could provide a solid long opportunity on SOL.
🟢 Long Scenario (Aggressive Risk Setup)
Wait for price to consolidate, then enter during the pullback with decreasing volume, followed by the first signs of renewed buying pressure.
This setup allows for a tighter stop-loss and faster R:R, suitable for higher-risk traders.
🔴 Short Scenario
A loss of the key support at $124, accompanied by strong sell pressure, could activate a valid short setup for SOL.
❤️ Risk Management & Emotional Discipline
Crypto trading is highly risky. Without proper risk management and emotional control, trading is no different from gambling.
Logic must always come before emotions. Learn to manage your trades, and enjoy the process of trading with control and discipline.

SOLANA: Wave Energy on the Threshold of ImpulseSOLANA: Wave Energy on the Threshold of Impulse
Based on the current wave structure, Solana is completing its corrective phase and preparing to form a new movement. The chart shows a transition from sideways momentum to a more pronounced impulse, which could set the direction for the near term.
Primary scenario: After the correction ends, a downward impulse sequence is expected to develop. Alternative scenario: If the market consolidates above recent highs, it could continue to rise, delaying the start of a new downward wave.
Idea for traders: Watch for confirmation of the structure on lower timeframes and enter only after clear reversal signals appear.
Risk management: Use clear stop levels and adjust your plan as new impulses emerge.
Friends, more wave analysis is available in our profile.
Subscribe to stay up to date with wave analysis!
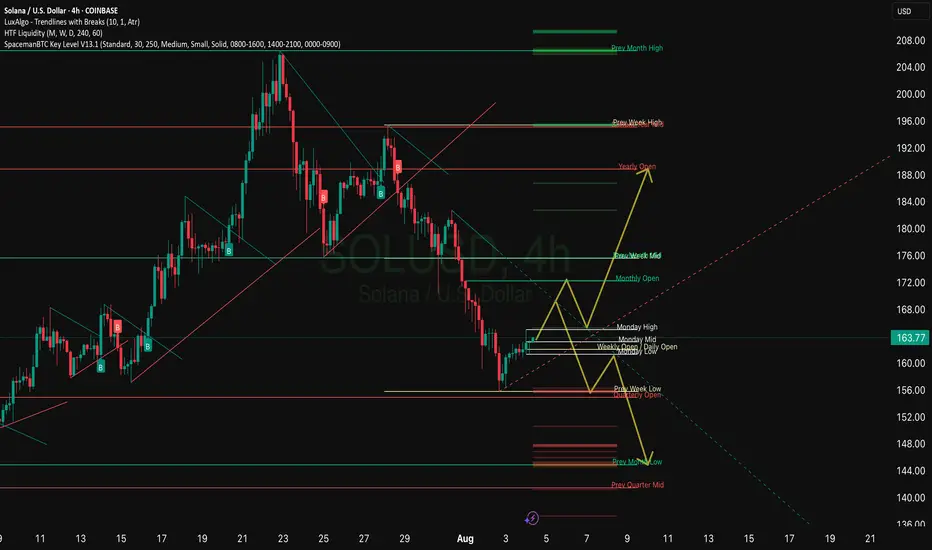
SOL Short 1D Rebalancing the bearish inefficiency is likely to lead to further development of the downward movement.

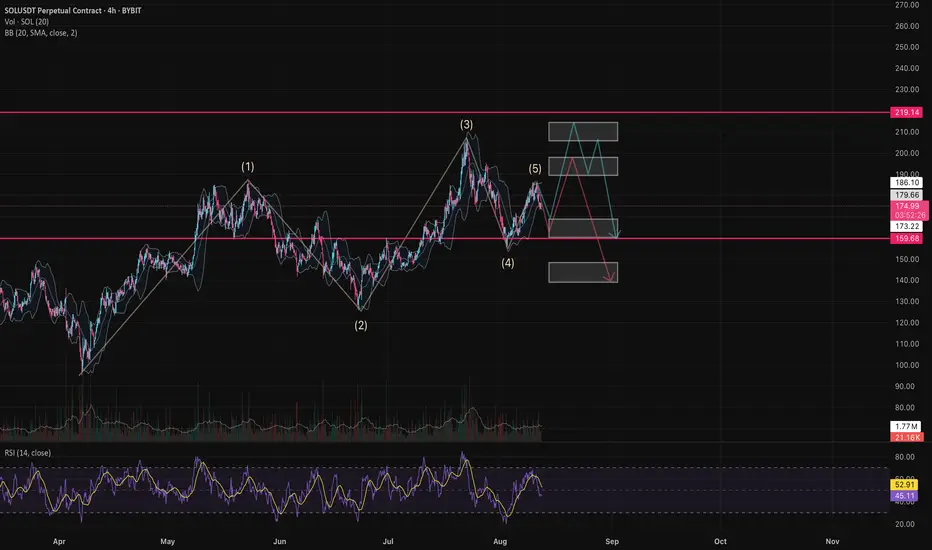
SOLANA: The last wave before takeoff or a deep pullbackSOLANA: The last wave before takeoff or a deep pullback
📈 Weekly Scenarios
Bullish scenario: SOL holds above ~$190, breaks through ~$260.83 → start of uptrend → target ~$300+.
Consolidation: price trades between ~$190 and ~$260, wave structure not defined until breakout.
Bearish scenario: breakout of support at ~$190 with volume → likelihood of a significant correction to ~$150–$160.
✅ Conclusion
Solana is at a key decision point for the coming week:
The ~$260.83 level is a benchmark for a bullish resumption.
The ~$190 level is a critical support level.
A breakout upward will provide upward momentum; a breakout downwards is likely a pullback. Follow price reactions at the highlighted levels and confirmation of the wave structure before making trading decisions.

Solana (SOL): Wave 5 Starting or Set to Crash?Solana (SOL): Wave 5 Starting or Set to Crash?
Weekly Scenarios
Bullish scenario: SOL holds support at ~$197, then breaks through ~$260.83 → possible rise to ~$300+.
Consolidation: The price trades in the ~$197–$260 range without a clear direction, preparing for momentum.
Bearish scenario: A breakout below ~$183 with volume → possible correction to ~$174 and below.
✅ Conclusion
Weekly analysis shows: SOL is at a crossroads.
A hold of support near ~$197 and a break of resistance at ~$260.83 could trigger a new uptrend.
However, a breakout below ~$183 significantly increases the risk of a correction.
Monitor the wave structure, volatility levels, and volume confirmation before choosing a strategy.
SOLANA (SOL): Wave 5 awaits – upward momentum or bear trap?SOLANA (SOL): Wave 5 awaits – upward momentum or bear trap?
Weekly Scenarios
Bullish scenario: Price holds the ~$185-190 zone, breaks resistance at ~$260 → wave 5 starts up, target is approximately ~$300+.
Consolidation: Price moves in the ~$185-260 range without a significant breakout; energy is accumulating, waiting for a signal.
Bearish scenario: Break of support at ~$185 with volume → confirmation of the start of wave C correction → possible decline to ~$150-160.
✅ Conclusion
On the weekly timeframe, SOL is at a crossroads:
If it holds above ~$185 and manages to break ~$260, the chance of a strong rally increases.
If support fails to hold, the risk of a correction remains. Traders should watch for price reaction on levels, volume, and confirmation of wave structure before taking a position.

Solana Scenarios for the monthMonthly Scenarios
Bullish Scenario
SOL holds support in the $180-$184 range and breaks above $184-$190.
This will provide impetus to targets in the $230-$300+ range, especially if the market turns out favorable and there is positive news regarding SOL/ETF/on-chain activity.
Consolidation/Sideways
The price may remain stuck in the $180-$190 range without a clear direction, especially with light volume.
In this scenario, it is important to monitor reactions at the range boundaries.
Bearish Scenario
If SOL breaks below $180-$184 with volume, a decline to the lower support level of $143-$153 or even lower is possible.
Such a correction could serve as a "normalization" after a significant rise.
✅ Conclusion
The current monthly trend for SOL appears generally bullish, with strong potential for continued growth upon a breakout of resistance.
But the key area to watch is the $184–190 zone: if there's a breakout with volume, we expect an upward acceleration.
The $180 and especially $153–143 support zones are areas to monitor for trend stability.
The CoinCodex forecast (~3-5%) suggests moderate growth, but with the potential for strong momentum under favorable conditions.
Solana Weekly Forecast and ScenariosWeekly Forecast and Scenarios
Bullish scenario: SOL holds support near $200–$210 and breaks through the $245–$250 zone, leading to a directional move toward $270 and beyond (even to $300).
Consolidation: The price may fluctuate within the $200–$245 range, awaiting volume and news, without a clear trend.
Bearish scenario: A breakout from the support range (below ~$188–$200) could lead to a pullback to lower levels of $170–$180.
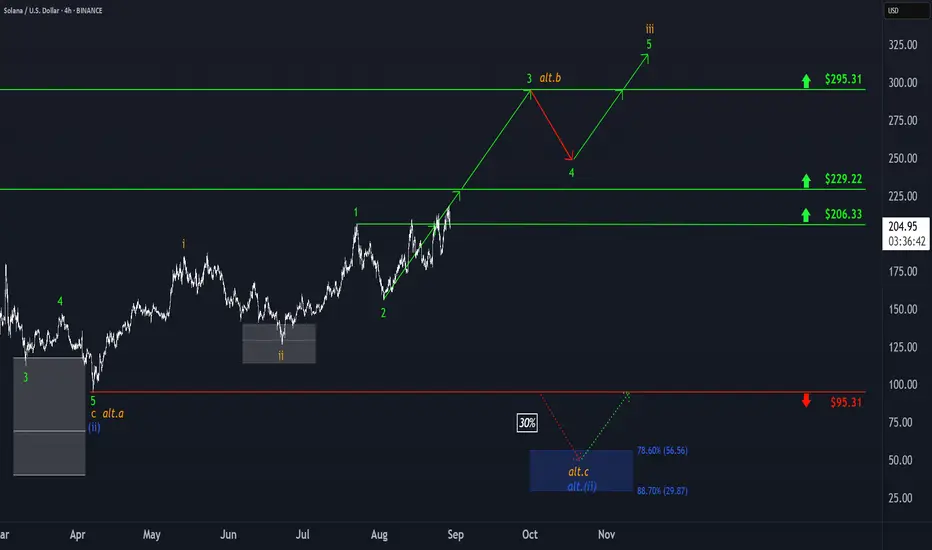
Solana: Stay the Course!Solana started the week with a sharp pullback but quickly bounced back, breaking through resistance at $206.33 for the third time in just two weeks. Our primary outlook points to another push higher, with price expected to clear resistance at $229.22 and complete the ongoing green wave 3 near $295.31. From there, the broader green five-wave sequence should ultimately break above this level and finish the larger orange wave iii. We still assign a 30% probability to the alternative scenario, which calls for a fresh wave (ii) correction low within the blue downside Target Zone between $56.56 and $29.87.
Solana is trading around $207-208, showing strong growth.1. Current dynamics
Solana is trading around $207–208, showing steady growth. During the last day, the price has added about 0.5–0.7%, with a weekly gain of about +8%.
2. General technical picture
On timeframes from 1 hour to a month, SOL receives a general “Strong Buy” signal; the pace slows down only on the minute chart.
Indicators confirm: RSI — ~62 (Buy), MACD — Buy, ADX shows a strengthening trend — also Buy.
3. Fundamental levels and scenarios according to TipRanks
The price is above MA100 and MA200, which forms a stable bullish base. However, the price is below EMA20, the signal is Sell, while EMA50 supports Buy.
Pivot points (pivot) approximately:
Support: $177-182
Resistance: $187-200
4. Short-term driver
SOL is trading around $204, forming a triple top at $210.
Breaking this resistance can lead to +10% growth, with targets at $218-$228, and then to $250.
Current indicators: RSI - ~67 (bullish), MACD - confirms bullish momentum.
5. Trading activity review
SOL is trading with a volume of about $7.2-7.7 billion. Market capitalization is about $112 billion.

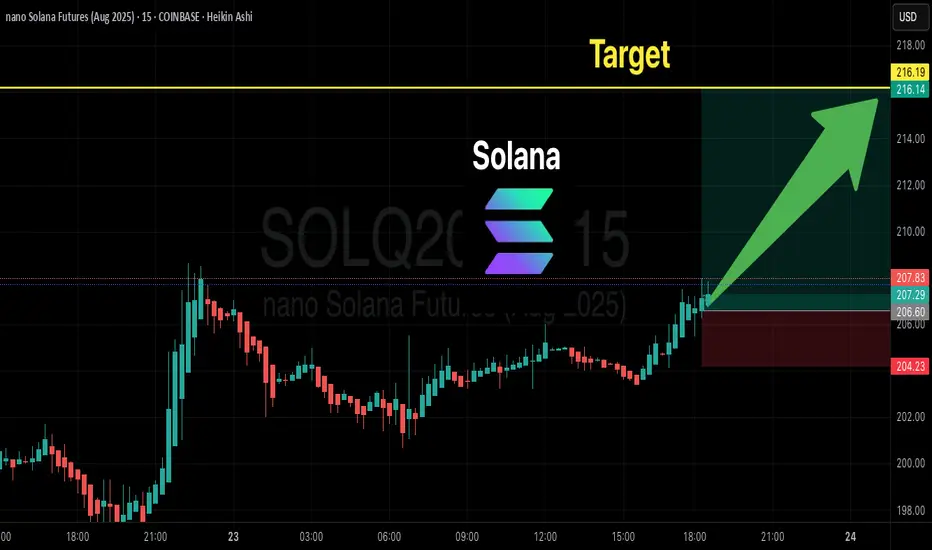
SOLANA (SOL) Ready for Takeoff? | Bullish Trade Setup to $216🚀 SOL (Solana) Crypto Trade Setup – Aug 23, 2025 🚀
🔎 Market Direction
✅ Bias: Mildly Bullish → Price holding above key MAs (EMA9/EMA21/SMA20/SMA50).
⚠️ Caution: Momentum weakening + missing OI data → need tape confirmation (volume/OI).
📊 TRADE DETAILS (Quick View)
🎯 Instrument: SOL
📈 Direction: LONG
💵 Entry: 198.0
🛑 SL: 182.0
🎯 TP: 216.0 (with scaling)
📊 Size: 0.25
💪 Confidence: 70%
⏰ Timing: Market Open
🕒 Signal Time: 2025-08-23 17:09:22
Solana shows weak growth of +0.12%,Short-term support and resistance levels
Main resistance: $200 — SOL has already bounced off this mark, confirming its importance.
Support: $172 — a key zone where a reversal occurred earlier in early August.
Analytical review and scenarios for today
Financial sources indicate that SOL has turned bearish from $200, forming a "Bearish Engulfing" pattern. A pullback to $172 is possible.
Other forecasts believe that SOL is testing resistance at $188-190, and if broken, it may aim for $210-225.
Futures volume and open interest have grown significantly, indicating accumulating institutional interest and support for bullish dynamics.
Overview of other scenarios: technically, SOL is still neutral — mixed signals, but positive on-chain dynamics (for example, TVL) remain.

Solana: $178 Holds - Next Step To $200+📈 Solana (SOL/USD) – Technical Review — August 2025
- Support at $178 (20-day EMA) is keeping the price from falling. A rebound from this zone provided growth to $190-195. The current price is around $193.
- Technical “Buy” signals: Bitget is a pure BUY on the daily chart (13 Buy vs 4 Sell), TipRanks — Strong Buy, TradingView — Buy (weekly and monthly timeframes).
- Market volumes and dynamics: Growing trading volumes and maintaining upward dynamics confirm the upward momentum.
- Next growth targets: the nearest resistance is $200-205. A breakout of this range will open the way to an extension of the movement to the $220-250 area.
Conclusion: SOL is showing a solid bullish trend. Key area to watch is $178-$180: holding above confirms upside potential to $200+. Breakout of $200 will open the way to new highs.
Recommendation:
- Buy on dip: rebound from $178
- Buy breakout: on volume breakout of $200
- Stop-loss: can be placed below $178
- Targets: $200 → $220 → $250

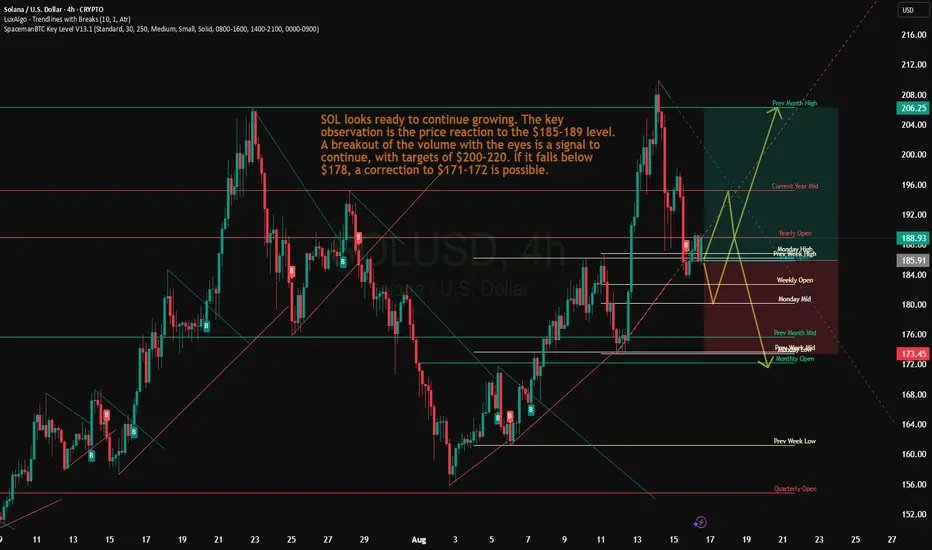
Solana: $178 to $200+ - The Next Level on the PathSOL/USD Technical Review
Support around $178 (20-day EMA) is holding the price, indicating high buying interest.
The key resistance level is $185–$189. A breakout of this range will open the way to targets of $200–206, possibly even $220 if the momentum continues.
Pattern formation: an upward reversal from the $160 zone (lower Bollinger band + Fibonacci) is recorded, which completes the ABC correction and launches a new wave impulse. Upside potential is towards $180.
Trend and on-chain indicators: a decrease in the balance on exchanges, an increase in TVL and growing institutional interest (ETF) create a solid base for moving higher.
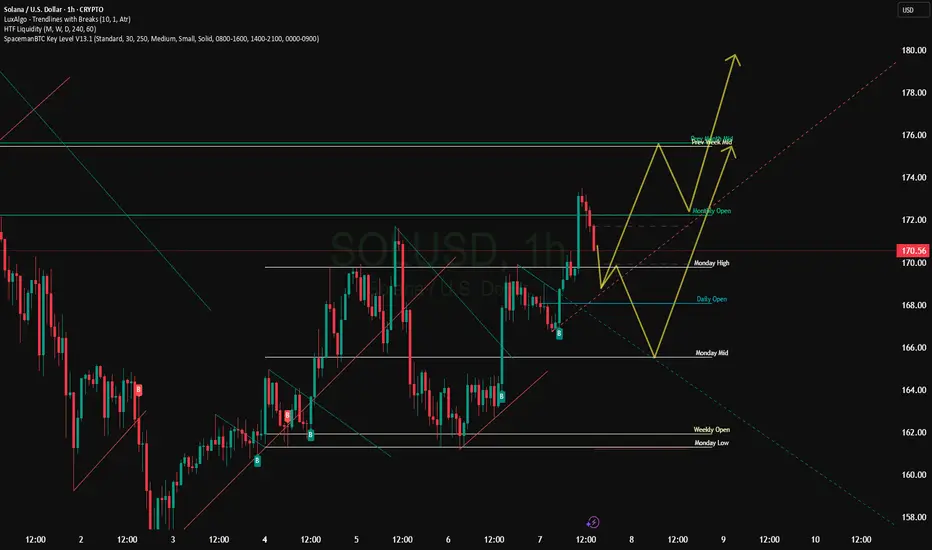
$SOL Weekly Analysis – Big Decision AheadFor Solana I’m expecting a correction into the 160–167 range. Either the fifth wave isn’t finished yet, or buyers have already spent most of their strength on the third wave and the correction phase has started, or we might still see an impulse up into the 190–199 range. On the chart, I’ve marked two possible scenarios for how the price could move.
I’ve also highlighted the key levels:
Bullish scenario : from 168, the price moves toward 220 (resistance level), and from there we could see a local correction back to 160–165.
Bearish scenario : the price is already in a correction phase and heading toward 140–145.
RSI points toward the bearish scenario, but if buyers show strength things can change.
Disclaimer: The author’s opinion may not align with yours.
BYBIT:SOLUSDT.P
Solana - The bullish background remains strongCurrent Technical Signals
SOL is trading around $180-$181, holding above the key 20-day EMA, which is around $178.25. A break below this level could open the way to support around $171.78, while holding above this level creates potential for a rise towards $186.40-$190.47.
A golden cross is forming between the 100- and 200-day EMAs on the daily chart - a classic bullish signal, strengthening the chances of a rise to $200.
Your network volume and balances on exchanges are showing a decline, which indicates a decrease in supply - easing pressure on the price and supporting bullish sentiment.
Support and Resistance
Support:
$178.25 (20‑EMA)
$171.78 — lower limit in weak market
The Currency analytics
Resistance:
$180–$190 zone — critical for further gains
Upper resistance at ~$200 — critical for rally continuation
Structural and Valuation Signals
A test of the daily bullish divergence on SOL indicates potential for further gains after correction.
SOL recently broke out of its ascending channel, indicating a possible reversal and the beginning of a new move higher.
Finance Feeds

Solana - Current Technical LandscapeCurrent Technical Landscape
Key Support Zone - 20-day EMA (~$178.25): SOL is trading around $180, and a break below this level could lead to a decline towards $171.78. On the other hand, a bounce back would open the way to the $186.40 and $190.47 areas.
Short-Term Weakness and Cooling Activity: Despite growing by over 40% in July, there is now a decline in on-chain activity:
Active Addresses Down 16%
DeFi TVL Down 8%
This could increase bearish pressure in the short term.
Resistance on the 4-hour chart: According to Seeking Alpha, SOL faces strong resistance at the 20-EMA (~$164.78) and below the 50/100-EMA zones (between $170.73 and $174.14), while the downtrend remains dominant.
Structure overview and signals
TipRanks indicators:
General recommendation: Sell
RSI (~43.05): Neutral
MACD: Buy
Stochastic RSI, Williams %R, CCI: Buy
MA 20/50/200: mostly Sell, except MA100 (was Buy)
TipRanks
Support and resistance by Pivot (TipRanks):
Pivot: $166.49
Support: $163.12, $158.24, $154.87
Resistance: $171.38, $174.74, $179.6
Solana definition of movementSOL is in a squeeze phase: the price is holding above $163, but meets resistance around $183-186. Indicators show neutral, slightly weak momentum. A break above $186 with increasing volumes will open up potential at $190+; a break below $178 will lead to a deeper correction to $171-170. Until then, it is worth watching the 20-d EMA hold and reactions to it.
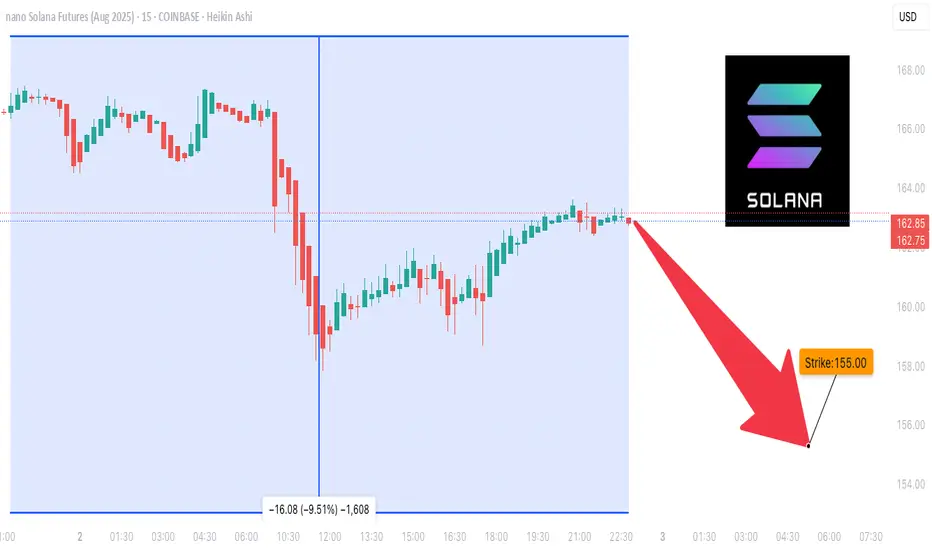
$SOL CRYPTO FUTURES SETUP – BEARISH BIAS (Aug 2, 2025)
🚨 **\ CRYPTOCAP:SOL CRYPTO FUTURES SETUP – BEARISH BIAS** (Aug 2, 2025) 🚨
Multi-Model AI Consensus | 🔻 Short Bias with Defined Risk
---
### 📉 **MARKET CONTEXT**
* **Current Price**: \$158.84
* 🔻 Trading below all key MAs:
* SMA20: \$178.72 (-11.1%)
* SMA50: \$161.29 (-1.5%)
* SMA200: \$162.06 (-2.0%)
* 🔻 Market Structure:
* **Death Cross** confirmed
* **Lower highs/lows** across all timeframes
* **-12.36%** drop over 5 days = capitulation signal
* 🔥 Liquidity Zone: **\$155.29** = key bounce OR breakdown level
* 📉 Volume declining = no buyer conviction
* 💣 Volatility High: BB Width = 26.2% of price (⚠️ Stop risk!)
---
### 🧠 **MULTI-TIMEFRAME MODEL SIGNALS**
**1-Hour**:
🟥 Bearish MACD, RSI \~39 (no reversal yet)
**4-Hour**:
🔻 Still trending down, no structure break
**Daily**:
⚠️ Death Cross active, must hold \$155.29
💡 Reclaim of \$162.06 = **bullish trigger**
---
### 🔬 **TECHNICAL INDICATOR SYNTHESIS**
* **RSI (14)**: 39.84 → nearing oversold
* **MACD**: Strong bearish momentum, no reversal
* **Bollinger Bands**: Price hugging lower band @ \$155.29
* **Volume**: Weak, no accumulation on dips
* **Funding Rate**: Neutral (0.0001%) = no squeeze setup
---
### 🔎 **TRADE SETUP (OA MODEL)**
🛑 **Direction**: SHORT
🎯 **Entry**: \$158.84
📉 **Target**: \$155.29
🛡️ **Stop**: \$161.29
💪 **Confidence**: 80%
🕰️ **Timing**: Market Open
🧠 Model Notes: Favoring momentum short w/ tight stop & fast exit
---
### ❌ **DS MODEL (No Trade)**
🟡 Recommends standing aside due to:
* Missing OI data
* Elevated volatility
* Lack of reversal OR divergence
---
### 🤖 **FINAL CONSENSUS**
🧠 **Models Agreed**: 2
📊 **Average Confidence**: 68%
📉 **Bias**: SHORT
📛 **Risk Level**: MODERATE
🚨 **Key Breakdown**: < \$155.29 = opens door to \$145
---
### ⚠️ **WATCH LEVELS**
* 📈 **Bull Trigger**: Close above \$162.06 (SMA200) + MACD cross
* 📉 **Bear Continuation**: Break < \$155.29 = fast drop to \$145
* 📌 **Optimal Long Setup**: RSI divergence + volume spike @ support
---
🧨 **RISK WARNING**: High volatility zone – futures carry liquidation risk >100%. Always use proper sizing and stops.
---
📢 #CryptoFutures #SOLUSDT #TradingView #AITradeSignal #BearishSetup #SolanaAnalysis #MultiModelConsensus
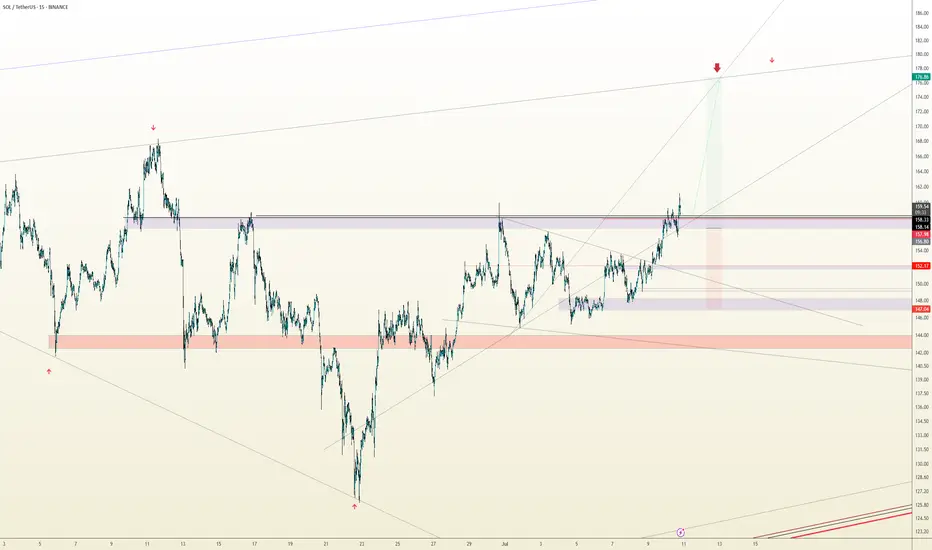
SOL/USDT Technical Outlook – Breakout Holding, Eyes on 175+Solana has successfully broken above the key resistance zone at $155–157 and is currently testing it as new support. If the level holds, this breakout could extend toward the next major target around $175–178.
📌 Key Insights:
Clean breakout followed by a potential SR flip
Watch for confirmation of support before continuation
Target aligns with previous swing high
Invalidated on breakdown below reclaimed level
🟢 Bias remains bullish as long as price holds above the breakout zone. A confirmed retest could provide a high-probability long setup.
Solana Breakdown Incoming? These Are Key Levels To WatchYello, Paradisers! Are you ready for the next major flush? After failing to gain momentum since the May double top breakdown, #SOL is now showing even more bearish signs, and the market might be about to punish late bulls one more time.
💎Following the confirmed double top in May, SOL has struggled to reclaim any upside momentum. Now, on the 12-hour chart, a classic head and shoulders formation is emerging, a pattern that often precedes larger trend reversals when the neckline breaks.
💎#SOLUSDT is hanging onto critical support between $142 and $140. This zone is the neckline, and it’s the last stand for bulls. If bears break it, we get a clear breakdown confirmation, with a clean path down toward $130–$127, which marks the first major demand area.
💎That initial support likely won’t hold for long. If pressure continues, SOL is expected to drop further toward the $115–$110 region. This is not just a technical support, it’s also the target area of the H&S formation, making it a magnet zone for price.
💎Adding to the bearish developments, a death cross has now been confirmed on the 12-hour chart. The EMA-50 has crossed below the EMA-200, reinforcing short-term downside pressure. Even if a relief bounce occurs, the $155 region, where the EMA-50 sits, will likely act as fresh resistance and attract renewed selling.
Paradisers, strive for consistency, not quick profits. Treat the market as a businessman, not as a gambler.
MyCryptoParadise
iFeel the success🌴
