SOLANA: Wave energy on the brink of a new movementSOLANA: Wave energy on the brink of a new movement
SOLANA Wave Overview (D1 and H4)
As a trader who has been practicing wave analysis for over ten years, I note that the current Solana structure demonstrates the completion of an extended corrective formation and the potential for a new impulse to emerge.
Chart D1: The global picture indicates that the market is completing a sideways phase. The wave structure appears to be the end of a corrective sequence, which serves as the foundation for the next trend move.
Chart H4: Local dynamics confirm the formation of key entry points. Here, the first signs of an emerging impulse are visible, which could mark the beginning of a larger wave.
Main Scenario
After the completion of the corrective phase, a descending impulse sequence is expected to develop. This movement will be accompanied by increased seller activity and a gradual shift in priority to the downside.
Alternative Scenario
If the price holds above recent highs and forms a stable upward impulse structure, the priority will shift to continued growth. In this case, the correction will be considered incomplete, and Solana may show an additional rebound.
Trading Idea
Conservative approach: wait for confirmation of a breakout of key levels and enter with the trend.
Aggressive approach: use local impulses on H4 for earlier entries, but with tight stops.
In both cases, it is important to maintain strict risk management and adjust the plan as new impulses emerge.
Results
Solana is at the transition point between a correction and a new impulse. The wave structure on D1 and H4 provides clear guidelines for action: watch for confirmation of the scenario and act with discipline.
Solanashort

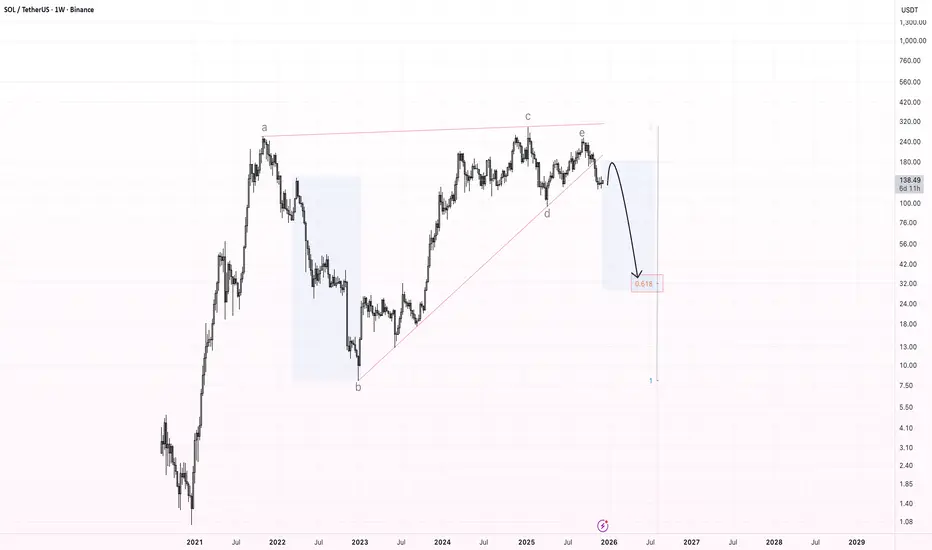
SOL – Bearish Rising Wedge Breakdown (Weekly Chart)The chart shows a large multi-year bearish rising wedge , which has now been broken to the downside. This wedge has been forming since the 2022 bottom and consists of clear wave structure (a–b–c–d–e), with the final wave e rejecting at the upper boundary and triggering the breakdown.
After this kind of pattern, the market often provides a relief bounce back into the broken support , which should now act as resistance . For SOL, the expected retest zone is located around $170–$190.
If price confirms resistance there, I expect the beginning of a larger downward wave , targeting the main Fibonacci zone near the 0.618 retracement, which aligns with a long-term target around $30–$40.
This zone marks the primary downside target for a full wedge breakdown.
Key Points:
Multi-year bearish rising wedge has broken.
Expected retest: $170–$190.
Major downside target: $30–$40 (0.618 zone).
Potential start of a macro corrective wave.
Solana vs USD – Bearish Playbook High-Probability Swing Setup🔹 Asset: SOL/USD – “SOLANA VS U.S. DOLLAR”
🔹 Trade Style: Crypto Market Opportunity Blueprint (Swing Trade)
🔻 Plan: Bearish Plan
📍 Entry Zone
You can enter at any price level according to your strategy and confirmation signals.
🛑 Stop Loss (SL)
This is Thief SL → @ 152.50
Dear Ladies & Gentleman (Thief OG’s), adjust your SL based on your own strategy & risk levels.
🔔 Important:
Place SL only after breakout confirmation.
I am not recommending to use only my SL. It’s your choice — you make money, you take money at your own risk.
🎯 Target (TP)
Market has strong support + oversold conditions + potential trap zones, so kindly exit with profits.
Our Target → @ 125.00
🔔 Important:
Dear Ladies & Gentleman (Thief OG’s), I am not recommending to use only my TP.
It’s your choice — you make money, you take money at your own risk.
📊 Related Pairs to Watch (Correlation Guide)
1️⃣ BITSTAMP:BTCUSD – Bitcoin
King of crypto; SOL often follows BTC’s direction.
If BTC breaks down, SOL bearish continuation becomes stronger.
2️⃣ BITSTAMP:ETHUSD – Ethereum
High correlation with major altcoins.
ETH weakness usually signals pressure on L1 chains like SOL.
3️⃣ COINBASE:AVAXUSD – Avalanche
Competitor L1 chain; often moves in similar sentiment flow.
If AVAX also shows bearish structure → confirms broad L1 weakness.
4️⃣ COINBASE:LTCUSD – Litecoin
Old major coin; used for risk-on/risk-off sentiment checks.
If LTC dumps → market-wide bearish confirmation.
5️⃣ CRYPTOCAP:TOTAL2 – Altcoin Market Cap
Measures overall altcoin health.
If TOTAL2 breaks its support → SOL likely accelerates toward bearish target.
🔍 Why These Pairs Matter? (Key Correlation Points)
BTC sets the tone – SOL follows the major trend 75–85% of the time.
ETH determines altcoin liquidity – if ETH dominance rises, SOL loses capital flow.
AVAX acts as sector correlation – L1 competitors weaken together during bearish cycles.
TOTAL2 confirms broad alt weakness, making SOL’s downside more reliable.

Don’t Trust the Twist — Solana’s Fall May PersistBe careful with Solana — the market might trick you into thinking a bullish reversal is forming.
In reality, the downtrend hasn’t finished yet.
A descending triangle is forming, and the breakout could be strongly to the downside.
🎯 Targets:
1️⃣ 164
2️⃣ 156
3️⃣ 138
❌ Invalidation: if price reaches the red zone marked on the chart
You will ask yourself "how did he know Sol would do that"?On Aug 30th I suggested that Sol was approaching my ideal buy zone at T2. I anticipated a bounce to my take profit target soon after. That played out perfectly.
Question remains...will T2 remain support? What do you think? I'd love to hear your thoughts.
May the trends be with you.

Solana shows weak growth of +0.12%,Short-term support and resistance levels
Main resistance: $200 — SOL has already bounced off this mark, confirming its importance.
Support: $172 — a key zone where a reversal occurred earlier in early August.
Analytical review and scenarios for today
Financial sources indicate that SOL has turned bearish from $200, forming a "Bearish Engulfing" pattern. A pullback to $172 is possible.
Other forecasts believe that SOL is testing resistance at $188-190, and if broken, it may aim for $210-225.
Futures volume and open interest have grown significantly, indicating accumulating institutional interest and support for bullish dynamics.
Overview of other scenarios: technically, SOL is still neutral — mixed signals, but positive on-chain dynamics (for example, TVL) remain.

$SOL CRYPTO FUTURES SETUP – BEARISH BIAS (Aug 2, 2025)
🚨 **\ CRYPTOCAP:SOL CRYPTO FUTURES SETUP – BEARISH BIAS** (Aug 2, 2025) 🚨
Multi-Model AI Consensus | 🔻 Short Bias with Defined Risk
---
### 📉 **MARKET CONTEXT**
* **Current Price**: \$158.84
* 🔻 Trading below all key MAs:
* SMA20: \$178.72 (-11.1%)
* SMA50: \$161.29 (-1.5%)
* SMA200: \$162.06 (-2.0%)
* 🔻 Market Structure:
* **Death Cross** confirmed
* **Lower highs/lows** across all timeframes
* **-12.36%** drop over 5 days = capitulation signal
* 🔥 Liquidity Zone: **\$155.29** = key bounce OR breakdown level
* 📉 Volume declining = no buyer conviction
* 💣 Volatility High: BB Width = 26.2% of price (⚠️ Stop risk!)
---
### 🧠 **MULTI-TIMEFRAME MODEL SIGNALS**
**1-Hour**:
🟥 Bearish MACD, RSI \~39 (no reversal yet)
**4-Hour**:
🔻 Still trending down, no structure break
**Daily**:
⚠️ Death Cross active, must hold \$155.29
💡 Reclaim of \$162.06 = **bullish trigger**
---
### 🔬 **TECHNICAL INDICATOR SYNTHESIS**
* **RSI (14)**: 39.84 → nearing oversold
* **MACD**: Strong bearish momentum, no reversal
* **Bollinger Bands**: Price hugging lower band @ \$155.29
* **Volume**: Weak, no accumulation on dips
* **Funding Rate**: Neutral (0.0001%) = no squeeze setup
---
### 🔎 **TRADE SETUP (OA MODEL)**
🛑 **Direction**: SHORT
🎯 **Entry**: \$158.84
📉 **Target**: \$155.29
🛡️ **Stop**: \$161.29
💪 **Confidence**: 80%
🕰️ **Timing**: Market Open
🧠 Model Notes: Favoring momentum short w/ tight stop & fast exit
---
### ❌ **DS MODEL (No Trade)**
🟡 Recommends standing aside due to:
* Missing OI data
* Elevated volatility
* Lack of reversal OR divergence
---
### 🤖 **FINAL CONSENSUS**
🧠 **Models Agreed**: 2
📊 **Average Confidence**: 68%
📉 **Bias**: SHORT
📛 **Risk Level**: MODERATE
🚨 **Key Breakdown**: < \$155.29 = opens door to \$145
---
### ⚠️ **WATCH LEVELS**
* 📈 **Bull Trigger**: Close above \$162.06 (SMA200) + MACD cross
* 📉 **Bear Continuation**: Break < \$155.29 = fast drop to \$145
* 📌 **Optimal Long Setup**: RSI divergence + volume spike @ support
---
🧨 **RISK WARNING**: High volatility zone – futures carry liquidation risk >100%. Always use proper sizing and stops.
---
📢 #CryptoFutures #SOLUSDT #TradingView #AITradeSignal #BearishSetup #SolanaAnalysis #MultiModelConsensus
SOLUSDTThis signal for bull-trend because breaked trendline and higher high higher low.
best entry: 154
stop: 136
traget: 226
SOL/USD in Clear Downtrend – Short Setup in PlayHi traders! , Analyzing SOL/USD on the 30-minute timeframe, price is currently moving within a defined descending channel, respecting lower highs and lower lows. A recent rejection from the channel top suggests continuation to the downside.
🔹 Entry: 150.09
🔹 Take Profit (TP): 145.47
🔹 Stop Loss (SL): 154.51
The price failed to hold above the 200 EMA and has resumed its downward trajectory. The RSI shows a recent bounce from overbought levels, supporting the bearish momentum. This short setup offers a favorable risk-reward ratio within the context of the broader downtrend.
A clean rejection at resistance and confirmation of the trendline add confluence to this trade idea. Keep an eye on the 145.47 zone, where buyers may attempt to defend the support.
⚠️ DISCLAIMER: This is not financial advice. Every trader is responsible for their own decisions and risk management.

Bearish Breakdown Alert: SOL Eyes $136.46 — Is $126.25 Next?The current SOLUSDT 4-hour chart reflects a strong bearish trend structure, supported by the price consistently respecting a descending channel. This channel has been intact for several weeks, and recent price action shows Solana approaching the upper boundary of this channel once again. Historically, this has acted as a sell zone, and unless there is a confirmed breakout, it remains a high-probability short setup.
Adding to the bearish sentiment is the Ichimoku Cloud. Price is currently trading beneath the cloud, and the cloud itself is shaded red and expanding, signaling ongoing bearish pressure. The Tenkan-sen (conversion line) has just crossed slightly above the price, but the Kijun-sen (base line) sits just above current levels, offering resistance. Most importantly, the Chikou Span (lagging line) is still below both the price and the cloud, which reinforces the idea that momentum remains on the downside.
Within this structure, a clean trade setup emerges:
• Entry: Around $143.87 (Kijun-sen + upper channel area)
• Stop Loss: $152.84 (above the cloud + upper trendline)
• Take Profit 1: $136.46 (mid-channel + local support)
• Take Profit 2: $126.25 (channel bottom)
Given the overall confluence of the bearish channel and Ichimoku resistance, any rejection from the $143–$144 area would support continuation toward the lower bounds of the trend. As always, watch for a strong bearish candle or wick rejection before entering to improve timing.

SOL final push downSOL is currently consolidating and building liquidity.
For a short position, we need to see a liquidity sweep into the supply zone, supported by the volume profile, followed by the price breaking below the 200-period EMA for final confirmation.

Solana Breaks Key Support Level: Is It Time to Sell...?Solana has recently broken through the critical support level of $180 on the daily timeframe, signaling potential further downside. Traders are now faced with whether to take a short position immediately or wait for a retest of the broken support.
For those looking to enter a short trade, the ideal entry zone lies between the $170 and $180 range. With this strategy, it’s recommended to place a stop-loss at $190 to limit potential losses. The primary target for this short trade would be the next major support level around $120, offering a substantial downside potential.
As with any trading decision, caution is advised. Waiting for a retest could offer a better risk-to-reward ratio while entering now, allowing you to capitalize on the initial drop. Stay alert to market movements and adjust your strategy accordingly.

I see a negative scenario for SOLANA, will we drop below $100?Hello everyone!
I want to warn those who have open LONG positions on #SOLANA. In the local perspective, we can expect a decrease in the asset down to $92.5 as a head and shoulders pattern has formed on the 1-hour and 4-hour timeframes.
The situation is also negative on the daily and weekly timeframes. Since the last local price high on February 14th, I have been seeing selling pressure. The week also started negatively.
However, the drop may not be as deep, as we have support in the form of the 200-EMA and the strong Fibonacci 0.236 level, which is at the round number of $100.
Therefore, I believe it would be wise for those trading with leverage to reduce their positions, and for those with extra funds to place buy orders at the following levels:
$100
$96
$92.5
In the global perspective, after this correction, I expect growth towards $150.
This is not financial advice, everything you do, you do at your own risk!

Solana Re-Distribution / February 18th Bottom, Bearish ScenarioThis is the potential bearish scenario getting ready to play out on Solana. In the stated case, February 18th would bring a spring on a larger re-accumulation

SOL SOLANA Trade IdeaSolana has recently broken structure on the 4 hour time frame. We are currently seeing a lower low and the trend bearish, possibly reaching for previous lows at 93.53 and 91.13. This idea is for educational purposes only and not to be construed as financial advice. #sol #solana #solusd

SOLUSDT - THE CORRECTION IS IMMINENT (TARGET $64)As Bitcoin has announced its breakout, it is clear to me that the general crypto market correction is happening. Solana will not be exempt. Here is my analysis:
What is on the chart? (follow the steps)
1) A daily FVG that serves as a support zone.
2) The descending trendline that is the main driver of this bearish analysis since it pushed price to form a daily descending triangle (employing the retail lingo so that everyone can understand).
3) Price wicking multiple times in the daily FVG confirming that it is indeed a 'support zone'.
4) A false breakout. This is the strongest short signal of the chart since it demonstrates how bulls failed to break the structure and pursue the rally.
5) A short structure setup which here just serves as a confirmation (I didn't personally enter there as I was waiting for BTC).
6) The imminent breakout that should be ruthless. These kind of corrections can make or break people. So I expect it to at least take out the $64 sellside level.
NOTE: Don't let it go to your head. If you are over exposed, just minimize your risk and take a break from the markets. You control your investments not the other way around.
As always, enjoy the rest of your day and happy trading!! ;)

SOL SOLANA Trade IdeaSOLANA has experienced recent downward pressure but is presently trading within a crucial support zone, as illustrated on the chart. In the event that the Dollar Index (DXY) sustains and strengthens its position, SOLANA might potentially move towards additional downside targets, given the typical inverse correlation between DXY and SOL. It is important to underscore that this analysis is offered solely for educational purposes and should not be interpreted as financial advice.

SOLUSD - MY BEARISH SCENARIO (TARGET $67)I'd like to first mention that the downward breakout is only justified IF Bitcoin does the same.
What do we see? (follow the steps)
1) The high that set the downtrend.
2) Price wicking in the daily FVG that will serve as our base ('support').
3) A false breakout that is a major bearish signal, paired with the fact that BTC is in my opinion bearish too.
4) A short structure with a low taken out and retracement within a bearish FVG (in this case a 4H structure).
5) The expected dump where BTC does too.
Hopefully you enjoyed this short analysis and I wish you a lovely day!
Happy trading!! ;)

Solana's correction!I've told you before that we'll see a correction in Solana price by hitting to the resistance level. Now you can see this correction. this correction can continue till the supporting levels. the first supporting level is 64$ and the another is 45$.

Solana is going to be risky!Now Solana is arriving to the first goal that is 77$. If you have caught profit, you can save it now. you can buy it again, if it crosses 77$ resistance level well.

SOL → Solana Double Top Reversal!? Are We Going to $40 or $80?Solana is struggling at Previous Resistance showing signs that a major reversal is near. If the price fails at this level and leaves a raging red bear candle, what does that mean for the next trade?
How do we trade this? 🤔
There are two ways to handle this chart, short scalp or wait to long. We cannot long at resistance, the Risk/Reward AND Probability are all bad, best to wait for a pullback to the 30EMA and look for a bounce. The RSI is above the Moving Average, but also over 61.00 and given the other data points, is weak evidence to support a long position.
It may be reasonable to short-scalp this chart with a 1:1 Risk/Reward Ratio, entering the market on a smaller timeframe of the 1HR or 4HR chart looking for a bear confirmation candle. Scalp to the $52.35 area then move your stop up to the entry price, take another profit somewhere below the Daily 30EMA or whenever you see a bull reversal bar. This trade has a lower probability on this chart because we technically don't have a bear confirmation candle, which is why I recommend playing a smaller timeframe for a scalp and maybe swing the rest.
Wait on the sidelines for a long. The Alt market is still relatively weak even though Bitcoin is showing some nice bullish price action, so we really need bullish confirmation candles to justify entering the market.
💡 Trade Idea 💡
Short Entry: $61.50
🟥 Stop Loss: $69.65
✅ Take Profit #1: $52.35
✅ Take Profit #2: $45.20
⚖️ Risk/Reward Ratio: 1:2
🔑 Key Takeaways 🔑
1. Breakout to Downside of Bull Channel, Bias to Short.
2. Bear Breakout, Watch for Sell Signal.
3. Potential Double Top at Previous Resistance.
4. Still Above 30EMA, Watch for Support.
5. RSI at 61.00, above Moving Average. Bias to Long.
⚠️ Risk Warning! ⚠️
Past performance is not necessarily indicative of future results. You are solely responsible for your trades. Trade at your own risk!
Like 👍 and comment if you found this analysis useful!

Solana Local Top PossibilityWhen things get trending on high time frames I am a big fan of line break charts. This one here on Solana has not yet confirmed red but RSI is very sus. Setting very tight stops on longs now. Also debating on scaling out of long term swing bags. Not advise, good luck.

SOLANA. BIG SHORT of SOLUSD
I am expecting a puncture of the annual triangle till white line, 41$ (approx)
Final target is red brick, around 2,5$.
Don't have an idea what will happen with Solana, but we know that there were some incidents.
Last year Solana hiked from 8$ to 32$ but i can't see growing interest.
I am seeing only many reports that whales are investing in it, made to confuse us.
