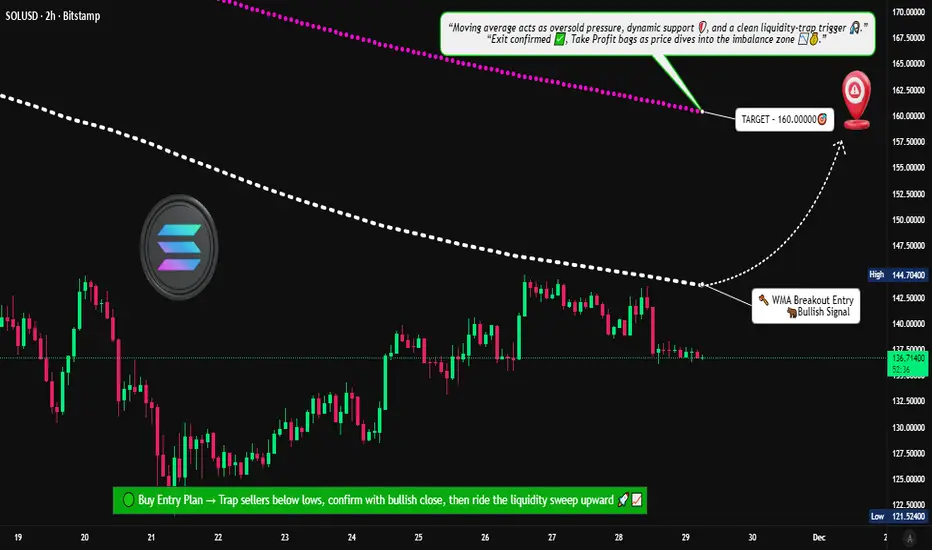
Is Solana Preparing for a New Upside Wave After WMA Breakout?📊 SOL/USD – “SOLANA VS U.S Dollar” Crypto Market Opportunity Blueprint (Swing Trade)
🟢 Trade Plan Overview
The bullish structure is confirmed after Weighted Moving Average (WMA) dynamic support breakout, signalling fresh momentum entering the market. This setup favors continuation as long as SOL holds above the breakout zone.
📌 Entry Zone
➡️ Entry: Any price level after the WMA breakout above 145.00000
The breakout + retest combination is your strongest confirmation. Let the chart validate the move—no rush entries.
🛡️ Stop Loss (Risk Protection)
➡️ Suggested SL: 132.50000
Dear Ladies & Gentlemen (Thief OG’s):
Use this SL only as a reference. Adjust based on your personal execution style, risk tolerance, and position size.
Place SL only after breakout confirmation — not before.
🎯 Profit Target
➡️ Target: 160.00000
Weighted moving averages are acting as dynamic resistance, and indicators show signs of potential overbought traps, so secure profits early instead of overstaying.
Dear Ladies & Gentlemen (Thief OG’s):
TP is your own choice. Lock in profits based on your comfort, not just my blueprint.
📚 Market Reasoning
WMA breakout shows renewed bullish strength.
Structure support aligned with higher-timeframe trend.
Volume expansion confirms buyers stepping in.
Resistance cluster around 160 remains the key zone to offload profits.
🔎 Related Pairs to Watch (Correlation & Key Notes)
💠 BITSTAMP:BTCUSD (Bitcoin)
High correlation with total crypto liquidity.
Strong BTC breakouts often pull SOL upward because altcoins follow BTC’s macro flow.
If BTC loses trend support, SOL setups weaken.
💠 BITSTAMP:ETHUSD (Ethereum)
ETH and SOL share similar Layer-1 ecosystem flows.
When ETH rallies aggressively, funds rotate into strong alts like SOL.
Good to use as a sentiment confirmation tool.
💠 COINBASE:ADAUSD (Cardano)
Another L1 competitor; correlated during broad alt-season pushes.
When ADA moves, retail interest usually spreads across L1s — including SOL.
💠 COINBASE:AVAXUSD (Avalanche)
Solana + Avalanche often move together during risk-on bursts.
AVAX momentum adds conviction to SOL’s breakout reliability.
💠 BINANCE:SOLBTC
The most important relative strength pair for SOL.
If SOLBTC is trending upward, SOL outperforms majors — huge confirmation signal for swing trades.
📈 Final Thoughts
This trade plan balances momentum, trend structure, and dynamic WMA confirmation. Follow the breakout logic, respect your risk, and let the chart guide your exits. The idea is designed to help traders act with clarity, control, and professional-level precision.
Solanasignals
SOLANA: Wave energy on the brink of a new movementSOLANA: Wave energy on the brink of a new movement
SOLANA Wave Overview (D1 and H4)
As a trader who has been practicing wave analysis for over ten years, I note that the current Solana structure demonstrates the completion of an extended corrective formation and the potential for a new impulse to emerge.
Chart D1: The global picture indicates that the market is completing a sideways phase. The wave structure appears to be the end of a corrective sequence, which serves as the foundation for the next trend move.
Chart H4: Local dynamics confirm the formation of key entry points. Here, the first signs of an emerging impulse are visible, which could mark the beginning of a larger wave.
Main Scenario
After the completion of the corrective phase, a descending impulse sequence is expected to develop. This movement will be accompanied by increased seller activity and a gradual shift in priority to the downside.
Alternative Scenario
If the price holds above recent highs and forms a stable upward impulse structure, the priority will shift to continued growth. In this case, the correction will be considered incomplete, and Solana may show an additional rebound.
Trading Idea
Conservative approach: wait for confirmation of a breakout of key levels and enter with the trend.
Aggressive approach: use local impulses on H4 for earlier entries, but with tight stops.
In both cases, it is important to maintain strict risk management and adjust the plan as new impulses emerge.
Results
Solana is at the transition point between a correction and a new impulse. The wave structure on D1 and H4 provides clear guidelines for action: watch for confirmation of the scenario and act with discipline.

Solana vs USD – Bearish Playbook High-Probability Swing Setup🔹 Asset: SOL/USD – “SOLANA VS U.S. DOLLAR”
🔹 Trade Style: Crypto Market Opportunity Blueprint (Swing Trade)
🔻 Plan: Bearish Plan
📍 Entry Zone
You can enter at any price level according to your strategy and confirmation signals.
🛑 Stop Loss (SL)
This is Thief SL → @ 152.50
Dear Ladies & Gentleman (Thief OG’s), adjust your SL based on your own strategy & risk levels.
🔔 Important:
Place SL only after breakout confirmation.
I am not recommending to use only my SL. It’s your choice — you make money, you take money at your own risk.
🎯 Target (TP)
Market has strong support + oversold conditions + potential trap zones, so kindly exit with profits.
Our Target → @ 125.00
🔔 Important:
Dear Ladies & Gentleman (Thief OG’s), I am not recommending to use only my TP.
It’s your choice — you make money, you take money at your own risk.
📊 Related Pairs to Watch (Correlation Guide)
1️⃣ BITSTAMP:BTCUSD – Bitcoin
King of crypto; SOL often follows BTC’s direction.
If BTC breaks down, SOL bearish continuation becomes stronger.
2️⃣ BITSTAMP:ETHUSD – Ethereum
High correlation with major altcoins.
ETH weakness usually signals pressure on L1 chains like SOL.
3️⃣ COINBASE:AVAXUSD – Avalanche
Competitor L1 chain; often moves in similar sentiment flow.
If AVAX also shows bearish structure → confirms broad L1 weakness.
4️⃣ COINBASE:LTCUSD – Litecoin
Old major coin; used for risk-on/risk-off sentiment checks.
If LTC dumps → market-wide bearish confirmation.
5️⃣ CRYPTOCAP:TOTAL2 – Altcoin Market Cap
Measures overall altcoin health.
If TOTAL2 breaks its support → SOL likely accelerates toward bearish target.
🔍 Why These Pairs Matter? (Key Correlation Points)
BTC sets the tone – SOL follows the major trend 75–85% of the time.
ETH determines altcoin liquidity – if ETH dominance rises, SOL loses capital flow.
AVAX acts as sector correlation – L1 competitors weaken together during bearish cycles.
TOTAL2 confirms broad alt weakness, making SOL’s downside more reliable.

SOLANA: Wave Energy on the Threshold of ImpulseSOLANA: Wave Energy on the Threshold of Impulse
Based on the current wave structure, Solana is completing its corrective phase and preparing to form a new movement. The chart shows a transition from sideways momentum to a more pronounced impulse, which could set the direction for the near term.
Primary scenario: After the correction ends, a downward impulse sequence is expected to develop. Alternative scenario: If the market consolidates above recent highs, it could continue to rise, delaying the start of a new downward wave.
Idea for traders: Watch for confirmation of the structure on lower timeframes and enter only after clear reversal signals appear.
Risk management: Use clear stop levels and adjust your plan as new impulses emerge.
Friends, more wave analysis is available in our profile.
Subscribe to stay up to date with wave analysis!
SOL Short 1D Rebalancing the bearish inefficiency is likely to lead to further development of the downward movement.

Solana: Bears are in Full ControlFenzoFx—Solana is up by 3.30% today, after the sharp decline on November 25. The daily candle of this date is a bearish engulfing, meaning the sellers are in control of the $171.70. This level has the highest volume spike level as shown on the chart.
The immediate resistance is at $171.70. From a technical perspective, the downtrend will likely resume if the price holds below this level. In this scenario, the next bearish target could be the sell-side liquidity at $137.60, followed by $126.00.

SOLANA entered into bearish territory, targeting $105.Solana (SOLUSD) closed last week below its 1W MA50 (blue trend-line) for the first time since July 28 2025. This is an extension of the downtrend that started following the September 15 High, which took place right below the Resistance Zone that started back on the November 2021 Cycle Top.
This is a critical Resistance as it rejected the price another 2 times during this Bull Cycle, with the most recent causing the January - April correction to the 1W MA200 (orange trend-line).
Given the huge 1W RSI Bearish Divergence for almost 2 years now (Lower Highs), we expect last week's closing below the 1W MA50 to initiate the bearish extension towards the 1W MA200 (at least) again. Our Target is $105.00.
---
** Please LIKE 👍, FOLLOW ✅, SHARE 🙌 and COMMENT ✍ if you enjoy this idea! Also share your ideas and charts in the comments section below! This is best way to keep it relevant, support us, keep the content here free and allow the idea to reach as many people as possible. **
---
💸💸💸💸💸💸
👇 👇 👇 👇 👇 👇

SOL Short SOL Short 📉
In the medium term, I am bearish.
Rebalancing the bearish inefficiency (POI) is likely to lead to continued aggressive markdowns, which can be used to open a short position.

SOLANA Pullback - DailyThis crypto coin has been bearish on the past few days, but it seems as it is a slight pullback towards the demand zone at 160 and 130, before it shoots upwards.
Let us wait and see if we can have a selling opportunities, aiming towards those zones.

SOLANA: The last wave before takeoff or a deep pullbackSOLANA: The last wave before takeoff or a deep pullback
📈 Weekly Scenarios
Bullish scenario: SOL holds above ~$190, breaks through ~$260.83 → start of uptrend → target ~$300+.
Consolidation: price trades between ~$190 and ~$260, wave structure not defined until breakout.
Bearish scenario: breakout of support at ~$190 with volume → likelihood of a significant correction to ~$150–$160.
✅ Conclusion
Solana is at a key decision point for the coming week:
The ~$260.83 level is a benchmark for a bullish resumption.
The ~$190 level is a critical support level.
A breakout upward will provide upward momentum; a breakout downwards is likely a pullback. Follow price reactions at the highlighted levels and confirmation of the wave structure before making trading decisions.

Bearish Pressure Builds Below $208FenzoFx—Solana's uptick momentum has been capped by the descending trendline, even though the price flipped above the $185.00 mark.
The daily chart shows long-wick bearish candles, indicating the selling pressure persists below the $208.00 resistance. From a technical perspective, the downtrend will likely resume if the price closes below the inverted fair value gap. In this scenario, SOLANA could decline toward the primary support at $172.00.
Please note that the bearish outlook should be invalidated if the price exceeds the $208.00 mark.

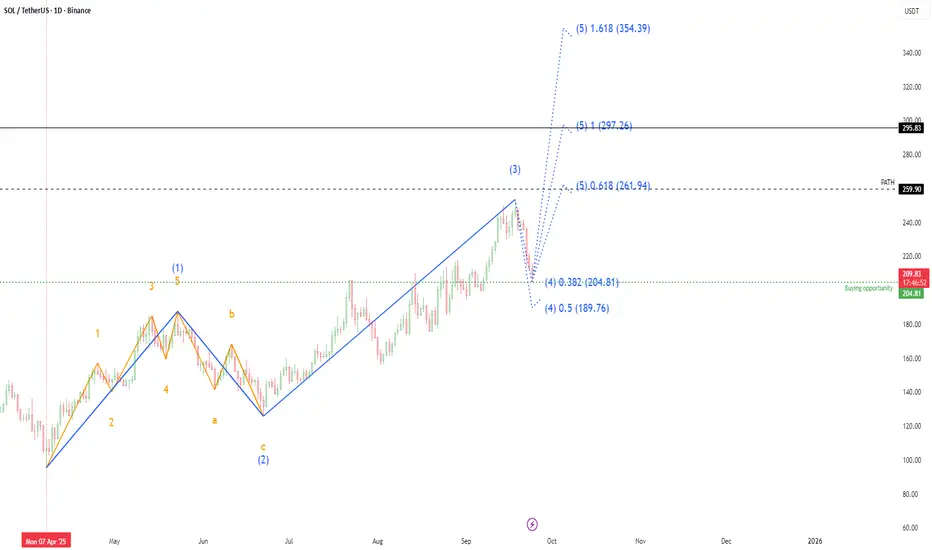
Solana (SOL): Wave 5 Starting or Set to Crash?Solana (SOL): Wave 5 Starting or Set to Crash?
Weekly Scenarios
Bullish scenario: SOL holds support at ~$197, then breaks through ~$260.83 → possible rise to ~$300+.
Consolidation: The price trades in the ~$197–$260 range without a clear direction, preparing for momentum.
Bearish scenario: A breakout below ~$183 with volume → possible correction to ~$174 and below.
✅ Conclusion
Weekly analysis shows: SOL is at a crossroads.
A hold of support near ~$197 and a break of resistance at ~$260.83 could trigger a new uptrend.
However, a breakout below ~$183 significantly increases the risk of a correction.
Monitor the wave structure, volatility levels, and volume confirmation before choosing a strategy.
Is Solana Ready for a Technical Breakout or Just a Fake Pump?🎯 SOL/USDT Wealth Strategy Map | The Gentleman Thief's Playbook 💎
📊 Market Overview
Asset: SOLANA/USDT (SOL/USDT)
Trading Style: Swing/Day Trade Hybrid
Market Sentiment: Bullish Pending Breakout Setup 🚀
🎭 The Setup (As Told by a Professional Thief)
Dear Ladies & Gentlemen, gather 'round for today's calculated heist...
🔓 The Entry Plan
Breakout Zone: $240
Entry Strategy: ANY price level AFTER confirmed breakout above $240
💡 Why this matters: We're watching for resistance to crack like a vault door. Once $240 breaks with volume, the path to riches opens.
🛡️ Risk Management (The Thief's Insurance Policy)
Stop Loss: $220
⚠️ Important Notice: This is my thief-style SL, but YOU are the master of your own vault. Set your risk tolerance based on YOUR capital and comfort level. Make money, take money — at your own calculated risk.
🎯 Profit Targets (Where We Cash Out)
Primary Target: $270 (Our recommended exit)
Technical Target: $280 (Strong resistance + overbought territory + potential trap zone)
📌 Strategic Exit Reasoning:
$270 offers a clean 12.5% gain from breakout
$280 presents multiple bearish factors: strong resistance, overbought conditions, and classic bull trap setup
Smart thieves escape with profits before the alarm sounds 🚨
⚠️ Important Notice: This is my thief-style TP, but only YOU can decide when to take profits. Your money, your rules, your risk.
🔍 Technical Analysis Deep Dive
Key Levels to Watch:
Resistance: $240 (current), $270 (target), $280 (danger zone)
Support: $220 (our safety net)
The Correlation Play 📈
Related Pairs to Monitor:
CRYPTOCAP:BTC (Bitcoin) - The market's king affects all. If BTC pumps, SOL typically follows with 1.5x volatility
CRYPTOCAP:ETH (Ethereum) - Direct competitor in smart contracts; inverse correlation on capital rotation
CRYPTOCAP:AVAX (Avalanche) - Similar L1 narrative; watch for sector rotation signals
SEED_DONKEYDAN_MARKET_CAP:MATIC (Polygon) - L2 competitor; check for broader altcoin momentum
💡 Correlation Strategy: If BTC holds above $65K while ETH consolidates, SOL historically outperforms due to capital flow seeking higher beta plays.
⚡ The Gentleman Thief's Trading Philosophy
This isn't gambling — it's calculated robbery from the market's inefficiencies. We enter with precision, manage risk like professionals, and exit before greed becomes our enemy.
Remember:
✅ Breakouts need volume confirmation
✅ Risk management is non-negotiable
✅ Profits aren't real until you take them
✅ The market doesn't care about your feelin
📢 Community Engagement
✨ "If you find value in my analysis, a 👍 and 🚀 boost is much appreciated — it helps me share more setups with the community!"
⚖️ Legal Disclaimer
IMPORTANT: This is a "thief-style" trading strategy shared purely for educational and entertainment purposes. This is NOT financial advice. Trading cryptocurrencies involves substantial risk of loss. Past performance does not guarantee future results.
You are solely responsible for your own trading decisions. Always:
Do your own research (DYOR)
Never invest more than you can afford to lose
Understand the risks before trading
Consider your personal financial situation
The author is not a registered financial advisor and assumes no liability for your trading outcomes.
Trade safe, steal smart, exit elegant. 🎩💰
#SOLUSDT #Solana #CryptoTrading #SwingTrading #DayTrading #TradingStrategy #Breakout #TechnicalAnalysis #CryptoSignals #AltcoinSeason #SOL #USDT #CryptoAnalysis #TradingView #PriceAction #CryptoChart #BullishSetup
SOLANA (SOL): Wave 5 awaits – upward momentum or bear trap?SOLANA (SOL): Wave 5 awaits – upward momentum or bear trap?
Weekly Scenarios
Bullish scenario: Price holds the ~$185-190 zone, breaks resistance at ~$260 → wave 5 starts up, target is approximately ~$300+.
Consolidation: Price moves in the ~$185-260 range without a significant breakout; energy is accumulating, waiting for a signal.
Bearish scenario: Break of support at ~$185 with volume → confirmation of the start of wave C correction → possible decline to ~$150-160.
✅ Conclusion
On the weekly timeframe, SOL is at a crossroads:
If it holds above ~$185 and manages to break ~$260, the chance of a strong rally increases.
If support fails to hold, the risk of a correction remains. Traders should watch for price reaction on levels, volume, and confirmation of wave structure before taking a position.

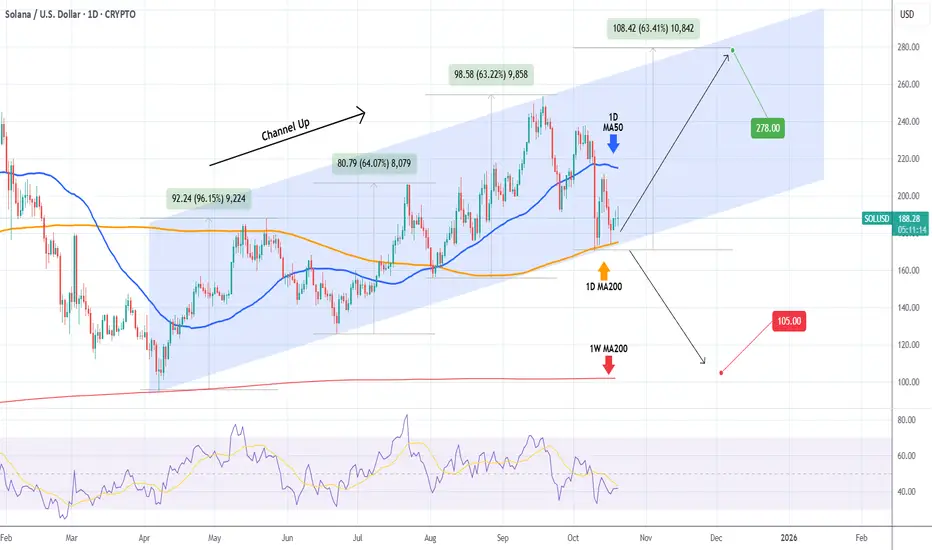
SOLANA 1D MA200 is the only level holding it from falling apart.Solana (SOLUSD) has been trading within a very structured Channel Up pattern since the April 07 bottom, which was priced exactly on its 1W MA200 (red trend-line). The recent pull-back though (Bearish Leg) has got the market testing another key Support level, the 1D MA200 (orange trend-line).
So far this has held on 4 successive tests, technically pricing a new Higher Low on the bottom of the Channel Up. This is what separates the start of the new Bullish Leg towards at least $278.00 (representing a +63.00% rise, the minimum rally so far inside this pattern) from a complete collapse to $105.00 and the 1W MA200. SOL needs to keep closing its 1D candles above the 1D MA200 to maintain the bullish trend.
-------------------------------------------------------------------------------
** Please LIKE 👍, FOLLOW ✅, SHARE 🙌 and COMMENT ✍ if you enjoy this idea! Also share your ideas and charts in the comments section below! This is best way to keep it relevant, support us, keep the content here free and allow the idea to reach as many people as possible. **
-------------------------------------------------------------------------------
💸💸💸💸💸💸
👇 👇 👇 👇 👇 👇
SOLANA Buying Opportunity Solana has established support at the daily trendline and successfully closed above the key daily resistance level at $191.32. The daily RSI is also indicating a potential buying opportunity, suggesting renewed bullish momentum. If this upward trend continues, the next potential target for Solana is around $250.

Solana Scenarios for the monthMonthly Scenarios
Bullish Scenario
SOL holds support in the $180-$184 range and breaks above $184-$190.
This will provide impetus to targets in the $230-$300+ range, especially if the market turns out favorable and there is positive news regarding SOL/ETF/on-chain activity.
Consolidation/Sideways
The price may remain stuck in the $180-$190 range without a clear direction, especially with light volume.
In this scenario, it is important to monitor reactions at the range boundaries.
Bearish Scenario
If SOL breaks below $180-$184 with volume, a decline to the lower support level of $143-$153 or even lower is possible.
Such a correction could serve as a "normalization" after a significant rise.
✅ Conclusion
The current monthly trend for SOL appears generally bullish, with strong potential for continued growth upon a breakout of resistance.
But the key area to watch is the $184–190 zone: if there's a breakout with volume, we expect an upward acceleration.
The $180 and especially $153–143 support zones are areas to monitor for trend stability.
The CoinCodex forecast (~3-5%) suggests moderate growth, but with the potential for strong momentum under favorable conditions.
SOL/USD: Bullish Swing Plan w/ Layered Buy Limits & Target🏴☠️ ATTENTION ALL THIEVES & ROBBERS! 🏴☠️
Asset: SOL/USD "Solana vs U.S Dollar" Crypto Market Heist Plan (Swing / Day Trade)
Plan: Bullish Heist ✅
🎯 THE MASTER PLAN: OPERATION SOLANA BULL RUN
Ladies & Gentlemen of the thieving community! 👔🦹♂️🦹♀️ Based on the Thief Trader's secret technical analysis, the vault door to Solana profits is creaking open! Time to execute the heist!
🚪 ENTRY: LAYER UP & SLIP IN SILENTLY
The Thief is using a multi-layer limit order strategy for this entry! We don't knock down the door, we pick the locks one by one! 🔓
Place your buy limit orders at these levels:
Layer 1: 190.00000
Layer 2: 195.00000
Layer 3: 200.00000
🛠 PRO TIP: You can increase your limit layers based on your own capital! More layers = bigger haul! 💰💰
🛑 STOP LOSS: THE GETAWAY DRIVER'S LOCATION
This is the Thief's SL: @180.00000
Listen up, OG's! 👉 Adjust your final SL based on your own strategy and risk appetite! Don't get caught because you got greedy on the entry! Know your exit route! 🚗💨
🎯 TARGET: ESCAPE BEFORE THE COPS ARRIVE!
The police barricade is forming at @240.00000! 🚨👮♂️
Do NOT get greedy! Grab the stolen money, exit the vehicle, and ESCAPE WITH THE PROFITS before the target! A true thief knows when the job is done! 🏁💰
⚠️ THIEF'S FINAL WARNING & DISCLAIMER
📰 News is an Undercover Cop: It will wreck our plan! Avoid new trades during high-impact news!
🔄 Use Trailing SL: Once in profit, trail your stop to lock it in! Protect the loot!
📉 This is not financial advice. This is a heist plan. You are the thief. Your capital, your risk. I'm just the mastermind.
💖 Enjoyed the plan? SMASH THAT LIKE & BOOST BUTTON! ✅ It helps our crew grow and plan the next big score! 🚀🤝
Stay sharp, thieves! I'll see you on the next heist. 🤑👋
Why Solana Could Surpass $300 in 2025–2026Hey guys, today I want to share my full view on Solana (SOL) .
For a long time, my main focus as an investor and trader was always on Bitcoin and Ethereum. But in the last 12 months, I started massively investing into Solana. The reason is simple: the ecosystem is not only recovering from its darkest days but is now proving real resilience, adoption, and growth.
When FTX collapsed in November 2022, Solana took one of the hardest hits. FTX and Alameda were among the biggest backers of the Solana ecosystem. When they went bankrupt, SOL crashed under $12 and many people stopped believing in its future. The market saw Solana as “FTX’s chain.” But fast forward to today, and we are witnessing a complete turnaround. Users are coming back, new protocols are being launched, and on-chain activity is stronger than ever.
In our crypto prop trading company , we’re building new infrastructure for our traders, and after careful research, we chose Solana as the best chain for implementation . Its speed, scalability, and near-zero fees make it the most practical blockchain to build on. And it’s not just us — many other companies and institutions are starting to integrate with Solana, which will bring even more growth in the months ahead.
⚠️ Quick disclaimer: This is not financial advice — only my humble opinion based on research, analysis, and experience.
Solana Price Action & Key Events (2022–2025)
To understand Solana’s current position, let’s look back at its journey over the last few years:
Bridge Breach (Feb 2022): The Wormhole bridge hack stole ~$325M, hurting trust in Solana DeFi.
DeFi Winter (May 2022): The Terra UST/LUNA collapse triggered a full liquidity crisis across all DeFi. Solana’s TVL drained fast.
FTX Implosion (Nov 2022): The turning point. FTX and Alameda went bankrupt, SOL crashed under $12, and the bear market bottom was defined.
Meme Season (Early 2024): Retail users came back with BONK and other meme coins. Solana’s speed and low fees made it the perfect hub for speculation.
WIF Mania (Spring 2024): Dogwifhat (WIF) went viral, volumes on Solana even surpassed Ethereum at times.
Pump.fun Frenzy (Apr 2024): Millions of tokens launched through Pump.fun, onboarding hundreds of thousands of wallets and driving record on-chain activity.
Full Recovery (2025): After two years of stagnation, SOL broke above $200 again, fully recovering to pre-FTX levels and proving that it can thrive as a community-driven, retail-driven chain.
Solana On-Chain TVL (Total Value Locked)
TVL (Total Value Locked) shows how much capital is locked in DeFi protocols on Solana — lending, staking, DEXes, and yield farming.
2021–2022: First boom, TVL surged past $10B.
2022–2023: Collapse after Terra and FTX, TVL fell close to zero.
2024–2025: Strong recovery — TVL passed $9–10B again, showing users are back and Solana DeFi is alive.
Why this matters: TVL growth proves Solana is not only about meme coins. Capital and liquidity are returning, and users are once again trusting the chain with real money.
Solana DEX Volume & Pump.fun Impact
In just one day, DEXs on Solana processed $10.3B in trading volume.
Pump.fun alone made up ~80% of that ($7.93B).
Pump.fun is unique because it allowed anyone to instantly create and trade tokens, onboarding massive numbers of new users. At its peak, Pump.fun had over 400,000 weekly active addresses , and even today it still makes up around 10% of all Solana DEX activity .
This shows two things:
Solana is the clear leader in retail-driven trading.
The ecosystem still needs broader use cases to sustain growth once meme speculation slows.
Futures Open Interest – Market Confidence
Open interest (OI) in Solana futures collapsed after FTX, but in 2024–2025 it came roaring back, growing alongside SOL’s price.
Positive: Rising OI shows traders trust Solana again, and rallies are backed by real activity.
Risk: Very high OI means higher liquidation risk. If markets turn, leveraged positions could cause sharp corrections.
Pump.fun Traders Data – Not Everyone Wins
According to Dune Analytics, 99.6% of Pump.fun traders never made more than $10K in realized profits . Only a small fraction hit big wins, while most made little or lost money.
This highlights the gambling-style nature of meme trading: it drives huge network activity but is not sustainable long-term. For Solana, the key is converting this short-term hype into long-term adoption.
Why Solana Could Rise in Late 2025–2026
Looking forward, here are the main reasons I believe Solana has strong upside potential:
1. Tokenization Boom
By 2033, $20T in assets could be tokenized.
Solana has the scalability, low fees, and adoption needed to be the leading infrastructure.
2. On-Chain Usage
Solana already surpasses Ethereum in active addresses and transactions (100M monthly users, 3.5B monthly txs).
More usage → more fees → higher staking yield → stronger SOL demand.
3. Institutional Adoption
Major players like BlackRock, Franklin Templeton, Visa, and PayPal are already launching tokenized products or stablecoin integrations on Solana.
4. Ecosystem Growth
Solana dominates in trading, token creation (60% of new tokens), and new sectors like AI agents.
From Pump.fun (retail) to xStocks and OnRe.finance (institutional), Solana is proving versatile.
5. Technology Roadmap
With Firedancer and other upgrades, Solana is moving toward 100k–1M TPS capacity, making it “internet-scale finance.”
6. Investment Case
SOL is scarce (~750M fixed supply), yield-bearing (7–13% staking), and directly tied to network growth.
Analysts project potential 4x–30x appreciation (short-term ~$900, medium ~$2,000, long-term ~$6,000).
Outlook – Target $300+
If 2022–2023 was about survival, and 2024–2025 was about recovery, then 2026 could be Solana’s breakout moment as the backbone of digital finance.
With on-chain activity at record highs, institutional adoption growing, and scalability improvements rolling out, a move above $300 in late 2025 or 2026 is not only possible but realistic.

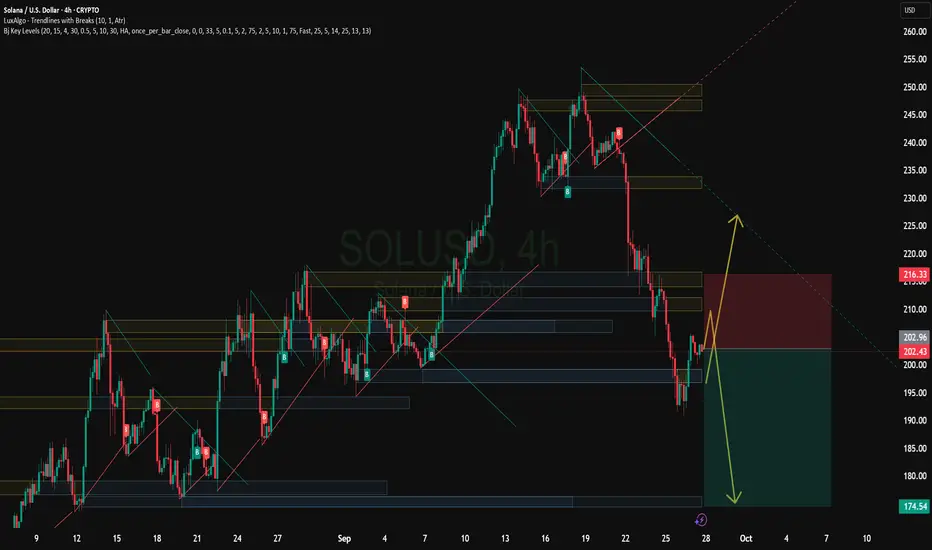
Solana: From 254 Highs Back to the 200 Line – What’s Next?At the end of August, I wrote that as long as 190 remained intact, Solana had room to rise toward 250, and I suggested a buy around the 200 level. That trade worked beautifully, with price reaching as high as 254.
From there, Solana started to roll over. At first, it looked like a normal correction, but the picture changed after a weak bounce attempt. Price broke decisively below 230, and the recent low was set right back at 190.
Currently, Solana is recovering once again. However, the structure of this bounce looks corrective in nature, forming what appears to be a bearish flag.
🔑 Key levels to watch:
• A break below the flag’s support – and more importantly below 200 – would likely trigger another leg down.
• In that case, the market could head toward a 175–180 major support zone, which is the next critical area for buyers to defend.
Until then, the bias remains cautious: Solana must prove it can break free from the corrective structure before bulls can regain control. 🚀
Solana Weekly Forecast and ScenariosWeekly Forecast and Scenarios
Bullish scenario: SOL holds support near $200–$210 and breaks through the $245–$250 zone, leading to a directional move toward $270 and beyond (even to $300).
Consolidation: The price may fluctuate within the $200–$245 range, awaiting volume and news, without a clear trend.
Bearish scenario: A breakout from the support range (below ~$188–$200) could lead to a pullback to lower levels of $170–$180.
Solana - Elliott Wave Analysis Based on Elliott Wave Theory, Solana appears to be completing Corrective Wave 4, with a potential buying opportunity in the $189 – $204 range. The market structure suggests the development of Impulse Wave 5, which is becoming increasingly evident on the daily chart.
Solana - The sleeping giant waking up!🔦Solana ( CRYPTO:SOLUSD ) will still head higher:
🔎Analysis summary:
Yes, over the past four years, Solana has overall been just consolidating. But eventually, Solana will catch up with the entire crypto market and create a new all time high. Specifically with bulls picking up momentum lately, it becomes more and more likely that Solana will do exactly that.
📝Levels to watch:
$250
SwingTraderPhil
SwingTrading.Simplified. | Investing.Simplified. | #LONGTERMVISION
