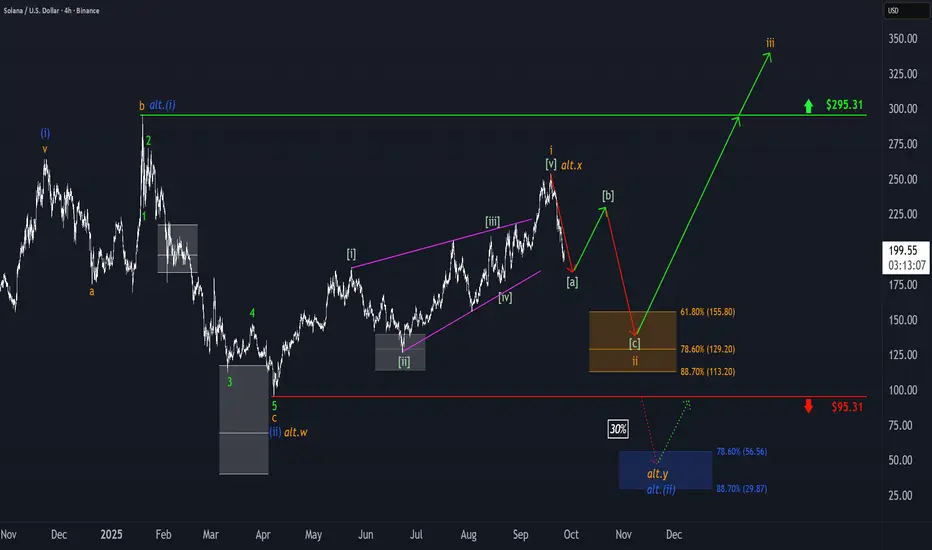
Solana: Is the Bottom In, or More Downside Ahead?SOL has already climbed more than 15% from last Friday’s low at its peak, potentially signaling the completion of wave ii in orange. For now, however, we’re still keeping open the possibility that this move could dip to a new low—within our green Target Zone ($155.80–$113.20). In any case, once this interim correction wraps up, wave iii in orange should kick off an impulsive rally, only losing steam above resistance at $295.31.
Solanatrading

SOL/USDT: Strong Uptrend – Short-Term Buy Opportunity!We are witnessing an excellent opportunity on the SOL/USDT chart, as Solana (SOL) continues to maintain a strong upward trend. In the context of a gradually stabilizing cryptocurrency market and positive news about Solana's ecosystem development, SOL is entering a significant price increase phase.
Currently, SOL/USDT is trading within an ascending channel and has broken out of the 140.00 support zone . The price is fluctuating around 143.66, close to the 140.00 support, which could see a slight pullback before continuing the upward momentum.
The next target for SOL/USDT in the short term is 155.00, where it might encounter some resistance. However, if the price maintains above 140.00, there is a high probability that SOL could continue its strong upward momentum towards 156.00 and even beyond.
Trading Strategy:
Buy SOL around the 140.00–143.00 range, with a short-term target of 155.00 and 156.00.
Set stop-loss if the price breaks below 139.00, as this is a crucial support level within the current uptrend channel.
In conclusion, SOL/USDT is maintaining a solid uptrend, and with positive signals from both technical indicators and fundamental factors, buying around the support zone is a reasonable strategy to capitalize on the upward movement.

SOL/USDT: Growth Fueled by Inflows and Network ExpansionNews: The Solana spot ETF in the U.S. has seen a significant inflow of capital , with over $476 million USD coming in over 17 consecutive days. At the same time, the Solana network has reported strong revenue growth , reaching around $2.85 billion USD . These factors have bolstered investor confidence in Solana, creating a favorable environment for the upward trend of SOL/USDT.
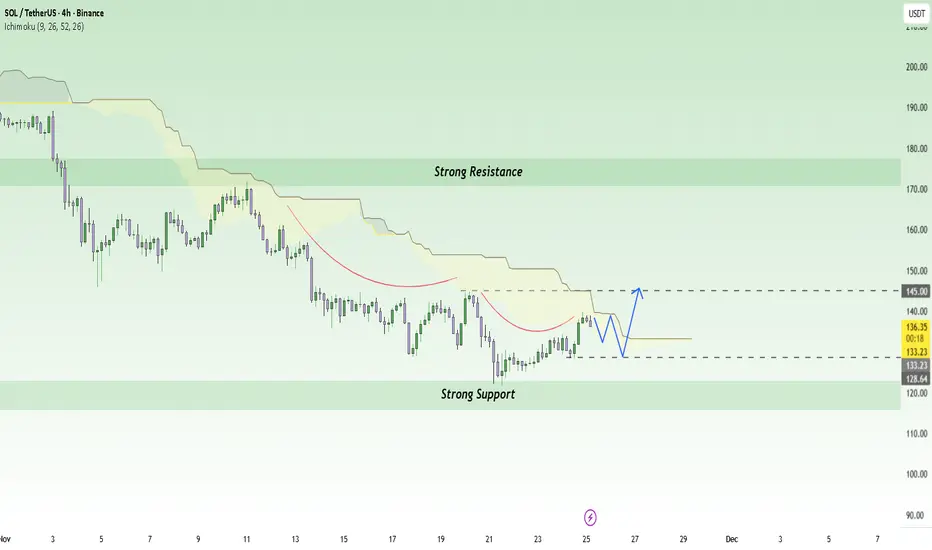
Chart: On the H4 chart, SOL/USDT is currently trading within a strong uptrend channel , supported by the Ichimoku cloud at 133.23 USD. The price is in the support zone around 128 USD, and there is potential for a strong rebound if it continues to hold above this level. If SOL/USDT maintains this trend, the next target could be 145 USD, where there is strong resistance in the short term.
Outlook: With positive macro factors and a clear technical structure , SOL/USDT could continue its strong uptrend, aiming for the 145 USD resistance level in the near future, as long as the price stays above 128 USD.
SOLUSDT: Liquidity Tightens – Every Pullback Drops Even Deeper!When talking about Solana right now, the clearest feeling is that the market is losing strength day by day . Recent news shows that SOL has dropped sharply in November, and large capital keeps exiting the market — turning every bounce into an excuse for holders to sell rather than a sign of reversal.
On the H4 chart, SOL is trapped inside a descending wedge , repeatedly rejected by the Ichimoku cloud — an area that has consistently blocked every recovery attempt. Each previous bounce has only led to an even stronger downward leg.
The $130 level is the nearest immediate resistance and also aligns with the descending trendline. If price pulls back to this zone, there is a high probability of fresh selling pressure emerging. When that happens, SOL could continue dropping toward the psychological support at $100 — the key target in the current bearish outlook.
In summary, with both negative news and a weak technical structure, the most reasonable strategy now is to follow the downtrend , wait for price to pull back into resistance to find cleaner entries, and avoid catching bottoms when the market shows no clear reversal signals.

SOLUSDT: Sellers in Control – Downtrend Remains DominantSolana is falling right at the moment when the altcoin market is under the most pressure. This week, a series of negative developments have weighed heavily on sentiment: strong ETF outflows, risk-off behavior, and fading expectations of a Fed rate cut in December. All of this makes it difficult for SOL to form any sustainable recovery.
On the 4H chart, SOL is sliding within a clear descending channel and has repeatedly been rejected at the upper trendline. The 150 USD level is now acting as a short-term resistance — every touch is pushed back immediately, showing how weak the buying pressure is.
If SOL continues to fail to break above 150 USD, the most likely scenario is a move back down to the 140 USD (TP1) zone. And if market sentiment remains bearish, a deeper target lies around 130 USD (TP2) — where the channel bottom aligns with a previous demand zone.
With negative news flow, weakening liquidity, and a technical structure fully favoring the downside, the short-term trend of SOLUSDT remains in the hands of the sellers. Any bounce here is more likely to become an opportunity for short positions rather than a true reversal signal.

Solana: Target Zone in FocusSOL has dropped more than 20% from last Thursday’s high. In light of this, we now believe that last week’s high—reached on Thursday—marked the top of wave i in orange, and that price is currently undergoing a wave ii corrective phase. This correction should play out as a downward, three-part move labeled - - in green, ultimately targeting our orange zone between $155.80 and $113.20. We expect the low of this wave ii to occur within that Target Zone, which should set the stage for a bullish reversal. The following wave iii in orange is projected to push SOL to new all-time highs, breaking through resistance at $295.31.
SOLUSD: Can it hit $1000?Solana is heavily bullish on its 1D technical outlook (RSI = 67.130, MACD = 11.423, ADX = 35.600) and just last week only crossed over its 1W MA50 again. This rebound started exactly on the 1W MA200, after holding the HL trendline of the Bull Cycle. Last time SOL crossed above its 1W MA50 after a HL, was on September 25th 2023 and a +1,122% rally unfolded. If macro and fundamentals assist, SOL can repeat this and reach the 1k mark (TP = 1,000).
## If you like our free content follow our profile to get more daily ideas. ##
## Comments and likes are greatly appreciated. ##

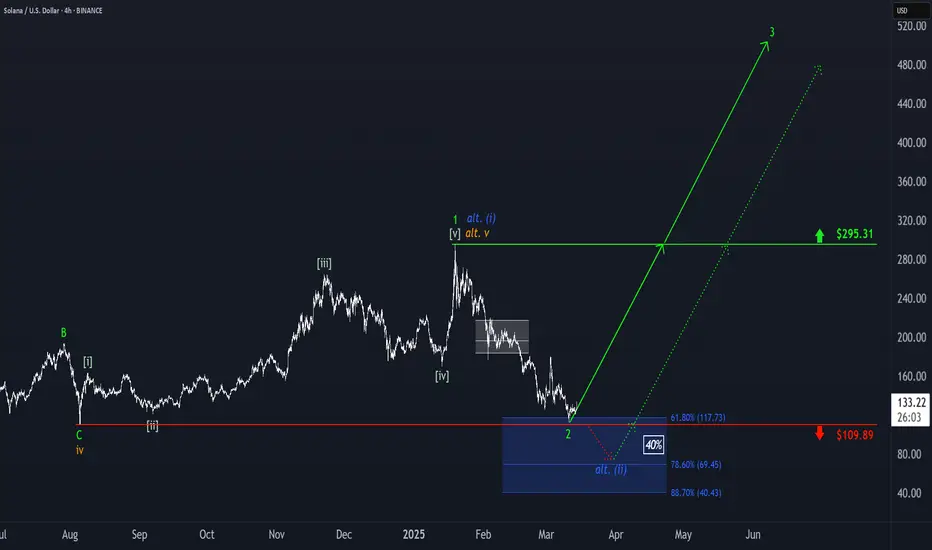
Solana: More RoomSolana’s countermovement of the green wave 4 has some more room on the upside. Once the wave-4-top is established (below the resistance at $192.33), we primarily anticipate a wave 5 sell-off down into the blue Target Zone on the downside (coordinates: $56.56 – $29.87). In this range, the wave (ii) corrective movement should conclude, and the altcoin should start the next sustainable upward impulse. However, if the price rises above the mentioned $192.33 mark during the current upward movement (36% likely), this will suggest that the low has already formed via wave alt.(ii) in blue.

SOLUSD: Bottom formation in process. Target 350.Solana just turned neutral on its 1D technical outlook (RSI = 48.726, MACD = -4.803, ADX = 29.746) as it is approaching the 1D MA50 following a strong rebound on both the S1 Zone but more importantly the 1W MA100. Straight after the low, the market formed a 1D Death Cross. The previous such pattern (September 6th 2024) was formed again on a market low on the S1 Zone. Whether the rebound takes effect immediately or 2 months (max) after, we see this as a great buy opportunity to aim at the HH Zone and the 2.618 Fibonacci extension (TP = 350.00).
## If you like our free content follow our profile to get more daily ideas. ##
## Comments and likes are greatly appreciated. ##

Solana: Precision Landing?!Solana extended its sell-off and reached our blue long Target Zone between $117.73 and $40.43. The price then reacted right at the $109.89 support level, indicating that the low of the green wave 2 has been settled. Thus, the next step should involve a strong rally driven by the green wave 3, ultimately pushing SOL well beyond the $295.31 resistance and past its current all-time high. However, our Target Zone remains active, as there is a 40% chance that the price could revisit this range to complete the blue alternative wave (ii) below the $109.89 mark.
SOLUSD: Libra crash is a buy in disguiseSolana is suffering heavy losses these past few days due to the prevailing news regarding Libra and has turned oversold on its 1D technical outlook (RSI = 30.523, MACD = -8.449, ADX = 53.479). Since the long term pattern is a Channel Up and the price is headed for its bottom, while the 1D RSI is at 30.000, which has been a buy signal for over 1 year, this is technically a buy opporutnity in disguise. The similar buy signal of June 23rd targeted the R1 level at the top of the corrective Channel. Go long, TP = 260.00.
## If you like our free content follow our profile to get more daily ideas. ##
## Comments and likes are greatly appreciated. ##

SOLUSD: Rejection on the 1D MA50 turning to a buy opportunity.Solana turned bearish on its 1D technical outlook (RSI = 43.075, MACD = -3.090, ADX = 38.836) as it got heavily rejected yesterday on the 1D MA50. The price approached the 0 Fibonacci level which is the top of the bottom zone of the Channel Up. Technically as long as the 1D MA200 is intact, the pattern is intact and the trend remains bullish. Since the price is this close to the bottom, this 1D MA50 rejection has turned into the best buy opportunity for the short term. Once the 1D RSI dips a little lower, it will be identical to all prior RSI bottoms of the Channel Up. This is worth turning bullish right now, we are aiming for the 0.786 Fibonacci level (TP = 340.00).
## If you like our free content follow our profile to get more daily ideas. ##
## Comments and likes are greatly appreciated. ##

SOLUSD: Ready to breakout parabolically.Solana just turned bullish on its 1D timeframe (RSI = 58.732, MACD = 1.506, ADX = 22.317) but remains neutral on the 1W (RSI = 51.934, MACD = 6.162, ADX = 25.249) which underlines its undervalued nature. Since the August low, the price has held the 1W MA50, cementing it as Support and appears to be ready for a breakout. This breakout can be a parabolic one, same as the one that emerged on December 21 2020. This was the bullish wave of SOL's historic Channel Up pattern and it came when the 1W RSI rebounded on the pressure zone. This is exactly where the price sits today. Even though that would catapult its market cap and high adoption is needed behind it (along with other fundamental catalysts), technically if those conditions emerge, we can see Solana making a new HH on its Channel Up, TP = 5,000.
## If you like our free content follow our profile to get more daily ideas. ##
## Comments and likes are greatly appreciated. ##

SOLUSD Can $5000 become a reality??Solana is overbought on the 1D technical outlook (RSI = 75.694, MACD = 9.354, ADX = 24.946) and even more so on 1W (RSI = 84.892) but that doesn't seem to stop its remarkable uptrend as it broke over the R1 level (144.00) today and the only Resistance standing now is the ATH (261.50). The price action is so far quite similar to the very beginning of Sol's trading days and the CCI supports that.
Consequently, if the long term pattern is a Channel up, we can see a Bull Cycle up to early 2025 and peak near its top (TP = 5,000).
## If you like our free content follow our profile to get more daily ideas. ##
## Comments and likes are greatly appreciated. ##

Solana - 1D ( + 200 % Growth 0 Draw Down ) 💵Pair Name :SOLUSDT
Time Frame : 4hrs Chart / Close
Scale Type : Large Scale
------
🌐 spreading knowledge among us and to clarify the most important points of entry, exit and entry with more than 5 reasons
We seek to spread understanding rather than make money
🔗 Key Technical / Direction ( Long )
Type : Mid Term Swing
——————————
💲 As we said exactly also as we Draw the expecting movement before
Sol Growth = 200 % Our Area achieved 0 draw Down

SOLUSD Is it too late to buy now?Solana smashed through our 32.000 TP (chart at the bottom) and turned technically overbought on the 1D timeframe (RSI = 85.195, MACD = 3.972, ADX = 68.655). Even the 1W technical outlook has an overbought RSI = 74.450 and as the price is near the R1 level (48.500), which was the Resistance during July-August 2022, we may see a technical pullback to ease some of this excessive extension.
On the long term this bullish trend is here to stay though, as the 1W MACD is on a Bullish Cross that just crossed over the 0.000 level and the trend is supported by a HL trendline. Consequently we will wait for a pullback towards the 1D MA50 and the 0.382 Fibonacci level around 31.000 to go long and target the 0.618 Fibonacci level (TP = 67.000).
See how well our prior idea has worked:
## If you like our free content follow our profile to get more daily ideas. ##
## Comments and likes are greatly appreciated. ##
