Solana: Edging HigherSOL has edged slightly higher, but remains well within our green Target Zone ($155.80 – $113.20). If it hasn’t already, the altcoin is expected to establish the low for wave ii in orange within this range before turning higher. The subsequent wave iii in orange should then drive price above the resistance levels at $249.68 and $295.31.
Solanausd

SOLANA: Wave energy on the brink of a new movementSOLANA: Wave energy on the brink of a new movement
SOLANA Wave Overview (D1 and H4)
As a trader who has been practicing wave analysis for over ten years, I note that the current Solana structure demonstrates the completion of an extended corrective formation and the potential for a new impulse to emerge.
Chart D1: The global picture indicates that the market is completing a sideways phase. The wave structure appears to be the end of a corrective sequence, which serves as the foundation for the next trend move.
Chart H4: Local dynamics confirm the formation of key entry points. Here, the first signs of an emerging impulse are visible, which could mark the beginning of a larger wave.
Main Scenario
After the completion of the corrective phase, a descending impulse sequence is expected to develop. This movement will be accompanied by increased seller activity and a gradual shift in priority to the downside.
Alternative Scenario
If the price holds above recent highs and forms a stable upward impulse structure, the priority will shift to continued growth. In this case, the correction will be considered incomplete, and Solana may show an additional rebound.
Trading Idea
Conservative approach: wait for confirmation of a breakout of key levels and enter with the trend.
Aggressive approach: use local impulses on H4 for earlier entries, but with tight stops.
In both cases, it is important to maintain strict risk management and adjust the plan as new impulses emerge.
Results
Solana is at the transition point between a correction and a new impulse. The wave structure on D1 and H4 provides clear guidelines for action: watch for confirmation of the scenario and act with discipline.

SOL Update: Downtrend confirmed, hold on to your horses SOL Update: Solana remains in a clear downtrend, with price continuing to respect the descending channel that’s been in place since the breakdown from the highs. The broader structure is defined by lower highs and lower lows, and each bounce so far has been corrective rather than impulsive. The recent move back toward the ~$125 area looks more like a relief reaction than a genuine attempt at trend reversal.
The ~$125 zone is a key inflection point, but at this stage it’s acting more like resistance than support. Price has struggled to reclaim and hold above that level, and without a strong impulsive push and follow-through, it’s hard to make a case for acceptance back above it. As long as SOL remains below this level and inside the descending channel, the path of least resistance remains lower.
Zooming out, this aligns with the broader crypto market working through a corrective and risk-off phase, where strength tends to fade and rallies get sold. In that environment, higher timeframe downtrends typically persist until a clear base forms or a major level is reclaimed. For SOL, that means continued downside risk and consolidation until structure improves.
For now, I’m treating any moves into resistance as corrective and staying cautious. Until SOL can break the downtrend and reclaim key levels with conviction, this remains a downtrend-first market rather than a buy-the-dip environment.
Looking for more down, and then eventually hopefully some relief.

Solana (SOL): towards $117?Hi!
SOL remains in a clear descending channel, indicating sustained bearish momentum. After a period of consolidation within the rectangular range, the price recently rejected the upper boundary, forming a potential continuation pattern. The RSI sits near 40, signaling slight oversold conditions but no strong reversal yet. Price action suggests a likely retest of the channel’s lower boundary near $117.48, aligning with the support zone highlighted. Traders should watch for confirmation of a bounce at this level or continuation lower. Short-term pullbacks may occur, but the dominant trend remains bearish.
Conclusion: Trend-following strategy favored; bearish continuation likely, $117 support key.

Solana vs USD – Bearish Playbook High-Probability Swing Setup🔹 Asset: SOL/USD – “SOLANA VS U.S. DOLLAR”
🔹 Trade Style: Crypto Market Opportunity Blueprint (Swing Trade)
🔻 Plan: Bearish Plan
📍 Entry Zone
You can enter at any price level according to your strategy and confirmation signals.
🛑 Stop Loss (SL)
This is Thief SL → @ 152.50
Dear Ladies & Gentleman (Thief OG’s), adjust your SL based on your own strategy & risk levels.
🔔 Important:
Place SL only after breakout confirmation.
I am not recommending to use only my SL. It’s your choice — you make money, you take money at your own risk.
🎯 Target (TP)
Market has strong support + oversold conditions + potential trap zones, so kindly exit with profits.
Our Target → @ 125.00
🔔 Important:
Dear Ladies & Gentleman (Thief OG’s), I am not recommending to use only my TP.
It’s your choice — you make money, you take money at your own risk.
📊 Related Pairs to Watch (Correlation Guide)
1️⃣ BITSTAMP:BTCUSD – Bitcoin
King of crypto; SOL often follows BTC’s direction.
If BTC breaks down, SOL bearish continuation becomes stronger.
2️⃣ BITSTAMP:ETHUSD – Ethereum
High correlation with major altcoins.
ETH weakness usually signals pressure on L1 chains like SOL.
3️⃣ COINBASE:AVAXUSD – Avalanche
Competitor L1 chain; often moves in similar sentiment flow.
If AVAX also shows bearish structure → confirms broad L1 weakness.
4️⃣ COINBASE:LTCUSD – Litecoin
Old major coin; used for risk-on/risk-off sentiment checks.
If LTC dumps → market-wide bearish confirmation.
5️⃣ CRYPTOCAP:TOTAL2 – Altcoin Market Cap
Measures overall altcoin health.
If TOTAL2 breaks its support → SOL likely accelerates toward bearish target.
🔍 Why These Pairs Matter? (Key Correlation Points)
BTC sets the tone – SOL follows the major trend 75–85% of the time.
ETH determines altcoin liquidity – if ETH dominance rises, SOL loses capital flow.
AVAX acts as sector correlation – L1 competitors weaken together during bearish cycles.
TOTAL2 confirms broad alt weakness, making SOL’s downside more reliable.

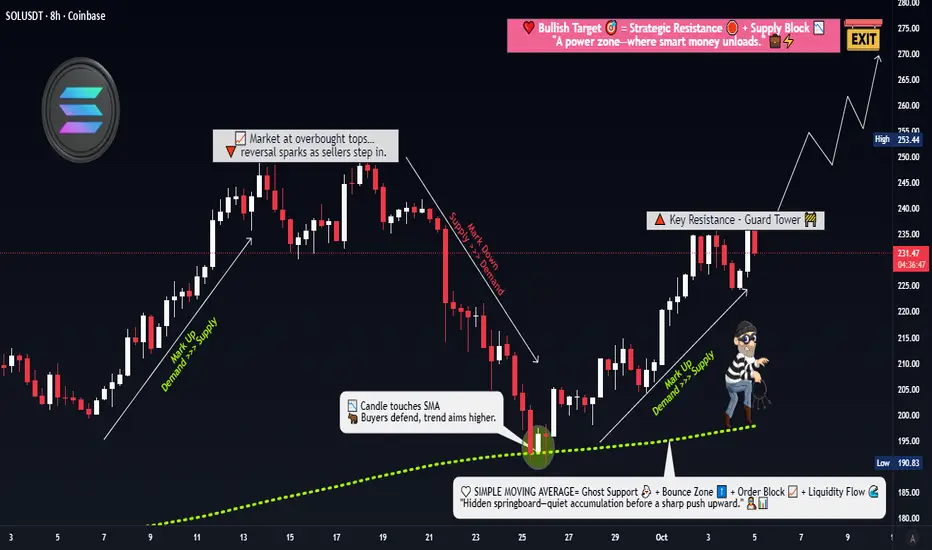
SOL/USDT Update — Bullish Trend Structure and Resistance Ahead“🚨 Solana vs Tether: Bullish Heist on SOL/USDT 💰”
📊 Description
Market: SOL/USDT
Bias: Bullish (Swing / Day Trade)
✅ Trade Plan
Entry: 🎯 Any good support / demand area — stay alert & flexible.
Stop Loss: 🛡️ “Thief SL” @ 160.00 USDT — this is my SL, not yours. Manage your own risk!
Targets (TP):
• 🎯 Target 1: 215.00 USDT
• 🏁 Target 2: 240.00 USDT
⚠️ Heads up: Use your discretion. Do not blindly follow my SL/TP — trade responsibly, at your own risk.
🔍 Key Insights / Logic
🚧 Expect resistance & traps near 215–240 — don’t get stuck in overbought zones.
📈 Momentum is building; structure is favorable on retests.
🔊 Watch volume on impulsive moves — rising volume = strength.
🔄 Related pairs / correlation watch:
• BINANCE:SOLBTC — strength vs BTC strengthens the bullish case.
• BINANCE:ETHUSDT — altcoin momentum may carry SOL upward.
• BINANCE:BNBUSDT — BNB strength can support ecosystem flow.
✨ “If you find value in my analysis, a 👍 and 🚀 boost is much appreciated — it helps me share more setups with the community!”
#SOL #SOLUSDT #Solana #CryptoSwing #CryptoDayTrade #AltcoinAnalysis #TradingViewIdeas #CryptoFun

Solana: Is the Bottom In, or More Downside Ahead?SOL has already climbed more than 15% from last Friday’s low at its peak, potentially signaling the completion of wave ii in orange. For now, however, we’re still keeping open the possibility that this move could dip to a new low—within our green Target Zone ($155.80–$113.20). In any case, once this interim correction wraps up, wave iii in orange should kick off an impulsive rally, only losing steam above resistance at $295.31.

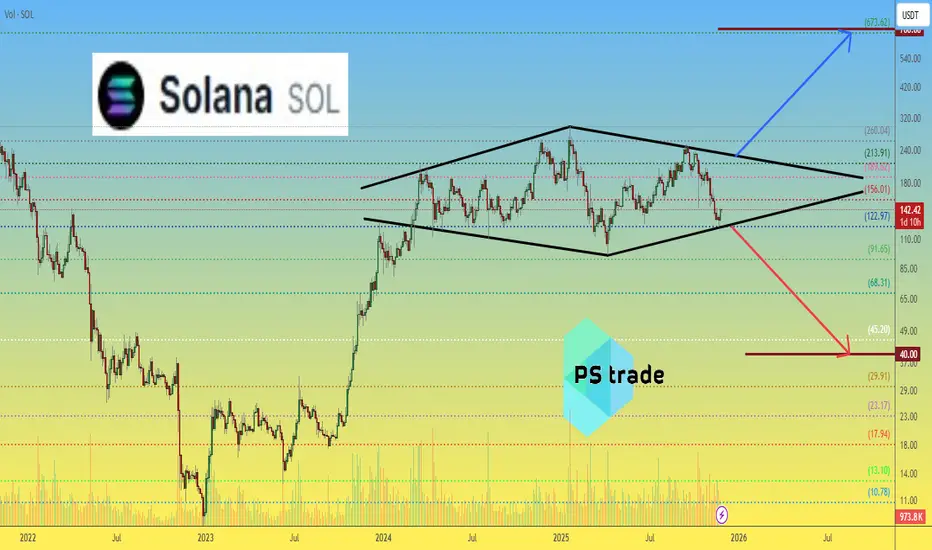
Solana SOL price analysisA notable long-term structure is developing on the OKX:SOLUSDT chart — a 1.5-year consolidation resembling a broad “diamond” formation.
Such structures in classical technical analysis often appear near the end of distribution phases and may precede a deeper downside continuation.
From this perspective, a potential move toward the $40 region cannot be excluded.
At the same time, market data presents a contrasting signal:
• #Solana ETF remains one of the few crypto-related instruments consistently showing positive daily inflows
• Both CRYPTOCAP:BTC and CRYPTOCAP:ETH ETFs have not demonstrated the same level of capital interest
• This suggests that institutional positioning around CRYPTOCAP:SOL may be slowly increasing
If capital inflows persist, higher-timeframe upside scenarios — even toward the $700 region — could remain on the table in the broader macrotrend.
What scenario do you find more probable at this stage: deeper correction or long-term continuation?
______________
◆ Follow us ❤️ for daily crypto insights & updates!
🚀 Don’t miss out on important market moves
🧠 DYOR | This is not financial advice, just thinking out loud
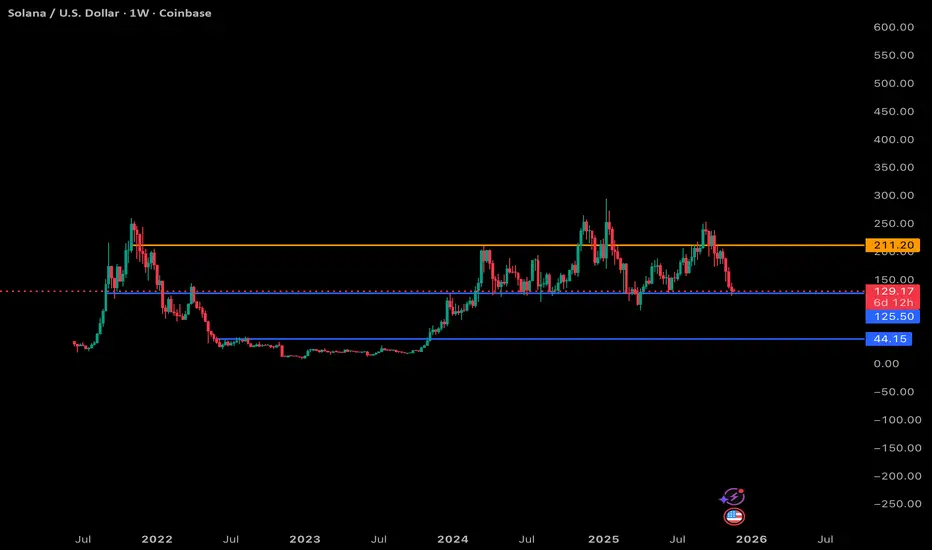
SOL 1W Breakdown: Key Levels, What I’m Watching Next Nov 24 2025Here’s my read on Solana’s weekly chart using the same structure as the BTC and ETH analyses.
Blue = support, orange = resistance, and the dotted mid-range is acting like a pivot zone.
Support Levels (Blue)
$125.50: This is the line SOL is sitting right on top of right now. It’s been a key mid-range level for almost two years. Losing this on the weekly would be a clear bearish signal because there isn’t much structural support underneath until the next major zone.
$44.15: This is the big, deep support from the 2022–2023 accumulation base. I’m not calling for this immediately, but structurally there’s a lot of empty space between $125 and $44. If the macro rolls over and SOL can’t defend the mid-range, we could see a slow bleed or capitulation wick toward this zone.
Resistance (Orange)
$211: This is the major weekly resistance for SOL and has been the top of every rally since 2022. Until SOL can close above this level and hold it, any upside is still just range movement.
My Current Thoughts
SOL is in a tricky spot. We’re sitting right on that $125ish support, and this is basically the “bounce here or things get uncomfortable fast” level.
If we don’t get a bounce:
The chart opens up a pretty big air pocket down to the next structural support.
Weekly structure turns decisively bearish.
SOL likely enters a multi-month corrective phase similar to what it did in 2022/2023 (but obviously not the same magnitude).
If we do bounce:
SOL can chop around this mid-range again, possibly retesting $150–175.
But it still needs a clean reclaim of $211 to resume a real macro uptrend.
Overall View
SOL’s weekly chart is way less forgiving than BTC or ETH right now. The range is clear, but we’re testing the bottom of it, and losing this level puts a lot of downside in play. From a structural standpoint, this is the most important support SOL has tested in a long time. If it holds, cool, if it breaks, we probably enter a much deeper reset.
Slow grind or big drop, the next weekly close is going to be telling.
SOLANA: The last wave before takeoff or a deep pullbackSOLANA: The last wave before takeoff or a deep pullback
📈 Weekly Scenarios
Bullish scenario: SOL holds above ~$190, breaks through ~$260.83 → start of uptrend → target ~$300+.
Consolidation: price trades between ~$190 and ~$260, wave structure not defined until breakout.
Bearish scenario: breakout of support at ~$190 with volume → likelihood of a significant correction to ~$150–$160.
✅ Conclusion
Solana is at a key decision point for the coming week:
The ~$260.83 level is a benchmark for a bullish resumption.
The ~$190 level is a critical support level.
A breakout upward will provide upward momentum; a breakout downwards is likely a pullback. Follow price reactions at the highlighted levels and confirmation of the wave structure before making trading decisions.

Is Solana Ready for a Technical Breakout or Just a Fake Pump?🎯 SOL/USDT Wealth Strategy Map | The Gentleman Thief's Playbook 💎
📊 Market Overview
Asset: SOLANA/USDT (SOL/USDT)
Trading Style: Swing/Day Trade Hybrid
Market Sentiment: Bullish Pending Breakout Setup 🚀
🎭 The Setup (As Told by a Professional Thief)
Dear Ladies & Gentlemen, gather 'round for today's calculated heist...
🔓 The Entry Plan
Breakout Zone: $240
Entry Strategy: ANY price level AFTER confirmed breakout above $240
💡 Why this matters: We're watching for resistance to crack like a vault door. Once $240 breaks with volume, the path to riches opens.
🛡️ Risk Management (The Thief's Insurance Policy)
Stop Loss: $220
⚠️ Important Notice: This is my thief-style SL, but YOU are the master of your own vault. Set your risk tolerance based on YOUR capital and comfort level. Make money, take money — at your own calculated risk.
🎯 Profit Targets (Where We Cash Out)
Primary Target: $270 (Our recommended exit)
Technical Target: $280 (Strong resistance + overbought territory + potential trap zone)
📌 Strategic Exit Reasoning:
$270 offers a clean 12.5% gain from breakout
$280 presents multiple bearish factors: strong resistance, overbought conditions, and classic bull trap setup
Smart thieves escape with profits before the alarm sounds 🚨
⚠️ Important Notice: This is my thief-style TP, but only YOU can decide when to take profits. Your money, your rules, your risk.
🔍 Technical Analysis Deep Dive
Key Levels to Watch:
Resistance: $240 (current), $270 (target), $280 (danger zone)
Support: $220 (our safety net)
The Correlation Play 📈
Related Pairs to Monitor:
CRYPTOCAP:BTC (Bitcoin) - The market's king affects all. If BTC pumps, SOL typically follows with 1.5x volatility
CRYPTOCAP:ETH (Ethereum) - Direct competitor in smart contracts; inverse correlation on capital rotation
CRYPTOCAP:AVAX (Avalanche) - Similar L1 narrative; watch for sector rotation signals
SEED_DONKEYDAN_MARKET_CAP:MATIC (Polygon) - L2 competitor; check for broader altcoin momentum
💡 Correlation Strategy: If BTC holds above $65K while ETH consolidates, SOL historically outperforms due to capital flow seeking higher beta plays.
⚡ The Gentleman Thief's Trading Philosophy
This isn't gambling — it's calculated robbery from the market's inefficiencies. We enter with precision, manage risk like professionals, and exit before greed becomes our enemy.
Remember:
✅ Breakouts need volume confirmation
✅ Risk management is non-negotiable
✅ Profits aren't real until you take them
✅ The market doesn't care about your feelin
📢 Community Engagement
✨ "If you find value in my analysis, a 👍 and 🚀 boost is much appreciated — it helps me share more setups with the community!"
⚖️ Legal Disclaimer
IMPORTANT: This is a "thief-style" trading strategy shared purely for educational and entertainment purposes. This is NOT financial advice. Trading cryptocurrencies involves substantial risk of loss. Past performance does not guarantee future results.
You are solely responsible for your own trading decisions. Always:
Do your own research (DYOR)
Never invest more than you can afford to lose
Understand the risks before trading
Consider your personal financial situation
The author is not a registered financial advisor and assumes no liability for your trading outcomes.
Trade safe, steal smart, exit elegant. 🎩💰
#SOLUSDT #Solana #CryptoTrading #SwingTrading #DayTrading #TradingStrategy #Breakout #TechnicalAnalysis #CryptoSignals #AltcoinSeason #SOL #USDT #CryptoAnalysis #TradingView #PriceAction #CryptoChart #BullishSetup
Solana - We have to see new all time highs!🚀Solana ( CRYPTO:SOLUSD ) has to break out:
🔎Analysis summary:
Over the course of the past couple of months, Solana has been rallying another +100%. This rally ultimately resulted in another, third retested of the previous all time high. And if Solana now creates bullish confirmation, we can all expect new all time highs very soon.
📝Levels to watch:
$250
SwingTraderPhil
SwingTrading.Simplified. | Investing.Simplified. | #LONGTERMVISION

SOLANA (SOL): Wave 5 awaits – upward momentum or bear trap?SOLANA (SOL): Wave 5 awaits – upward momentum or bear trap?
Weekly Scenarios
Bullish scenario: Price holds the ~$185-190 zone, breaks resistance at ~$260 → wave 5 starts up, target is approximately ~$300+.
Consolidation: Price moves in the ~$185-260 range without a significant breakout; energy is accumulating, waiting for a signal.
Bearish scenario: Break of support at ~$185 with volume → confirmation of the start of wave C correction → possible decline to ~$150-160.
✅ Conclusion
On the weekly timeframe, SOL is at a crossroads:
If it holds above ~$185 and manages to break ~$260, the chance of a strong rally increases.
If support fails to hold, the risk of a correction remains. Traders should watch for price reaction on levels, volume, and confirmation of wave structure before taking a position.

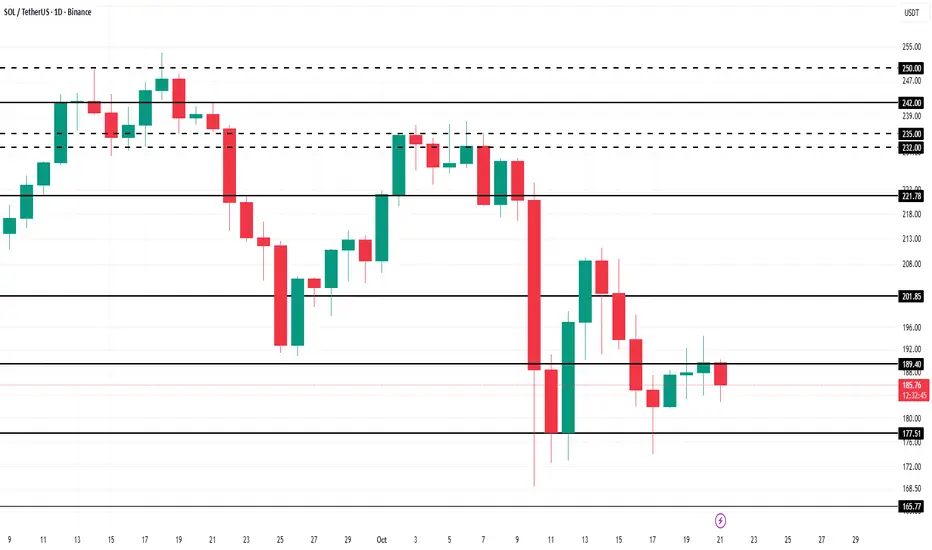
Is A Bullish Crossover Next For Solana Price?Solana’s price stands at $187 at the time of writing, holding firm above the $183 support level. The altcoin remains range-bound, struggling to break through the key $192 resistance. However, price stability above support suggests growing resilience in the face of selling pressure.
If Solana’s bullish indicators gain traction, the price could climb past $192 and target $200 or higher. Strengthening support levels combined with improving investor sentiment could help SOL establish a sustainable uptrend.
Conversely, if momentum fails to build, Solana may drop below $183 to test $175. A further decline could extend losses toward $163. This would effectively invalidating the bullish outlook and signaling continued market weakness.

Solana Price May Have A Shot At $250, But Caution AdvisedAt the time of writing, Solana’s price stands at $184, holding above the crucial $183 support. The altcoin appears to be forming a flag pattern, a technical setup often associated with bullish breakouts. However, confirmation will depend on volume strength and investor conviction.
Following the recent crash, SOL briefly dropped out of this pattern before testing and validating it again. For a clear breakout, Solana needs to bounce off the lower trendline or move past $192. Failure to sustain buying pressure could drive the token below $175, potentially falling to $163, invalidating the bullish pattern.
Conversely, if Solana breaches $192, it could surpass $200, a key psychological barrier. Breaking out from the pattern could ignite renewed momentum, setting the stage for a potential surge toward $250. Nevertheless, investors and traders should proceed with caution given the current market fragility.
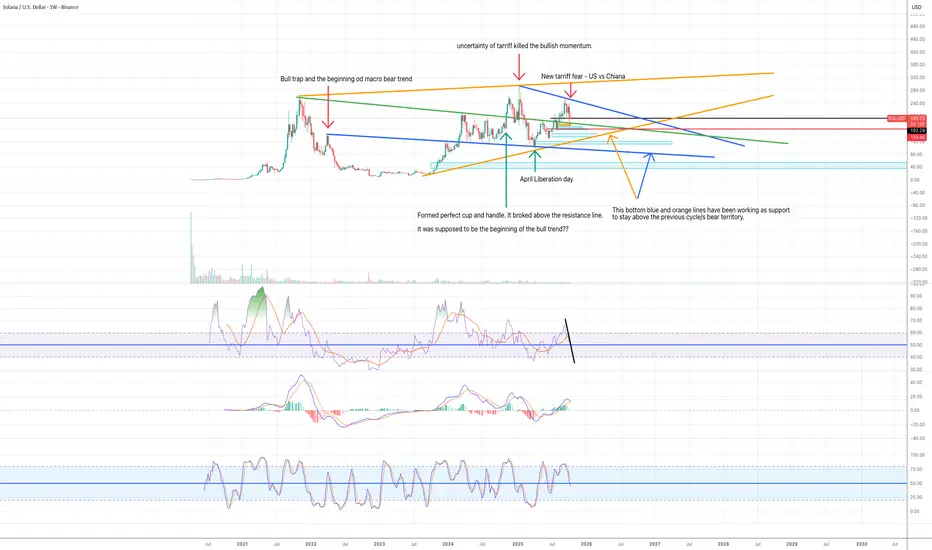
Where does the price find a bottom? I can see a few patterns in a weekly chart.
1) The price is moving inside the blue descending wedge pattern.
2) The price is moving inside the orange ascending wedge pattern.
3) Green descending support/resistance line is the line that completes a huge cup and handle pattern.
What do you think? I would like to know what others see.
Have a nice weekend.
Another Friday crush?? Price action is extremely bearish. I can see the same price action of the last Friday is unfolding in 1H chart.
When I analyse a chart, I use trendl ines, Fib retracement, EMAs, and momentum indicators. But when the action is so volatile and I feel like I no longer know what the hell is going on, I remove all the indicators and look for clear liquidity zone in higher time frames: Where did the price move up too quickly and left unfilled buy orders, and when did the price drop too quickly and left unfilled well orders?
The problem of Solana is the price has moved down and moved up way to fast at the end of last bull cycle and in the beginning of this bull cycle.
Solana price fell from $250 to $82 in two months at the end of 2021. And after the bull trap in March 2023, the price again fell rapidly from $140 to $36 in two months. After the spectacular fall, Solana spent 16 months basing between 8 and 46 for 16 months. However, when it started to move up in October, it went up too quickly again. It moved from $22 to $200 in 6 months.
The past 18months, Solana spent most of the time in the range bound between $126 and $260, satisfying both buying and selling demands. The price can eventually go up, but I see lots of downwards pressures in every time frame:
Monthly:
Large unmitigated fair value gap between $45 and $80.
Price is trapped inside the descending wedge pattern. It is a bullish pattern. However, if the price does not break and close above the descending resistance line, the price is likely to move to the downside.
Momentum indicators are also in the bull zone. However, RSI and MACD are starting to move to the downside. It makes me think the price correction is happening. It is a monthly chart, so it won't resolve quickly.
Weekly:
I can see a diamond pattern. The price is trapped in the shape of the diamond. It is usually a bearish pattern.
The price was moving up strongly along the ascending support line (purple line). However, the last Friday's crush went down to sweep the liquidity (orange rectangular box) and I can see two more fair value gaps sitting below it.
All weekly momentum indicators are still in the bull zone, however, RSI lines and Stochastic lines are now crossed to the downside. MACD lines are very close to cross as well.
Daily:
The price is still above EMA 200 and also above the support line, however, EMA 55 is about to cross over EMA 12 and 21. Yesterday's candle retested EMA 12/21/55 and closed below it.
MACD are deeply in the bear zone and has no sign of recovery.
RSI and Stochastics are reset to move to the downside.
1H:
EMA12/21/55/200 are perfectly lined up for the bear move.
Before last Friday's crush, the price held above $217 for a few days, but it eventually capitulated. I can see the same set up unfolding. And it is Friday again.
There is an unmitigated fair value gap in the $212-218 zone (immediate one) , so the price can move up there to fake out and move down. I have no idea what the market will do. I can see in a daily chart the price is moving inside the descending parallel channel. So if the price can hold above the purple ascending trend line, it might recover from there.
It is a very difficult market. When you have a strong bias, you will always find what you want to see. I have to pay attention to what the price is doing and hopefully react to it correctly.
Good luck.

SOLANA Buying Opportunity Solana has established support at the daily trendline and successfully closed above the key daily resistance level at $191.32. The daily RSI is also indicating a potential buying opportunity, suggesting renewed bullish momentum. If this upward trend continues, the next potential target for Solana is around $250.

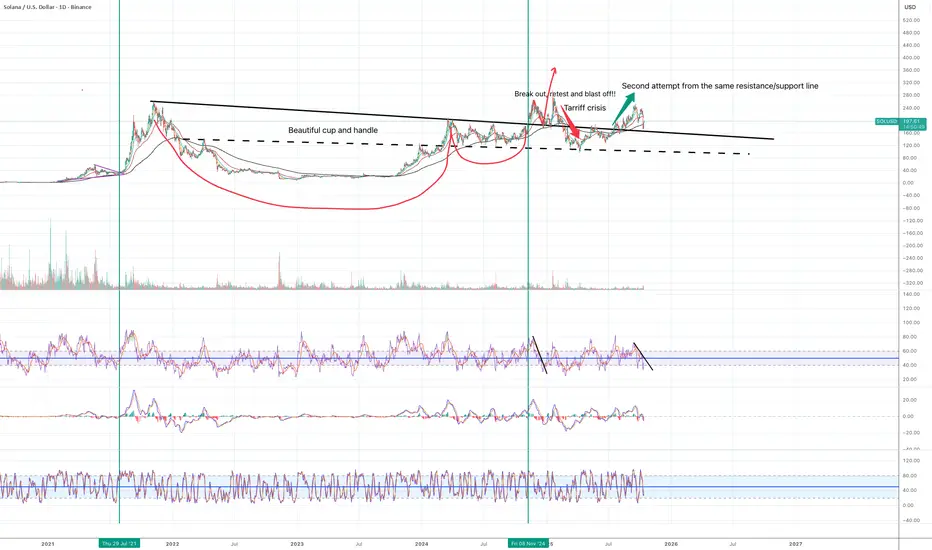
The second attempt to complete a massive cup and handle ?Solana is forming a massive cup and handle in the daily chart. In early November, Solana finally broke above the resistance line and (temporarily) completed the cup and handle pattern.
It is only the speculation, but if we did not have the US tariff drama, Solana (and the rest of the market) would have started a strong bull cycle.
In August 2025, the price finally broke above the resistance line again. It looked like the price was going to finally start to move to the upside. Then, we experienced another crypto bloodbath due to the US-China tariff issue last Friday. I have no idea how the next few weeks will unfold, but at this stage, the price managed to stay above the support line and it is recovering.
I already hold Solana positive for long term investment, but I intend to open a swing trade position when:
1. Daily RSI lines cross to the upside and break above the descending resistance line.
2. Stochastic move to the 50 zone.
3. MACD lines can stay in the bear zone, but the lines needs to cross and tilt to the upside.
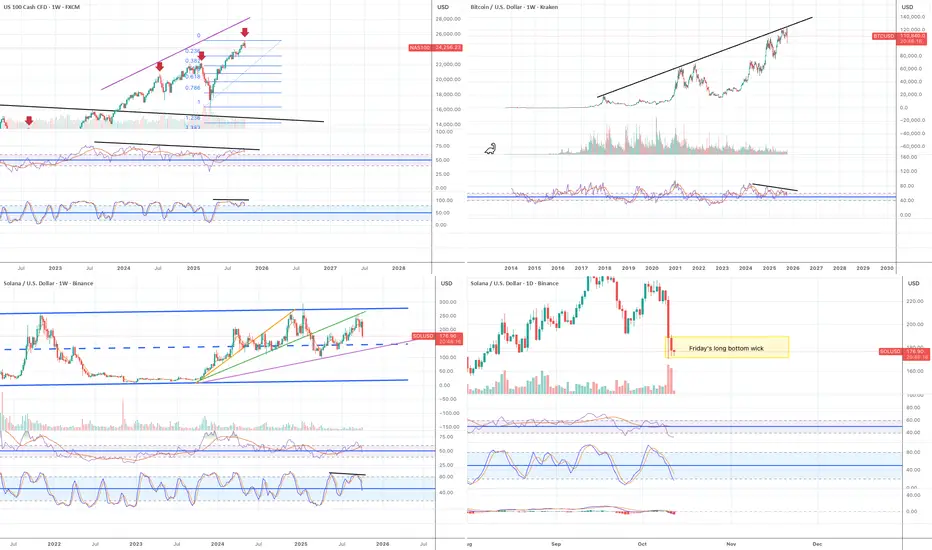
DO NOT BUY THE DIP! Watch what Nasdaq is doing. My overall bias for Solana is bullish, but right now the trend is very bearish. I don't think it is the time to buy the dip and I think more aggressive downside move is possible.
I have listed the reasons for my views below:
Nasdaq chart:
1) The correlation between Bitcoin and Nasdaq has been very high. Nasdaq has been going up since April 2025 without any decent correction and this week's candle finally formed a clear bearish engulfing candle.
2) Daily RSI and Stochastic have formed clear negative divergence and they are rolling to the downside.
Bitcoin chart:
1) RSI in both monthly and weekly charts show clear negative divergence.
2) The price failed to break above the major ascending resistance line and started to drop aggressively.
Solana chart:
Solana follows Bitcoin and Solana's move is much more aggressive than that of Bitcoin. Based on the moves of Nasdaq and Bitcoin, I am anticipating Solana will continue to drop further. Temporary recovery might be possible but I need to wait and see how Nasdaq moves this week.
Solana weekly chart:
The price is moving inside the parallel channel for the last 5 years.
The price started to move in Oct 2023 and reached $204 at Fib 0.786 level in March 2024. However, since then the price has been basically moving sideways.
I have been using the three ascending trend lines in the weekly chart along with momentum indicators as rough guides to understand the price action.
The price moved up to the top of the green trend line, failed to break above and now is heading down to the purple trend line.
RSI also rolled to the downside. Stochastic formed negative divergence.
Solana daily chart:
Friday's daily candle formed a massive bottom wick. (see the yellow rectangular box in the daily chart).
In regard to a long wick, I found on many occasions if the price doesn't immediately start to move above the closing price in the following day, the length of the wick becomes the range where the price oscillates for a while and often it moves further to the downside. Therefore, I am closely watching the price move in shorter time frames such as 15 min and 1H.
Conclusions:
Given all the positive developments happening in the Solana ecosystem, it is very hard to accept the current price action. However, as a technical trader, I need to respect what the price is telling me and it is clearly bearish. I am not shorting Solana: I am waiting for the signs of recovery.
Three blue rectangular boxes in the weekly chart are unmitigated fair value gaps and I have set the buy orders in these zones. It is difficult to think the price will come down to the bottom blue box, however, if there is a massive capitulation event, it is possible for the price to wick down to that level.
I hope you are all doing well. It is a challenging market.
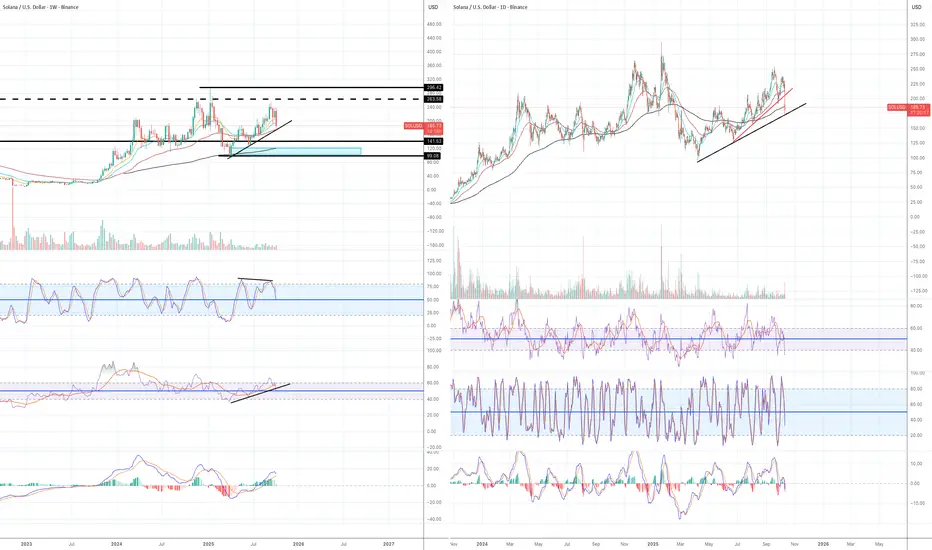
DO NOT BUY THE DIP!! It can go lower. My overall bias for Solana is bullish, but I must say it has been very frustrating asset to hold and trade for the last 18 months.
There are a lot of positive news coming up in the Solana ecosystem and the value of Solana should be much higher than the current price. However, the current chart set up is very bearish and I think it can potentially go lower. I will happily revise my view when the situation changes but I won't be buying the dip for the reasons below:
Weekly:
Stochastic indicator has formed a very clear negative divergence.
RSI lines have crossed to the downside and breached below the ascending trendline.
MACD histogram is losing bullish momentum and lines are about to cross (not confirmed)
The price has failed to go above not only the previous higher high, but also the previous cycle's all time high.
The price has breached below the ascending trendline, EMA 12 and EMA 21. (no confirmed until the end of tomorrow)
There is an unmitigated fair value gap (order block?) around $100 and $123 area (see light blue rectangular block). That is the April low when the market started to have a V-shape recovery.
I have been hearing over and over in the mainstream media that at the market bottom in April 2025, retail investors went in and bought the dip, but institutional players missed the rally by staying on the sideline. I am just wondering if big players are trying to push the price to the level where they were initially left behind. It is just my speculation, but the price is getting closer to that level.
Daily:
A daily candle closed below EMA55 and is now hovering over EMA200.
The price broke below the first ascending trendline (red line) and now moving toward the second one (black one)
All three momentum indicators have decisively entered the bear zone.
Conclusions:
I will only focus on daily and weekly charts for now. I have been watching the price move in the lower time frames and the price is refusing to go above yesterday's closing price, which makes me think there are lots of selling pressures still.
Good luck, everyone. I hope you are doing ok in this wild market.
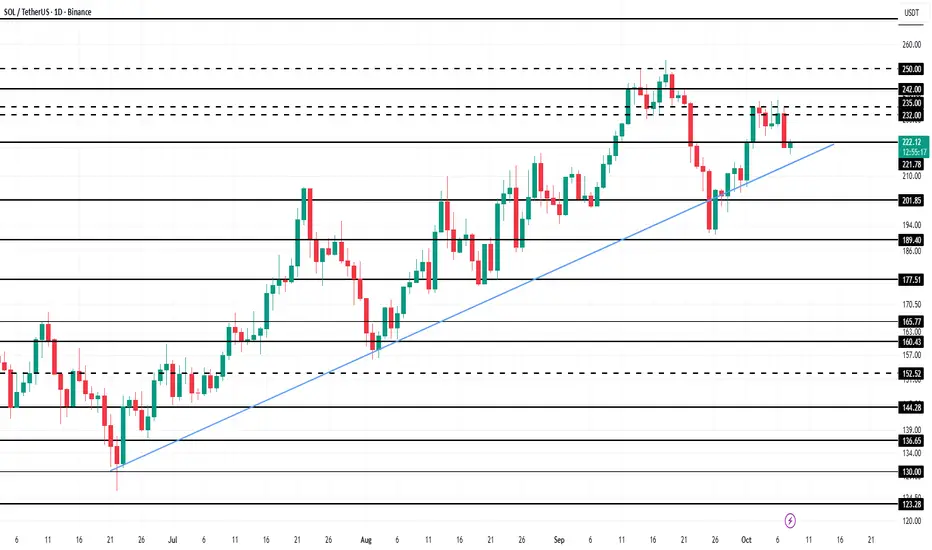
Solana Price’s 4-Month Uptrend Is Intact, But It May Not Last LoAt press time, Solana trades at $222, hovering just above the $221 support level. The altcoin has been in a consistent upward trend for the past three and a half months, making this level crucial for maintaining market structure.
Given current conditions, a dip to $213 seems likely if selling pressure increases. Stronger outflows could accelerate losses, pushing SOL to test the $200 level and breaking its multi-month uptrend.
Conversely, if Solana rebounds from $221 and market sentiment improves, it could climb toward $232 and beyond. Such a move would invalidate the bearish outlook and potentially reignite the rally.
Why Solana Could Surpass $300 in 2025–2026Hey guys, today I want to share my full view on Solana (SOL) .
For a long time, my main focus as an investor and trader was always on Bitcoin and Ethereum. But in the last 12 months, I started massively investing into Solana. The reason is simple: the ecosystem is not only recovering from its darkest days but is now proving real resilience, adoption, and growth.
When FTX collapsed in November 2022, Solana took one of the hardest hits. FTX and Alameda were among the biggest backers of the Solana ecosystem. When they went bankrupt, SOL crashed under $12 and many people stopped believing in its future. The market saw Solana as “FTX’s chain.” But fast forward to today, and we are witnessing a complete turnaround. Users are coming back, new protocols are being launched, and on-chain activity is stronger than ever.
In our crypto prop trading company , we’re building new infrastructure for our traders, and after careful research, we chose Solana as the best chain for implementation . Its speed, scalability, and near-zero fees make it the most practical blockchain to build on. And it’s not just us — many other companies and institutions are starting to integrate with Solana, which will bring even more growth in the months ahead.
⚠️ Quick disclaimer: This is not financial advice — only my humble opinion based on research, analysis, and experience.
Solana Price Action & Key Events (2022–2025)
To understand Solana’s current position, let’s look back at its journey over the last few years:
Bridge Breach (Feb 2022): The Wormhole bridge hack stole ~$325M, hurting trust in Solana DeFi.
DeFi Winter (May 2022): The Terra UST/LUNA collapse triggered a full liquidity crisis across all DeFi. Solana’s TVL drained fast.
FTX Implosion (Nov 2022): The turning point. FTX and Alameda went bankrupt, SOL crashed under $12, and the bear market bottom was defined.
Meme Season (Early 2024): Retail users came back with BONK and other meme coins. Solana’s speed and low fees made it the perfect hub for speculation.
WIF Mania (Spring 2024): Dogwifhat (WIF) went viral, volumes on Solana even surpassed Ethereum at times.
Pump.fun Frenzy (Apr 2024): Millions of tokens launched through Pump.fun, onboarding hundreds of thousands of wallets and driving record on-chain activity.
Full Recovery (2025): After two years of stagnation, SOL broke above $200 again, fully recovering to pre-FTX levels and proving that it can thrive as a community-driven, retail-driven chain.
Solana On-Chain TVL (Total Value Locked)
TVL (Total Value Locked) shows how much capital is locked in DeFi protocols on Solana — lending, staking, DEXes, and yield farming.
2021–2022: First boom, TVL surged past $10B.
2022–2023: Collapse after Terra and FTX, TVL fell close to zero.
2024–2025: Strong recovery — TVL passed $9–10B again, showing users are back and Solana DeFi is alive.
Why this matters: TVL growth proves Solana is not only about meme coins. Capital and liquidity are returning, and users are once again trusting the chain with real money.
Solana DEX Volume & Pump.fun Impact
In just one day, DEXs on Solana processed $10.3B in trading volume.
Pump.fun alone made up ~80% of that ($7.93B).
Pump.fun is unique because it allowed anyone to instantly create and trade tokens, onboarding massive numbers of new users. At its peak, Pump.fun had over 400,000 weekly active addresses , and even today it still makes up around 10% of all Solana DEX activity .
This shows two things:
Solana is the clear leader in retail-driven trading.
The ecosystem still needs broader use cases to sustain growth once meme speculation slows.
Futures Open Interest – Market Confidence
Open interest (OI) in Solana futures collapsed after FTX, but in 2024–2025 it came roaring back, growing alongside SOL’s price.
Positive: Rising OI shows traders trust Solana again, and rallies are backed by real activity.
Risk: Very high OI means higher liquidation risk. If markets turn, leveraged positions could cause sharp corrections.
Pump.fun Traders Data – Not Everyone Wins
According to Dune Analytics, 99.6% of Pump.fun traders never made more than $10K in realized profits . Only a small fraction hit big wins, while most made little or lost money.
This highlights the gambling-style nature of meme trading: it drives huge network activity but is not sustainable long-term. For Solana, the key is converting this short-term hype into long-term adoption.
Why Solana Could Rise in Late 2025–2026
Looking forward, here are the main reasons I believe Solana has strong upside potential:
1. Tokenization Boom
By 2033, $20T in assets could be tokenized.
Solana has the scalability, low fees, and adoption needed to be the leading infrastructure.
2. On-Chain Usage
Solana already surpasses Ethereum in active addresses and transactions (100M monthly users, 3.5B monthly txs).
More usage → more fees → higher staking yield → stronger SOL demand.
3. Institutional Adoption
Major players like BlackRock, Franklin Templeton, Visa, and PayPal are already launching tokenized products or stablecoin integrations on Solana.
4. Ecosystem Growth
Solana dominates in trading, token creation (60% of new tokens), and new sectors like AI agents.
From Pump.fun (retail) to xStocks and OnRe.finance (institutional), Solana is proving versatile.
5. Technology Roadmap
With Firedancer and other upgrades, Solana is moving toward 100k–1M TPS capacity, making it “internet-scale finance.”
6. Investment Case
SOL is scarce (~750M fixed supply), yield-bearing (7–13% staking), and directly tied to network growth.
Analysts project potential 4x–30x appreciation (short-term ~$900, medium ~$2,000, long-term ~$6,000).
Outlook – Target $300+
If 2022–2023 was about survival, and 2024–2025 was about recovery, then 2026 could be Solana’s breakout moment as the backbone of digital finance.
With on-chain activity at record highs, institutional adoption growing, and scalability improvements rolling out, a move above $300 in late 2025 or 2026 is not only possible but realistic.
