Update - Solana 1 Hour Bull Flag to $110My previous bull pennant idea has morphed into morphed into a larger bull flag this morning. Now must hold support at $82.84 or else this trade idea is done. Flag breakout $88.32 and the 1 hour stochastic RSI is low now. High risk to front run the trade here at $83.75 Price will meet resistance at the 1 hour 200 MA (around $95). I am still near term bullish on Solana. The target of this larger bull flag is $110.
Solanausdt

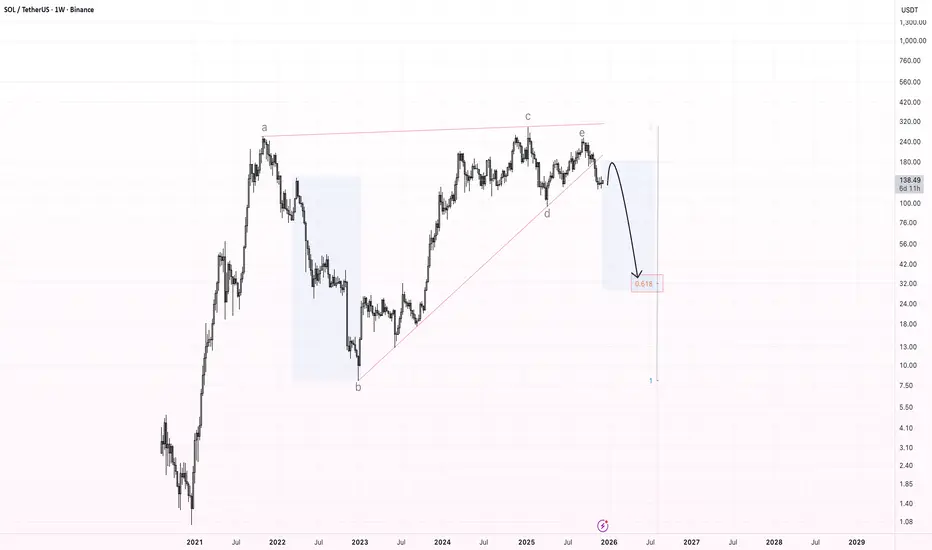
SOL – Bearish Rising Wedge Breakdown (Weekly Chart)The chart shows a large multi-year bearish rising wedge , which has now been broken to the downside. This wedge has been forming since the 2022 bottom and consists of clear wave structure (a–b–c–d–e), with the final wave e rejecting at the upper boundary and triggering the breakdown.
After this kind of pattern, the market often provides a relief bounce back into the broken support , which should now act as resistance . For SOL, the expected retest zone is located around $170–$190.
If price confirms resistance there, I expect the beginning of a larger downward wave , targeting the main Fibonacci zone near the 0.618 retracement, which aligns with a long-term target around $30–$40.
This zone marks the primary downside target for a full wedge breakdown.
Key Points:
Multi-year bearish rising wedge has broken.
Expected retest: $170–$190.
Major downside target: $30–$40 (0.618 zone).
Potential start of a macro corrective wave.
SOL/USDT Bounce Is a Trap — Bear Trend Is Still Active?CRYPTOCAP:SOL is doing exactly what bear market rallies are supposed to do 🐻📉
After a sharp sell-off, price is bouncing from demand — but don’t confuse this with strength. This move looks like a relief pullback, not a trend reversal.
Structure is still bearish and the market is below key levels. This bounce feels more like price going back to test sellers, not buyers stepping in with conviction 👀
As long as SOL stays capped below major resistance, downside pressure remains very real.
If price pushes higher, the most logical path is a retest of the major resistance zone, where sellers are likely waiting. From there, continuation to the downside toward the accumulation area makes the most sense 🧊
That zone is where long-term money will be interested — not here.
Only a strong reclaim and acceptance above major resistance would invalidate this bearish outlook. Until then, rallies are just temporary pauses in a downtrend.

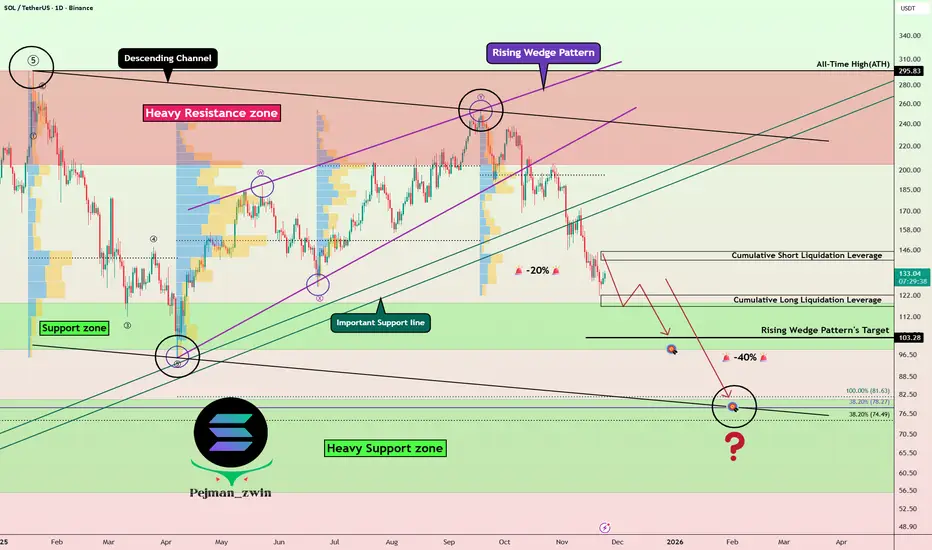
Solana Breakdown Roadmap—Is the Correction Just Getting Started?Today, I analyze the Solana( BINANCE:SOLUSDT ) project and explore its roadmap for the coming days and weeks, so stay tuned!
Solana, with the help of the Rising Wedge Pattern, has successfully broken through its important support lines and is currently moving near the Support zone($118-$98).
From an Elliott Wave perspective, it seems that Solana has completed its five main waves and is now in a corrective phase.
Given the current cryptocurrency market conditions, I expect Solana to break through the Support zone($118-$98) and at least reach the target of the rising wedge pattern, potentially dropping down to $80.
Additionally, it’s worth noting that the SOLBTC( BINANCE:SOLBTC ) pair is also showing a bearish trend, which means that if the broader crypto market declines, Solana could face even greater losses.
First Target: $107
Second Target: $83
Stop Los(SL): $174
Cumulative Long Liquidation Leverage: $122-$119
Cumulative Short Liquidation Leverage: $150-$145
💡 Please respect each other's opinions and express agreement or disagreement politely.
📌Solana Analyze (SOLUSDT), Daily time frame.
🛑 Always set a Stop Loss(SL) for every position you open.
✅ This is just my idea; I’d love to see your thoughts too!
🔥 If you find it helpful, please BOOST this post and share it with your friends.
BTC ETH SOLBuy the dip they BTFD , lol
Yes, I'm buying but not aggressively YET.
These next lower levels are looking far more likely than in prior evaluations. selling psi. continues to mount just be patient and give it time.
These levels should provide decent bounces i.e. relief rallies.
BUT I don't think that's the overall bottom either just the near-term local bottom for bounce or reaction.
If you go back and look at my much older ideas for this cycle given while still in the past cycle. I said we could end up coming back to much lower levels.
Just wait until everyone's on that $8k to $12k BTC prediction and we have candles back into the sub $45k range and see what reactions we get.
I wrote a thesis years ago about this going to $123k range and then coming back to $30k range.
That's all healthy cycle if you ask me.
You want REAL fear then to start looking at the cycles as becoming an even larger Head and shoulders, lol
Next cycle we peak in the $60-$75k range as it becomes the right shoulder, lol
Then pull a measured move from that and tell me what you see/get, lol!

SOL/USDT: Respecting the Structural Supply LineThe Macro Context Solana (SOL) continues to navigate a prolonged corrective phase on the Daily timeframe. The price action is strictly defined by a multi-month Descending Trendline, which acts as the dynamic "governor" of the current trend. Every attempt to rally into this diagonal structure has been met with supply (selling pressure), confirming its validity as a key resistance zone.
Why this setup is on our radar:
Trendline Adherence: The chart exhibits a clean series of lower highs, with the trendline connecting the liquidity peaks perfectly. The recent rejection near this structure confirms that sellers are still defending this zone aggressively.
Momentum Gatekeeper: This diagonal resistance is the line in the sand. As long as the price trades below this level, the market remains in a corrective structure. A "Change of Character" (ChoCh) can only be considered once this ceiling is breached.
Correction vs. Reversal: We are distinguishing between a "rally" and a "reversal." Current upside moves are merely relief rallies within a bearish context until proven otherwise by a structural breakout.
Technical Levels & Plan:
Watch Zone (Resistance): The immediate resistance is the descending trendline itself (dynamic level, currently acting around 135 - 140).
Invalidation Level (Bullish Shift): The bearish/corrective bias would be invalidated ONLY if we see a sustained Daily close above the trendline. This would shift momentum and open the door for higher valuations.
Structural Levels (Downside/Support): Immediate Support: 110 - 115 (Recent consolidation base) Major Structural Floor: 95 - 98 (Yearly Range Lows)
Macro / Moonbag: Structural expansion towards 160+ and beyond is conditional on reclaiming the trendline first.
Risological Note: We do not anticipate the breakout; we wait for it. Buying at resistance is a low-probability play. We remain observers until the structure shifts.
Disclaimer: This analysis is for educational purposes only. Crypto assets are highly volatile. This is not financial advice.
And if you would like to know my trading setup, check out the links below.

Coinranger|SOLUSDT. Continuing decline to 114🔥News
🔹No important news today. Only an old data on american market will be released, which is usually considered preliminary.
🔥SOL
🔹Fell to the lowest level from the last forecast.
1️⃣ Above: 125 potential pullback level.
2️⃣ Below: 118.5, 114, 110 - different levels of a downward wave sequence. 114 is the most likely for now.
Likely a continuation of the decline without news. Кeep watching BTC and ETH.
---------------
Share your thoughts in the comments!

Solana (solusdt): a correction and a possible bounceHi guys!
As you can see Solana breakout from the resistance line but it was a false breakout and then started a drop there!
I see the drop will continue at least until the gray area and then price could rise from there!
short position target: $123

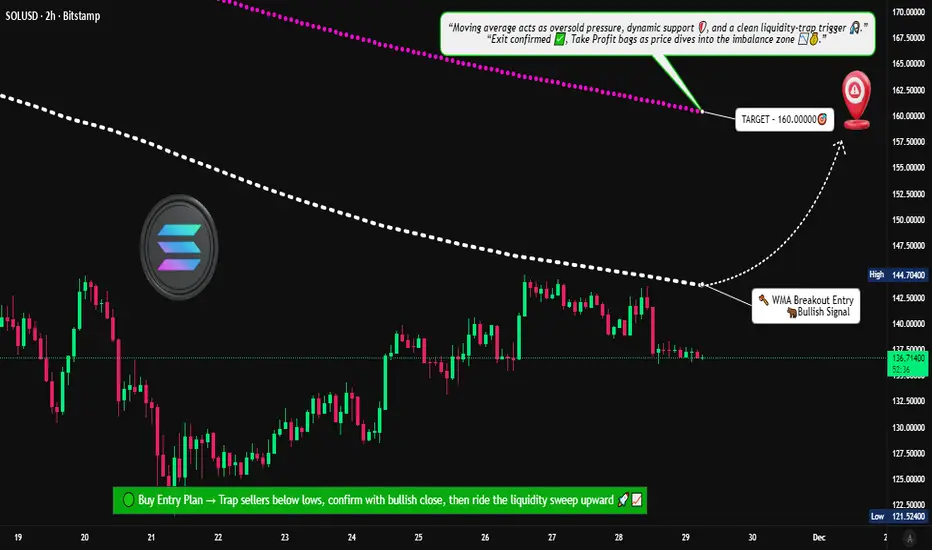
Is Solana Preparing for a New Upside Wave After WMA Breakout?📊 SOL/USD – “SOLANA VS U.S Dollar” Crypto Market Opportunity Blueprint (Swing Trade)
🟢 Trade Plan Overview
The bullish structure is confirmed after Weighted Moving Average (WMA) dynamic support breakout, signalling fresh momentum entering the market. This setup favors continuation as long as SOL holds above the breakout zone.
📌 Entry Zone
➡️ Entry: Any price level after the WMA breakout above 145.00000
The breakout + retest combination is your strongest confirmation. Let the chart validate the move—no rush entries.
🛡️ Stop Loss (Risk Protection)
➡️ Suggested SL: 132.50000
Dear Ladies & Gentlemen (Thief OG’s):
Use this SL only as a reference. Adjust based on your personal execution style, risk tolerance, and position size.
Place SL only after breakout confirmation — not before.
🎯 Profit Target
➡️ Target: 160.00000
Weighted moving averages are acting as dynamic resistance, and indicators show signs of potential overbought traps, so secure profits early instead of overstaying.
Dear Ladies & Gentlemen (Thief OG’s):
TP is your own choice. Lock in profits based on your comfort, not just my blueprint.
📚 Market Reasoning
WMA breakout shows renewed bullish strength.
Structure support aligned with higher-timeframe trend.
Volume expansion confirms buyers stepping in.
Resistance cluster around 160 remains the key zone to offload profits.
🔎 Related Pairs to Watch (Correlation & Key Notes)
💠 BITSTAMP:BTCUSD (Bitcoin)
High correlation with total crypto liquidity.
Strong BTC breakouts often pull SOL upward because altcoins follow BTC’s macro flow.
If BTC loses trend support, SOL setups weaken.
💠 BITSTAMP:ETHUSD (Ethereum)
ETH and SOL share similar Layer-1 ecosystem flows.
When ETH rallies aggressively, funds rotate into strong alts like SOL.
Good to use as a sentiment confirmation tool.
💠 COINBASE:ADAUSD (Cardano)
Another L1 competitor; correlated during broad alt-season pushes.
When ADA moves, retail interest usually spreads across L1s — including SOL.
💠 COINBASE:AVAXUSD (Avalanche)
Solana + Avalanche often move together during risk-on bursts.
AVAX momentum adds conviction to SOL’s breakout reliability.
💠 BINANCE:SOLBTC
The most important relative strength pair for SOL.
If SOLBTC is trending upward, SOL outperforms majors — huge confirmation signal for swing trades.
📈 Final Thoughts
This trade plan balances momentum, trend structure, and dynamic WMA confirmation. Follow the breakout logic, respect your risk, and let the chart guide your exits. The idea is designed to help traders act with clarity, control, and professional-level precision.
#SOL/USDT IS AT DECISIVE POINT! WHO WILL WIN? BULLS OR BEARS?SOL/USDT – Daily Outlook
SOL is attempting a trend shift after forming a higher low near the lower boundary of the descending channel. Price has bounced with strength and is now trading above the short-term moving averages.
The 13 EMA (green) is leading the move and has crossed above the 21 EMA (blue), which typically signals improving momentum and short-term trend reversal. As long as price holds above these EMAs, bulls remain in control.
🔑 Major Resistance Zone:
$155–158 → a strong resistance cluster formed by prior support-turned-resistance and EMA congestion.
📈 Bullish Scenario:
A daily close above $158 would confirm a breakout and trend continuation, opening the path toward $175–180, followed by $ 190 or higher if momentum sustains.
⚠️ Risk / Invalidation:
Rejection from $155–158 may lead to short-term consolidation or a pullback toward $133 to 127.
Overall, the structure is constructive, momentum is improving, and $158 remains the key trigger level for the next leg higher.
If you like this chart, do hit the like button and share your views in the comments.
Thank you
#PEACE

New Court Case DISASTEROUS for SOLANA?Quite silently, Solana may be heading into one of the most consequential legal challenges it has faced to date.
The implications reach far beyond short-term market of SOL -it will likely affect MANY more crypto's and projects.
A US federal judge has recently (past few days) approved a class action lawsuit to proceed against several parties tied to the Solana ecosystem, including Solana Labs and entities connected to PumpFun. This isn’t speculative rumors; the court has ruled that the claims presented are substantial enough to warrant deeper examination.
The argument of the case is an allegation that cuts directly into Solana’s technical design. Plaintiffs argue that certain insiders benefited from preferential access created by the network’s validator structure and transaction-ordering mechanisms. In practice, this allegedly allowed privileged actors to enter positions earlier, exit faster, and systematically offload risk onto retail participants.
The court’s decision suggests regulators and judges are increasingly willing to scrutinize not just token issuers or apps, but the underlying blockchain infrastructure itself when assessing fairness and market access. Therefore, it could be consequential for the rest of the crypto market as well in the near to long term.
That framing introduces a serious existential risk.

Solana (SOL): towards $117?Hi!
SOL remains in a clear descending channel, indicating sustained bearish momentum. After a period of consolidation within the rectangular range, the price recently rejected the upper boundary, forming a potential continuation pattern. The RSI sits near 40, signaling slight oversold conditions but no strong reversal yet. Price action suggests a likely retest of the channel’s lower boundary near $117.48, aligning with the support zone highlighted. Traders should watch for confirmation of a bounce at this level or continuation lower. Short-term pullbacks may occur, but the dominant trend remains bearish.
Conclusion: Trend-following strategy favored; bearish continuation likely, $117 support key.

Solana vs USD – Bearish Playbook High-Probability Swing Setup🔹 Asset: SOL/USD – “SOLANA VS U.S. DOLLAR”
🔹 Trade Style: Crypto Market Opportunity Blueprint (Swing Trade)
🔻 Plan: Bearish Plan
📍 Entry Zone
You can enter at any price level according to your strategy and confirmation signals.
🛑 Stop Loss (SL)
This is Thief SL → @ 152.50
Dear Ladies & Gentleman (Thief OG’s), adjust your SL based on your own strategy & risk levels.
🔔 Important:
Place SL only after breakout confirmation.
I am not recommending to use only my SL. It’s your choice — you make money, you take money at your own risk.
🎯 Target (TP)
Market has strong support + oversold conditions + potential trap zones, so kindly exit with profits.
Our Target → @ 125.00
🔔 Important:
Dear Ladies & Gentleman (Thief OG’s), I am not recommending to use only my TP.
It’s your choice — you make money, you take money at your own risk.
📊 Related Pairs to Watch (Correlation Guide)
1️⃣ BITSTAMP:BTCUSD – Bitcoin
King of crypto; SOL often follows BTC’s direction.
If BTC breaks down, SOL bearish continuation becomes stronger.
2️⃣ BITSTAMP:ETHUSD – Ethereum
High correlation with major altcoins.
ETH weakness usually signals pressure on L1 chains like SOL.
3️⃣ COINBASE:AVAXUSD – Avalanche
Competitor L1 chain; often moves in similar sentiment flow.
If AVAX also shows bearish structure → confirms broad L1 weakness.
4️⃣ COINBASE:LTCUSD – Litecoin
Old major coin; used for risk-on/risk-off sentiment checks.
If LTC dumps → market-wide bearish confirmation.
5️⃣ CRYPTOCAP:TOTAL2 – Altcoin Market Cap
Measures overall altcoin health.
If TOTAL2 breaks its support → SOL likely accelerates toward bearish target.
🔍 Why These Pairs Matter? (Key Correlation Points)
BTC sets the tone – SOL follows the major trend 75–85% of the time.
ETH determines altcoin liquidity – if ETH dominance rises, SOL loses capital flow.
AVAX acts as sector correlation – L1 competitors weaken together during bearish cycles.
TOTAL2 confirms broad alt weakness, making SOL’s downside more reliable.

SOL/USDT Update — Bullish Trend Structure and Resistance Ahead“🚨 Solana vs Tether: Bullish Heist on SOL/USDT 💰”
📊 Description
Market: SOL/USDT
Bias: Bullish (Swing / Day Trade)
✅ Trade Plan
Entry: 🎯 Any good support / demand area — stay alert & flexible.
Stop Loss: 🛡️ “Thief SL” @ 160.00 USDT — this is my SL, not yours. Manage your own risk!
Targets (TP):
• 🎯 Target 1: 215.00 USDT
• 🏁 Target 2: 240.00 USDT
⚠️ Heads up: Use your discretion. Do not blindly follow my SL/TP — trade responsibly, at your own risk.
🔍 Key Insights / Logic
🚧 Expect resistance & traps near 215–240 — don’t get stuck in overbought zones.
📈 Momentum is building; structure is favorable on retests.
🔊 Watch volume on impulsive moves — rising volume = strength.
🔄 Related pairs / correlation watch:
• BINANCE:SOLBTC — strength vs BTC strengthens the bullish case.
• BINANCE:ETHUSDT — altcoin momentum may carry SOL upward.
• BINANCE:BNBUSDT — BNB strength can support ecosystem flow.
✨ “If you find value in my analysis, a 👍 and 🚀 boost is much appreciated — it helps me share more setups with the community!”
#SOL #SOLUSDT #Solana #CryptoSwing #CryptoDayTrade #AltcoinAnalysis #TradingViewIdeas #CryptoFun

SOLANA: Wave Energy on the Threshold of ImpulseSOLANA: Wave Energy on the Threshold of Impulse
Based on the current wave structure, Solana is completing its corrective phase and preparing to form a new movement. The chart shows a transition from sideways momentum to a more pronounced impulse, which could set the direction for the near term.
Primary scenario: After the correction ends, a downward impulse sequence is expected to develop. Alternative scenario: If the market consolidates above recent highs, it could continue to rise, delaying the start of a new downward wave.
Idea for traders: Watch for confirmation of the structure on lower timeframes and enter only after clear reversal signals appear.
Risk management: Use clear stop levels and adjust your plan as new impulses emerge.
Friends, more wave analysis is available in our profile.
Subscribe to stay up to date with wave analysis!
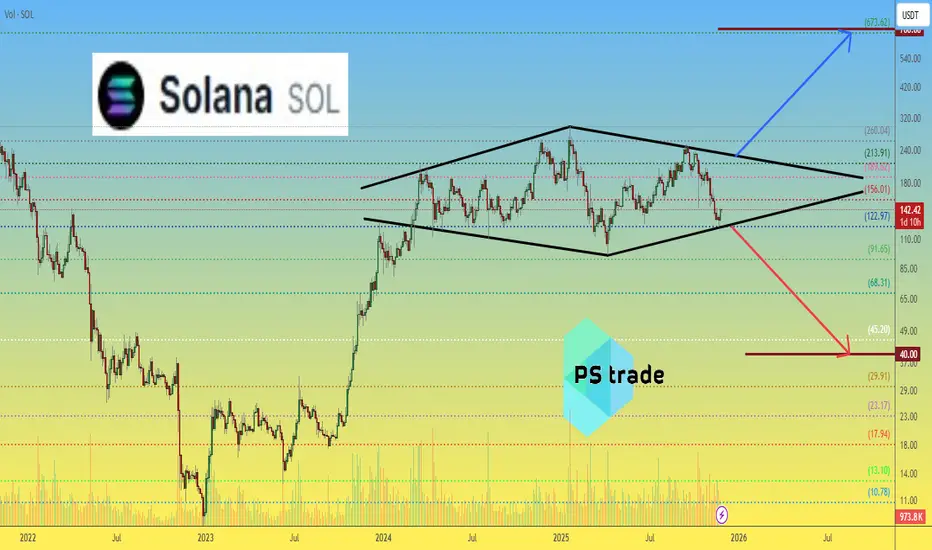
Solana SOL price analysisA notable long-term structure is developing on the OKX:SOLUSDT chart — a 1.5-year consolidation resembling a broad “diamond” formation.
Such structures in classical technical analysis often appear near the end of distribution phases and may precede a deeper downside continuation.
From this perspective, a potential move toward the $40 region cannot be excluded.
At the same time, market data presents a contrasting signal:
• #Solana ETF remains one of the few crypto-related instruments consistently showing positive daily inflows
• Both CRYPTOCAP:BTC and CRYPTOCAP:ETH ETFs have not demonstrated the same level of capital interest
• This suggests that institutional positioning around CRYPTOCAP:SOL may be slowly increasing
If capital inflows persist, higher-timeframe upside scenarios — even toward the $700 region — could remain on the table in the broader macrotrend.
What scenario do you find more probable at this stage: deeper correction or long-term continuation?
______________
◆ Follow us ❤️ for daily crypto insights & updates!
🚀 Don’t miss out on important market moves
🧠 DYOR | This is not financial advice, just thinking out loud
SOL Short 1D Rebalancing the bearish inefficiency is likely to lead to further development of the downward movement.

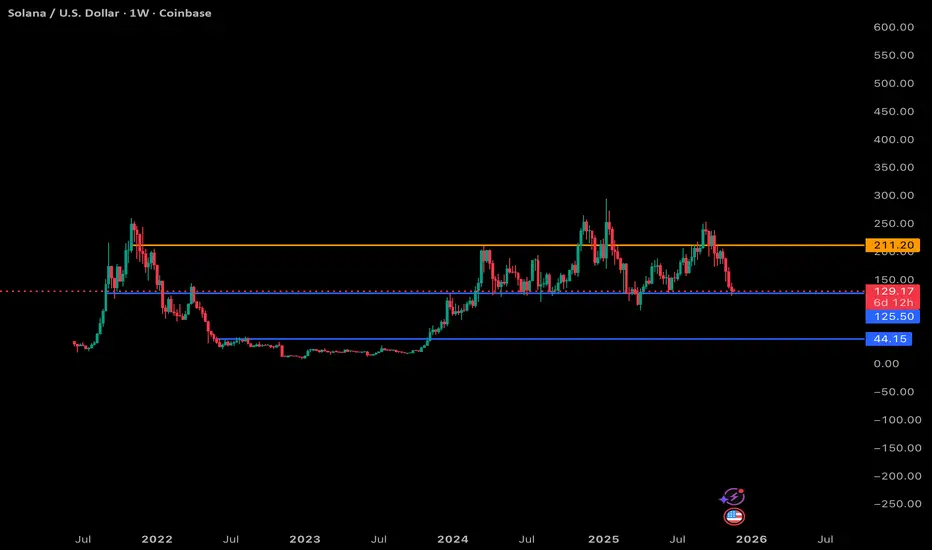
SOL 1W Breakdown: Key Levels, What I’m Watching Next Nov 24 2025Here’s my read on Solana’s weekly chart using the same structure as the BTC and ETH analyses.
Blue = support, orange = resistance, and the dotted mid-range is acting like a pivot zone.
Support Levels (Blue)
$125.50: This is the line SOL is sitting right on top of right now. It’s been a key mid-range level for almost two years. Losing this on the weekly would be a clear bearish signal because there isn’t much structural support underneath until the next major zone.
$44.15: This is the big, deep support from the 2022–2023 accumulation base. I’m not calling for this immediately, but structurally there’s a lot of empty space between $125 and $44. If the macro rolls over and SOL can’t defend the mid-range, we could see a slow bleed or capitulation wick toward this zone.
Resistance (Orange)
$211: This is the major weekly resistance for SOL and has been the top of every rally since 2022. Until SOL can close above this level and hold it, any upside is still just range movement.
My Current Thoughts
SOL is in a tricky spot. We’re sitting right on that $125ish support, and this is basically the “bounce here or things get uncomfortable fast” level.
If we don’t get a bounce:
The chart opens up a pretty big air pocket down to the next structural support.
Weekly structure turns decisively bearish.
SOL likely enters a multi-month corrective phase similar to what it did in 2022/2023 (but obviously not the same magnitude).
If we do bounce:
SOL can chop around this mid-range again, possibly retesting $150–175.
But it still needs a clean reclaim of $211 to resume a real macro uptrend.
Overall View
SOL’s weekly chart is way less forgiving than BTC or ETH right now. The range is clear, but we’re testing the bottom of it, and losing this level puts a lot of downside in play. From a structural standpoint, this is the most important support SOL has tested in a long time. If it holds, cool, if it breaks, we probably enter a much deeper reset.
Slow grind or big drop, the next weekly close is going to be telling.
SOLUSD; Heikin Ashi Trade Idea📈 Hey Traders!
Here’s a fresh outlook from my trading desk. If you’ve been following me for a while, you already know my approach:
🧩 I trade Supply & Demand zones using Heikin Ashi chart on the 4H timeframe.
🧠 I keep it mechanical and clean — no messy charts, no guessing games.
❌ No trendlines, no fixed sessions, no patterns, no indicator overload.
❌ No overanalyzing market structure or imbalances.
❌ No scalping, and no need to be glued to the screen.
✅ I trade exclusively with limit orders, so it’s more of a set-and-forget style.
✅ This means more freedom, less screen time, and a focus on quality setups.
✅ Just a simplified, structured plan and a calm mindset.
💬 Let’s Talk:
💡Do you trade supply & demand too ?
💡What’s your go-to timeframe ?
💡Ever tried Heikin Ashi ?
📩 Got questions about my strategy or setup? Drop them below — ask me anything, I’m here to share.
Let’s grow together and keep it simple. 👊

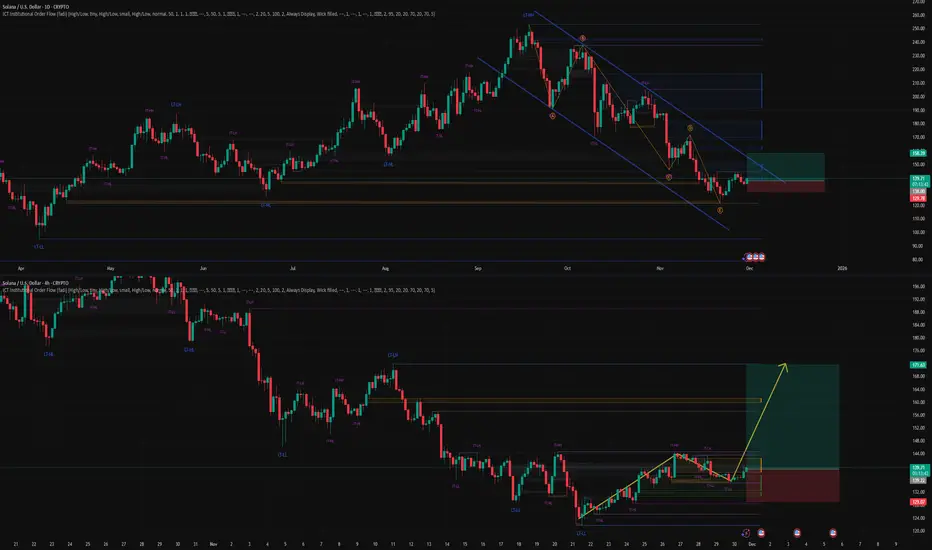
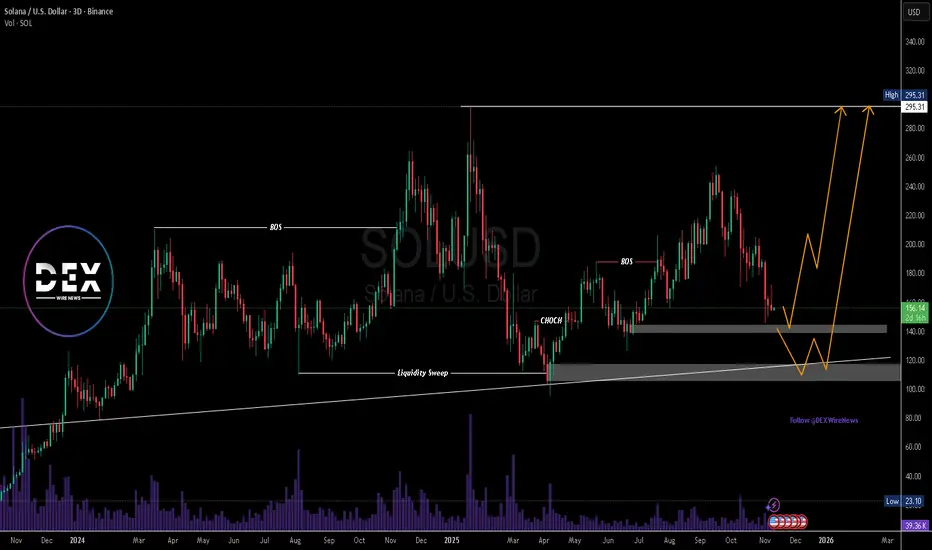
$SOLUSD Eyes Key Demand Zone Before Potential Macro BreakoutSolana (SOL/USD) is approaching a pivotal technical zone that could define its next major move. After an extended corrective leg from the $254 region, the price has retraced toward key demand areas, around $140, and around $120 where prior liquidity sweeps and structural reversals have historically emerged.
The chart reveals a repeating market behavior where Solana establishes a base within strong demand zones before launching decisive bullish impulses. An external structure Break of Structure (BOS) from previous swing highs, followed by an internal Change of Character (CHOCH) confirmation, after a retracement, suggests the broader bullish structure remains intact despite short-term weakness due to macro- economic challenges.
Should price hold the $120 range, a rebound toward the $295 previous highs appears probable. However, if sellers drive price lower, deeper liquidity could be collected near the $115–$120 region, aligning perfectly with the ascending trendline and long-term support base. This would likely create a high-probability accumulation phase before another impulsive leg higher.
Volume trends show healthy market participation during both expansions and pullbacks, reflecting consistent investor interest in Solana’s price action. Fundamentally, Solana’s growing adoption across DeFi, NFTs, and high-performance dApp ecosystems continues to strengthen the bullish bias.
A confirmed reversal from current levels could set the stage for a macro breakout toward the $295 zone, which represents a higher high of the external bullish structure and a psychological milestone for market participants.
In summary, Solana’s technical framework signals that the market is in a late-stage correction within a larger bullish cycle. A clean defense of the $140 zone would reinforce the bullish continuation narrative, while a brief dip into the $115 zone could form the final liquidity trap before another surge toward new highs
SOL Short SOL Short 📉
In the medium term, I am bearish.
Rebalancing the bearish inefficiency (POI) is likely to lead to continued aggressive markdowns, which can be used to open a short position.

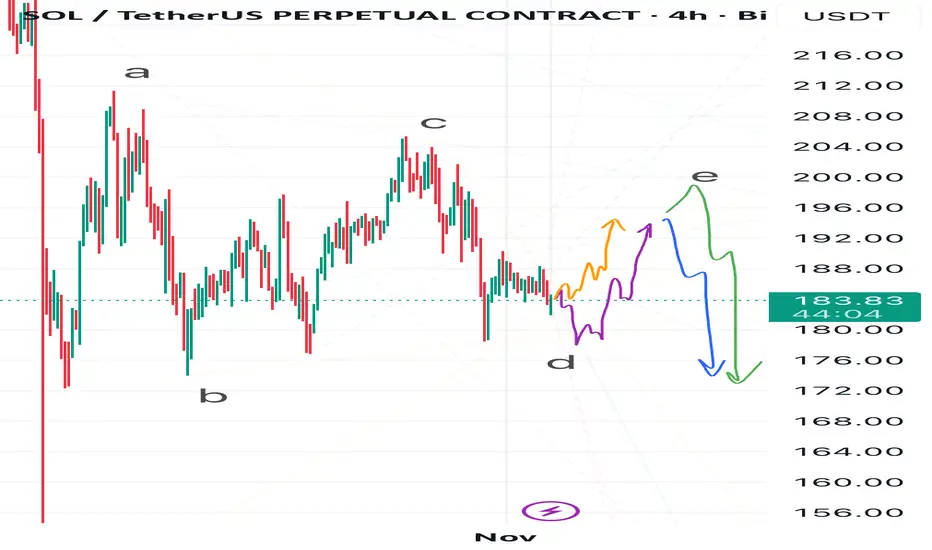
Solana Swing — D or E in the Ring?I see several possible scenarios for Solana at the moment.
In my view, either wave D of the corrective ABCDE triangle has already formed, and the price will follow the orange path, starting to build wave E —
or wave D isn’t complete yet, and Solana might still drop toward 178 or even lower, following the purple path, before beginning wave E.
As for wave E, I also see two possible outcomes:
• The green path, where wave E extends up to around 200,
• Or the blue path, where wave E ends near 194–196, followed by a downside breakout from the triangle, sending Solana toward ~170 or even lower.
💬 Which scenario do you find more likely? Share your thoughts in the comments!
SOLANA Pullback - DailyThis crypto coin has been bearish on the past few days, but it seems as it is a slight pullback towards the demand zone at 160 and 130, before it shoots upwards.
Let us wait and see if we can have a selling opportunities, aiming towards those zones.
