SOL/USDT — Weekly Chart Update. SOL/USDT — Weekly Chart Update
SOL is testing a major demand zone around $100–110, right where price has reacted multiple times before.
The 200-week MA (green) is just below price — a key long-term support area.
Market structure is still lower highs after the $240 peak → medium-term pressure remains.
Hold above $100 = base building & potential bounce toward $130–150.
Weekly close below $100 = risk of deeper pullback toward $80–90.
Summary: This is a make-or-break zone for SOL. Bulls need to defend here to flip momentum.
Sollong

#SOL/USDT Final Liquidity Zone Before Expansion ?#SOL
The price is moving within a descending channel on the hourly timeframe. It has reached the upper boundary and is heading towards breaking it. A retest of this boundary is expected.
The Relative Strength Index (RSI) is showing an upward trend, as it has approached the upper boundary. A bearish reversal is expected.
There is a key support zone in green at 114.50. The price has bounced from this zone several times and is expected to bounce again.
A consolidation trend is observed above the 100-period moving average, which we are approaching. This trend supports a decline towards this level.
Entry Price: 116.78
Target 1: 117.96
Target 2: 119.91
Target 3: 122.82
Stop Loss: Above the green support zone.
Don't forget one simple thing: Money Management.
For any questions, please leave a comment.
Thank you.

SOLUSDT 1,360% profits potential with 8X leverage —LONG tradeMany projects crashed in October or November 2025, new major lows, new all-time lows; pretty bad. Solana remains really strong, just like Bitcoin, Ethereum and some others.
The last low happened mid-December last year and this low ended as a higher low compared to early April 2025. This is a strong bullish signal.
SOLUSDT now has a flat bottom with decreasing bearish volume. This type of chart setup supports a trend reversal. This chart setup supports change. This chart setup supports a bullish wave. We are going up next. And, for this reason, I am sharing with you this set of trade-numbers... I hope you find them useful.
_____
LONG SOLUSDT
Leverage: 8X
Potential: 1360%
Allocation: 5%
Entry zone: $116 - $126
Targets:
1) $137
2) $149
3) $169
4) $185
5) $201
6) $224
7) $253
8) $286
9) $306
10) $338
Stop: $112
_____
Thank you for reading. Your continued support is highly appreciated.
Namaste.

#SOL/USDT Final Liquidity Zone Before Expansion ?#SOL
The price is moving within a descending channel on the hourly timeframe. It has reached the lower boundary and is heading towards a breakout, with a retest of the upper boundary expected.
The Relative Strength Index (RSI) is showing a downward trend, approaching the lower boundary, and an upward bounce is anticipated.
There is a key support zone in green at 132. The price has bounced from this level several times and is expected to bounce again.
The indicator is showing a trend towards consolidation above the 100-period moving average, which we are approaching, supporting the upward move.
Entry Price: 133.50
First Target: 134.93
Second Target: 137.30
Third Target: 140.25
Stop Loss: Below the green support zone.
Remember this simple thing: Money management.
For any questions, please leave a comment.
Thank you.

#SOL/USDT may continue its trend after correction#SOL
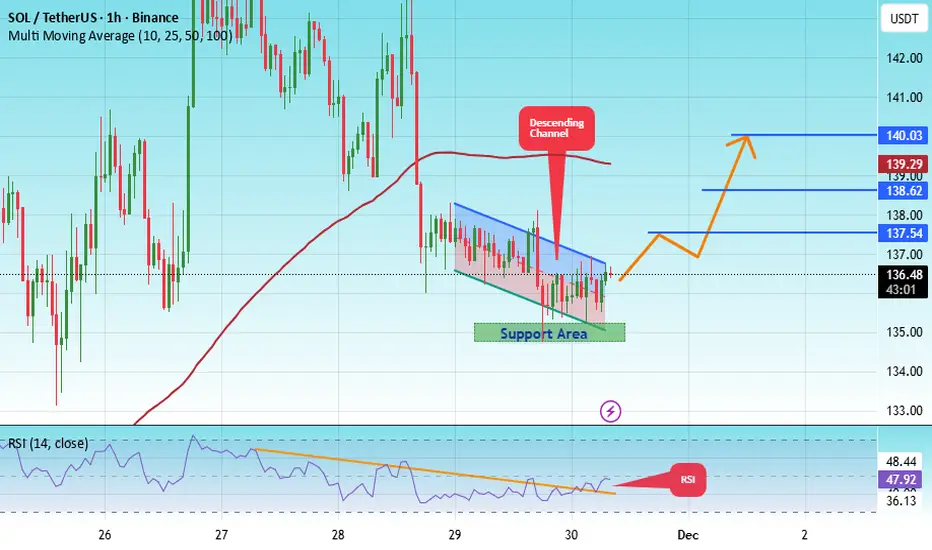
The price is moving in a descending channel on the 1-hour timeframe. It has reached the upper limit and is heading towards breaking it. A retest of the upper limit is expected.
We have an upward trend on the RSI indicator, which has reached near the upper limit. A downward reversal is expected.
There is a key support zone in green at 139.70. The price has bounced from this zone multiple times and is expected to bounce again.
We have a trend of consolidation above the 100-period moving average, as we are moving close to it. This supports a downward move towards touching this level.
Entry price: 137.70
First target: 136.15
Second target: 135.09
Third target: 133.66
Stop loss above the resistance zone in green.
Don't forget a simple thing: money management.
For inquiries, please leave a comment.
Thank you.

SOL/USDT – Accumulation or Continuation? Key Support!SOL/USDT on the 8-hour timeframe is still moving within a bearish corrective structure / broader downtrend, characterized by a series of lower highs and lower lows since the rejection from the 230+ area.
Currently, price is trading inside a strong historical demand zone at 127–121, which previously acted as a major accumulation and bounce area.
Price is now consolidating above this demand zone while pressing against a descending trendline, making this area a critical decision zone for the next major move.
---
Pattern & Price Structure
1. Descending Trendline (Bearish Pressure)
The descending trendline remains valid and unbroken
Each recovery move continues to be capped by this trendline
Indicates seller dominance is still present
2. Demand Zone / Support Base (127 – 121)
The yellow box marks a strong demand zone
Multiple lower-wick rejections indicate active buying interest
Price is forming a base / consolidation range above support
3. Compression Pattern (Range Tightening)
Price is compressed between:
Dynamic resistance (descending trendline)
Static support (demand zone)
This structure often leads to a high-momentum breakout
---
Key Levels
Dynamic Resistance: Descending trendline
Horizontal Resistances:
144
154.5
167
177
Major Support:
127
121
Invalidation Level:
Strong close below 121
---
Bullish Scenario
The bullish scenario is valid if:
1. Price holds above the 127–121 demand zone
2. A strong candle close breaks above the descending trendline
3. Volume expansion confirms the breakout
Upside Targets:
144 (minor resistance)
154.5 (key reaction level)
167 (mid-range resistance)
177 (major resistance)
A confirmed breakout above the trendline may signal a trend reversal or bullish continuation from a base structure.
---
Bearish Scenario
The bearish scenario occurs if:
1. Price fails to break the descending trendline
2. A strong breakdown and close below 121
3. The demand zone fails to absorb selling pressure
Downside Risk:
116.8 (previous low)
Further downside could form new lower lows, continuing the broader bearish trend
---
Conclusion
SOL/USDT is currently at a critical decision area.
The 127–121 demand zone is the key level to watch:
Holding support + trendline breakout → bullish reversal potential
Demand breakdown → bearish continuation
Patience is required. Wait for clear breakout or breakdown confirmation before committing to a directional trade.
---
#SOLUSDT #Solana #CryptoAnalysis #TechnicalAnalysis #DescendingTrendline #DemandZone #SupportResistance #AltcoinTrading #CryptoMarket

#SOL/USDT Final Liquidity Zone Before Expansion ?#SOL
The price is moving in a descending channel on the 1-hour timeframe. It has reached the lower boundary and is heading towards breaking above it, with a retest of the upper boundary expected.
We have a downtrend on the RSI indicator, which has reached near the lower boundary, and an upward rebound is expected.
There is a key support zone in green at 122.00. The price has bounced from this level multiple times and is expected to bounce again.
We have a trend towards stability above the 100-period moving average, as we are moving close to it, which supports the upward movement.
Entry price: 124.00
First target: 125.48
Second target: 127.15
Third target: 129.63
Stop loss: Below the support zone in green.
Don't forget a simple thing: capital management.
For inquiries, please leave a comment.
Thank you.

#SOL/USDT Final Liquidity Zone Before Expansion ?#SOL
The price is moving in a descending channel on the 1-hour timeframe. It has reached the lower boundary and is heading towards breaking above it, with a retest of the upper boundary expected.
We have a downtrend on the RSI indicator, which has reached near the lower boundary, and an upward rebound is expected.
There is a key support zone in green at 123.66. The price has bounced from this zone multiple times and is expected to bounce again.
We have a trend towards stability above the 100-period moving average, as we are moving close to it, which supports the upward movement.
Entry price: 126.20
First target: 127.76
Second target: 129.00
Third target: 130.74
Don't forget a simple thing: money management.
Place your stop-loss below the support zone in green.
For any questions, please leave a comment.
Thank you.

SOLUSDT – 4H Chart Analysis. SOLUSDT – 4H Chart Analysis.
SOL is trading inside a descending wedge/compression zone
Price is hugging the lower trendline, indicating that selling pressure is losing strength
Volatility has contracted, hinting at a decision move soon
Support:-
120 – 118 → Immediate support
112 – 110 → Major demand/breakdown level
108 → Last HTF support if panic expands
Resistance:-
126 – 128 → First resistance
132 – 135 → Trendline resistance
140+ → Breakout continuation zone
During Extreme Fear, assets often move sideways near support to absorb sell pressure before direction expansion.
This is a wait-for-confirmation zone, not a blind entry area.
DYOR | NFA

SOLUSDT – Long Trade Setup and Analysis | 4H)SOLUSDT – Long Trade Setup and Analysis | 4H)
SOL is currently trading within a high-probability demand zone (123–121) that has been tested multiple times. Price compression at this base suggests that sellers are exhausted, and an upward reaction is likely.
Trade Plan
Entry Zone: 123 – 121
Stop-Loss: Below 121 (Daily close preferred)
Targets:
T1: 132 – 135
T2: 140 – 145 (Major resistance and range high)
Technical Analysis
Strong Horizontal Support: Multiple reactions confirm that buyers are active.
RSI ~35: Near oversold territory → increases the probability of a bounce.
Liquidity Sweep: Wick reversal below support indicates a stop-hunt before the reversal.
Structure: Downside momentum is slowing; base formation is visible.
DYOR | NFA.

#SOL/USDT Final Liquidity Zone Before Expansion?#SOL
The price is moving in a descending channel on the 1-hour timeframe. It has reached the lower boundary and is heading towards a breakout, with a retest of the upper boundary expected.
We are seeing a bearish bias in the Relative Strength Index (RSI), which has reached near the lower boundary, and an upward bounce is expected.
There is a key support zone in green at 130, and the price has bounced from this level several times. Another bounce is expected.
We are seeing a trend towards stabilizing above the 100-period moving average, which we are approaching, supporting the upward trend.
Entry Price: 132
First Target: 134
Second Target: 137
Third Target: 140
Remember a simple principle: Money Management.
Place your stop-loss order below the green support zone.
For any questions, please leave a comment.
Thank you.

#SOL/USDT Final Liquidity Zone Before Expansion?#SOL
The price is moving in a descending channel on the 1-hour timeframe. It has reached the lower boundary and is heading towards breaking above it, with a retest of the upper boundary expected.
We have a downtrend on the RSI indicator, which has reached near the lower boundary, and an upward rebound is expected.
There is a key support zone in green at 135. The price has bounced from this zone multiple times and is expected to bounce again.
We have a trend towards stability above the 100-period moving average, as we are moving close to it, which supports the upward movement.
Entry price: 136.60
First target: 137
Second target: 138
Third target: 140
Don't forget a simple principle: money management.
Place your stop-loss below the green support zone.
For any questions, please leave a comment.
Thank you.
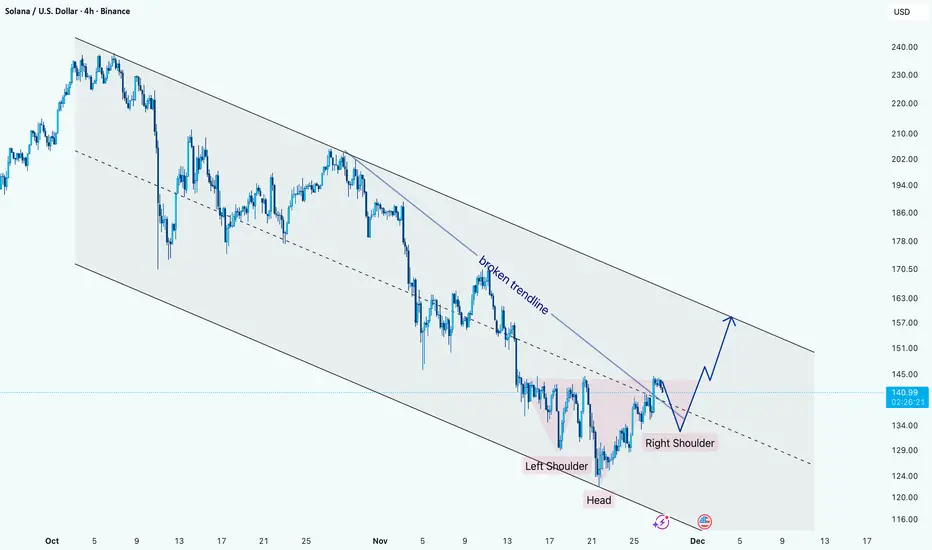
SOL Reversal Structure Forming Inside Downtrend ChannelHi!
Solana is trading inside a well-defined descending channel, but momentum is shifting. Price has broken the inner descending trendline and is now forming a clear inverse Head & Shoulders at the bottom of the structure.
The neckline zone has been tested multiple times, showing growing buyer strength. As long as price holds above the right-shoulder support, the structure favors a bullish continuation.
A breakout above the neckline opens the way toward the upper boundary of the main descending channel, with the next key reaction zone near $155–160. Failure to hold the right shoulder would delay the reversal and pull the price back toward mid-channel support.
#SOL/USDT Bullish trend analysis Read The caption#SOL
The price is moving within an ascending channel on the 1-hour timeframe and is adhering to it well. It is poised to break out strongly and retest the channel.
We have a downtrend line on the RSI indicator that is about to break and retest, which supports the upward move.
There is a key support zone in green at the 137 price, representing a strong support point.
We have a trend to stabilize above the 100-period moving average.
Entry price: 141
First target: 143
Second target: 145
Third target: 148
Don't forget a simple money management rule:
Place your stop-loss order below the green support zone.
Once you reach the first target, save some money and then change your stop-loss order to an entry order.
For any questions, please leave a comment.
Thank you.

#SOL/USDT is going to breakout from descending channel 18% gain#SOL
The price is moving within an ascending channel on the 1-hour timeframe and is adhering to it well. It is poised to break out strongly and retest the channel.
We have a downtrend line on the RSI indicator that is about to break and retest, which supports the upward move.
There is a key support zone in green at the 162 price, representing a strong support point.
We have a trend to stabilize above the 100-period moving average.
Entry price: 164
First target: 166
Second target: 168
Third target: 171
Don't forget a simple money management rule:
Place your stop-loss order below the green support zone.
Once the first target is reached, save some money and then change your stop-loss order to an entry order.
For any questions, please leave a comment.
Thank you.

#SOL/USDT — Critical Retest at Demand Zone vs Long-Term Downtr#SOL
The price is moving within an ascending channel on the 1-hour timeframe and is adhering to it well. It is poised to break out strongly and retest the channel.
We have a downtrend line on the RSI indicator that is about to break and retest, which supports the upward move.
There is a key support zone in green at the 158 price, representing a strong support point.
We have a trend to stabilize above the 100-period moving average.
Entry price: 159
First target: 161
Second target: 164
Third target: 168
Don't forget a simple money management tip:
Place your stop-loss order below the green support zone.
Once you reach the first target, save some money and then change your stop-loss order to an entry order.
For any questions, please leave a comment.
Thank you.

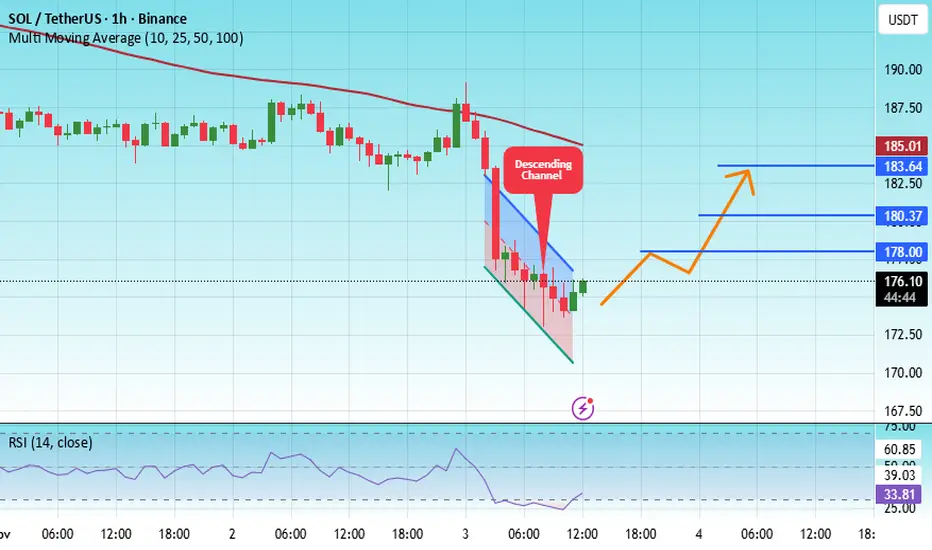
#SOL/USDT The Next Explosion, Hidden Clues in Price Behavior
#SOL
The price is moving within an ascending channel on the 1-hour timeframe and is adhering to it well. It is poised to break out strongly and retest the channel.
We have a downtrend line on the RSI indicator that is about to break and retest, which supports the upward move.
There is a key support zone in green at 172.80, representing a strong support point.
We have a trend to stabilize above the 100-period moving average.
Entry price: 175.50
First target: 178
Second target: 180
Third target: 183
Don't forget a simple money management rule:
Place your stop-loss order below the support zone in green.
Once the first target is reached, save some money and then change your stop-loss order to an entry order.
For any questions, please leave a comment.
Thank you.
#SOL/USDT chart (1-hour timeframe)...#SOL
The price is moving in a descending channel on the 1-hour frame and is expected to break and continue upward.
We have a trend to stabilize above the 100 moving average again.
We have a downtrend on the RSI indicator that supports the upward move with a breakout.
We have a major support area in green that pushed the price higher at 188.
Entry price: 195.
First target: 200.
Second target: 207.
Third target: 214.
To manage risk, don't forget stop loss and capital management.
When you reach the first target, save some profits and then change the stop order to an entry order.
For inquiries, please comment.
Thank you.

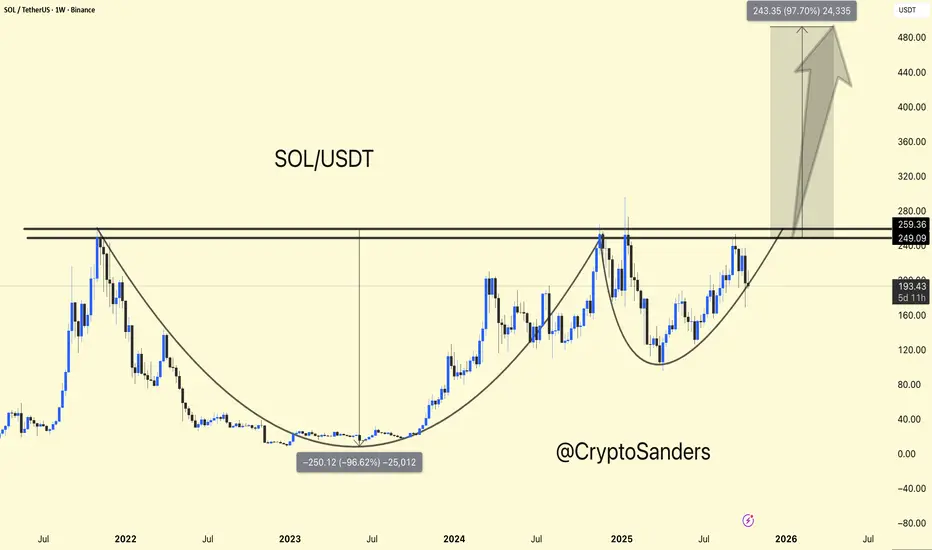
SOL/USDT Weekly Chart Update !! SOL/USDT Weekly Chart Update
SOL is forming a massive cup and handle pattern on the weekly timeframe – a strong bullish continuation setup leading to a major breakout.
Currently trading around $199, SOL is consolidating below the key resistance level of $250-$260. Once we achieve a weekly close above $260, it could confirm a breakout move towards $450-$480 (approximately +90-100% upside).
Support: $170-$180 (handle base/accumulation zone)
Resistance: $250-$260 (breakout zone)
Target: $450-$480
Overall sentiment remains bullish – the structure is clear, and momentum is building. A confirmed breakout above the resistance level could mark the start of SOL's next major surge.
DYOR | NFA
#SOL/USDT | SOL: Market Calms After Sharp Move & RSI Support#SOL
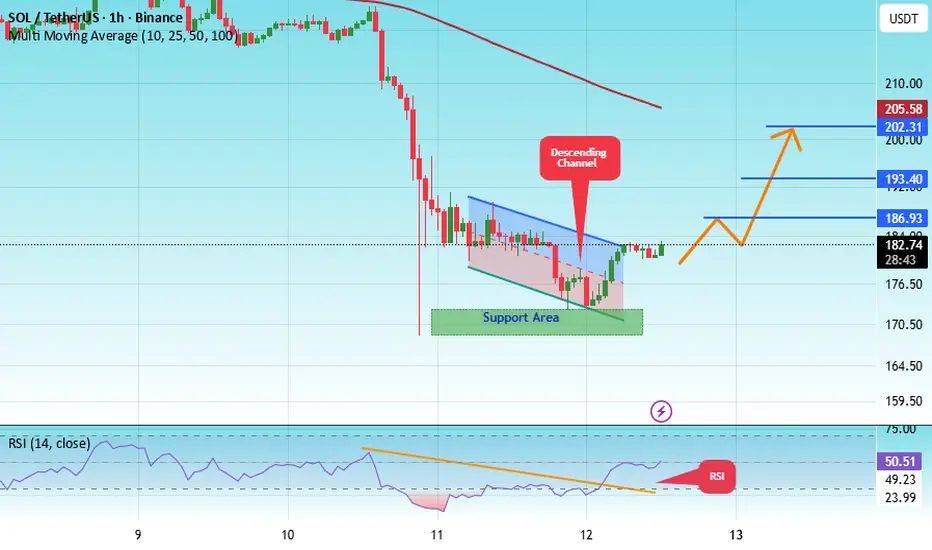
The price is moving within a descending channel on the 1-hour frame, adhering well to it, and is heading for a strong breakout and retest.
We have a bearish trend on the RSI indicator that is about to be broken and retested, which supports the upward breakout.
There is a major support area in green at 170, representing a strong support point.
We are heading for consolidation above the 100 moving average.
Entry price: 182.
First target: 186.
Second target: 193.
Third target: 202.
Don't forget a simple matter: capital management.
When you reach the first target, save some money and then change your stop-loss order to an entry order.
For inquiries, please leave a comment.
Thank you.
BTC, ETH, SOL Support, Resistance, and Discovery Zones From HereHere's the 'heat map' for Bitcoin, ETH and Solana's prices from here.
Despite the big liquidation target zone and buy limit order concentration in the $106k zone in Green...
Price pushed higher the last few days as 'Uptober' took hold and the US Government shut down, effectively silencing any negative economic news releases.
Plus we can see that 2 more rate cuts are virtually guaranteed in October and December.
So, very likely that Bitcoin rallies to new ATH later in October into November.
However, I'm seeing sell block pressure just above on Bitcoin in the $121k - $124k range, and also on the TOTAL market cap.
What's interesting is that I'm not seeing any sell block pressure on TOTAL2 or TOTAL3, indicating that Alts are more likely to push higher from here, as BTC retraces.
What do you think?

#SOL/USDT bullish structure formed at the chart#SOL
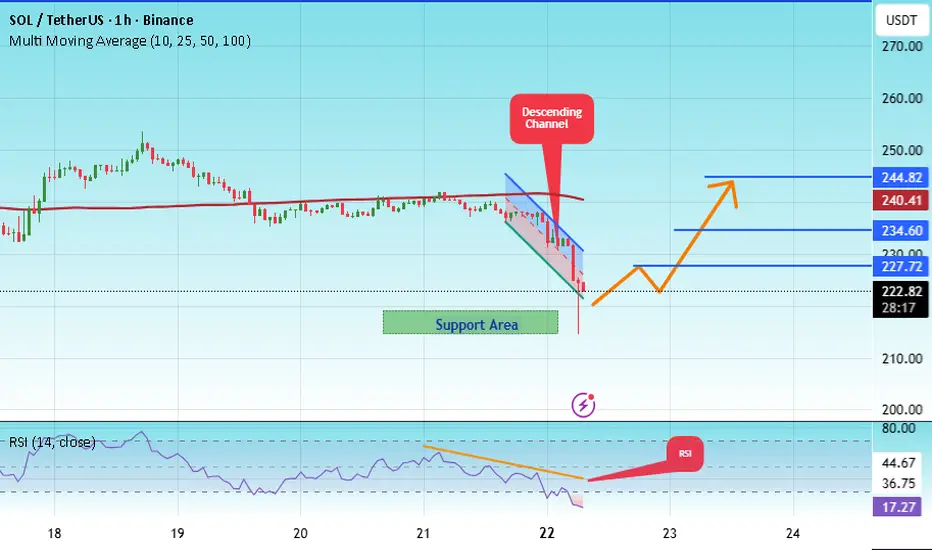
The price is moving within a descending channel on the 1-hour frame, adhering well to it, and is heading for a strong breakout and retest.
We have a bearish trend on the RSI indicator that is about to be broken and retested, which supports the upward move.
There is a major support area in green at 216, which represents a strong support point.
We are heading for consolidation above the 100 moving average.
Entry price: 218
First target: 227
Second target: 234
Third target: 244
Don't forget a simple matter: capital management.
When you reach the first target, save some money and then change your stop-loss order to an entry order.
For inquiries, please leave a comment.
Thank you.
SOL AGAIN/;Hello friends
You see that the price is stuck in a trading range and you must know that 80% of failures in trading ranges are fake!
Now, as the trading range lengthens, we can finally wait for its failure, and if it fails, the price will move by the same amount as the trading range.
*Trade safely with us*
